
Rationale and Objectives
Computed tomography (CT) section thickness and reconstruction kernel each influence CT measurements of emphysema. This study was performed to assess whether their effects are related to the magnitude of the measurement.
Materials and Methods
Low-radiation-dose multidetector CT was performed in 21 subjects representing a wide range of emphysema severity. Images were reconstructed using 20 different combinations of section thickness and reconstruction kernel. Emphysema index values were determined as the percentage of lung pixels having attenuation lower than multiple thresholds ranging from −960 HU to −890 HU. The index values obtained from the different thickness-kernel combinations were compared by repeated measures analysis of variance and Bland-Altman plots of mean versus difference in all subjects, and correlated with quantitative histology (mean linear intercept, Lm) in a subset of resected lung specimens.
Results
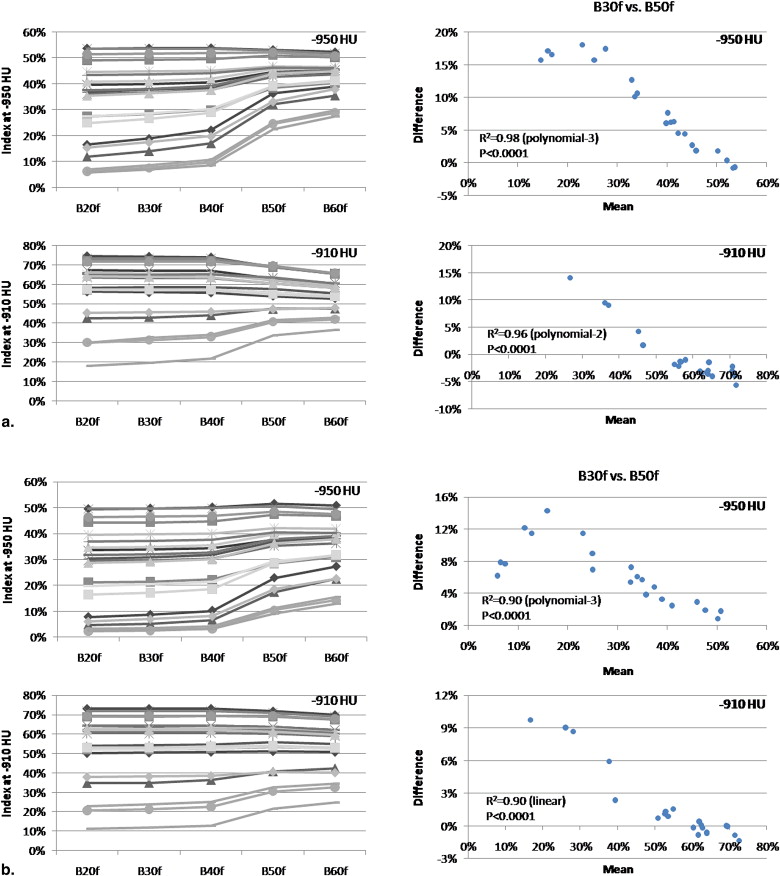
The effects of section thickness and reconstruction kernel on the emphysema index were significant ( P < .001) and diminished as the index attenuation threshold was raised. The changes in index values from changing the thickness-kernel combination were largest for subjects with intermediate index values (10%–30%), and became progressively smaller for those with lower and higher index values. This pattern was consistent regardless of the thickness-kernel combinations compared and the HU threshold used. Correlations between the emphysema index values obtained with each thickness-kernel combination and Lm ranged from r = 0.55–0.68 ( P = .007–.03).
Conclusion
The effects of CT section thickness and kernel on emphysema index values varied systematically with the magnitude of the emphysema index. All reconstruction techniques provided significant correlations with quantitative histology.
Quantitative computed tomography (CT) analysis of lung attenuation increasingly has been used in clinical research on chronic obstructive pulmonary disease for the objective measurement of emphysema. Emphysema has been quantified from CT data obtained in clinical trials to identify associations between emphysema and demographic factors ( ), genetic factors , and body habitus ; to assess drug treatment effects ; to distinguish chronic obstructive pulmonary disease phenotypes with and without emphysema ; and to evaluate the contribution of emphysema to airflow obstruction . Studies supporting the validity of measurements obtained using low-radiation-dose CT technique may further expand applications in clinical research.
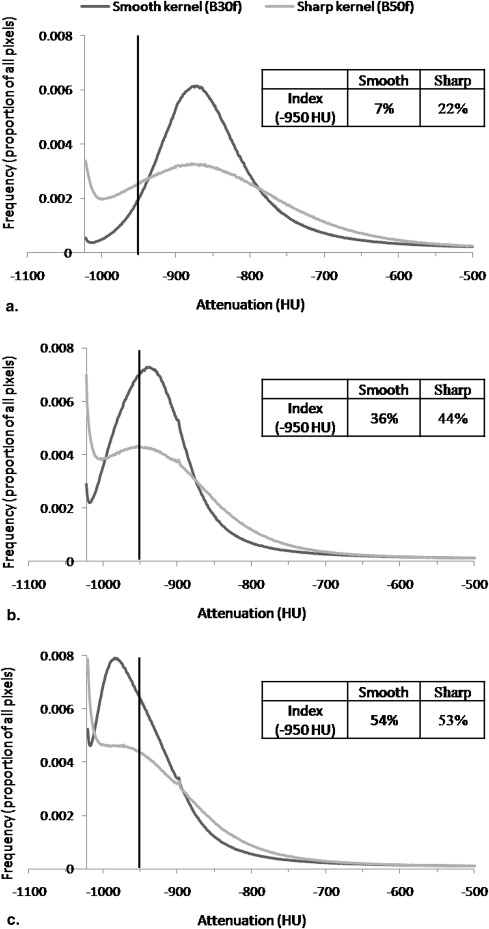
As the use of CT for emphysema quantification has grown, the potential for measurement variability related to certain CT technical parameters has been recognized . It has been reported that CT estimates of emphysema severity increase as section thickness decreases , and that higher resolution (edge-enhancing, sharper) image reconstruction kernels (also referred to as algorithms or filters) result in higher CT measurements of emphysema than lower resolution (smoothing) kernels . These effects may impact the ability to combine or compare CT measurements of emphysema in cross-sectional or longitudinal studies in which section thickness and reconstruction kernel are not held constant. This is particularly relevant to retrospective studies in which these parameters can no longer be changed, to prospective multicenter studies using multiple CT scanner models with different section thickness and kernel options, and to longitudinal studies during which scanners are replaced with new models.
Get Radiology Tree app to read full this article<
Get Radiology Tree app to read full this article<
Materials and methods
Subjects
Get Radiology Tree app to read full this article<
Table 1
Subject Characteristics
Transplant ( n = 12) Lobectomy ( n = 9) All ( n = 21) Female: male 5:7 5:4 10:11 Age, y (range) 58 ± 5 (46–64) 65 ± 5 (58–74) 61 ± 6 (46–74) Smoking history, pack years (range) 58 ± 19 (35–90) 60 ± 39 (13–135) 59 ± 29 (13–135) FEV 1 , % of predicted (range) 20 ± 7 (13–37) 78 ± 29 (45–128) 43 ± 34 (13–128) FVC, % of predicted (range) 52 ± 16 (36–90) 99 ± 25 (61–140) 71 ± 30 (36–140) FEV 1 /FVC (range) 0.32 ± 0.12 (0.19–0.67) 0.63 ± 0.14 (0.37–0.81) 0.44 ± 0.20 (0.19–0.81) TLC, % of predicted (range) 139 ± 19 (109–171) 130 ± 24 (111–180) 135 ± 20 (109–180) RV, % of predicted (range) 295 ± 64 (146–395) 177 ± 72 (111–320) 249 ± 88 (111–395) DLCO, % of predicted (range) 31 ± 11 (15–47) 81 ± 17 (53–102) 52 ± 29 (15–102)
FEV 1 , Forced expiratory volume in 1 second; FVC, Forced vital capacity; TLC, Total lung capacity; RV, Residual volume; DLCO, Diffusing capacity for carbon monoxide.
Values are mean ± SD.
The following data were not available: FEV 1 in one lobectomy patient, FVC in one lobectomy patient, TLC and RV in one transplant and two lobectomy patients, and DLCO in two transplant and two lobectomy patients.
Get Radiology Tree app to read full this article<
Get Radiology Tree app to read full this article<
Imaging and Image Analysis
Get Radiology Tree app to read full this article<
Get Radiology Tree app to read full this article<
Get Radiology Tree app to read full this article<
Lung Fixation and Quantitative Histology
Get Radiology Tree app to read full this article<
Get Radiology Tree app to read full this article<
Statistical Analysis
Get Radiology Tree app to read full this article<
Emphysema index mean=[(Index from thickness-kernel combinationa)+(Index from thickness-kernel combinationb)]÷2 Emphysema index mean
=
[
(
Index from thickness-kernel combination
a
)
+
(
Index from thickness-kernel combination
b
)
]
÷
2
The emphysema index difference was calculated according to the formula:
Emphysema index difference=(Index from thickness-kernel combinationa)−(Index from thickness-kernel combinationb) Emphysema index difference
=
(
Index from thickness-kernel combination
a
)
−
(
Index from thickness-kernel combination
b
)
The emphysema index mean vs. difference was examined at all HU thresholds. Curves were fit to these plots using linear and polynomial models with JMP 6.0 (SAS Institute, Cary, NC). Models having both the highest R 2 and F ratio were considered the best empirical fit.
Get Radiology Tree app to read full this article<
Get Radiology Tree app to read full this article<
Get Radiology Tree app to read full this article<
Results
Effects of Section Thickness and Reconstruction Kernel
Get Radiology Tree app to read full this article<
Table 2
Mean Computed Tomography Emphysema Index Values in all 21 subjects shown at 4 Representative Attenuation Thresholds (−950, −930, −910, and −890 HU) for each Combination of Section Thickness (1mm, 2mm, 5mm, and 10mm) and Reconstruction Kernel (B20f, B30f, B40f, B50f, and B60f)
B20f B30f B40f B50f B60f −950 HU 1 mm 32 ± 16 33 ± 15 34 ± 15 41 ± 9 42 ± 7 2 mm 29 ± 17 30 ± 16 31 ± 16 37 ± 11 37 ± 9 5 mm 26 ± 16 26 ± 16 27 ± 16 32 ± 13 34 ± 11 10 mm 22 ± 15 22 ± 15 22 ± 15 27 ± 14 28 ± 13 −930 HU 1 mm 45 ± 17 45 ± 16 46 ± 15 49 ± 10 49 ± 8 2 mm 43 ± 18 44 ± 17 44 ± 17 47 ± 12 46 ± 10 5 mm 39 ± 18 40 ± 18 40 ± 18 44 ± 15 44 ± 13 10 mm 35 ± 19 35 ± 19 36 ± 18 39 ± 16 40 ± 14 −910 HU 1 mm 57 ± 16 57 ± 15 58 ± 14 57 ± 10 56 ± 8 2 mm 56 ± 16 56 ± 16 57 ± 15 57 ± 12 55 ± 10 5 mm 53 ± 18 53 ± 17 53 ± 17 55 ± 14 54 ± 13 10 mm 49 ± 19 49 ± 18 49 ± 18 51 ± 16 51 ± 15 −890 HU 1 mm 68 ± 13 67 ± 13 67 ± 12 64 ± 10 62 ± 10 2 mm 67 ± 14 67 ± 13 67 ± 13 65 ± 11 62 ± 10 5 mm 64 ± 15 65 ± 15 65 ± 14 64 ± 13 63 ± 12 10 mm 61 ± 16 61 ± 16 61 ± 16 61 ± 14 60 ± 14
HU, Hounsfield unit.
Index values are mean index in % ± SD. Differences were statistically significant ( P < .001) for section thickness at all attenuation thresholds (including those not shown in table), and for reconstruction kernel at all attenuation thresholds (including those not shown in table) except -910 HU.
Get Radiology Tree app to read full this article<
Get Radiology Tree app to read full this article<
Get Radiology Tree app to read full this article<
Influence of Emphysema Index Magnitude
Get Radiology Tree app to read full this article<

Get Radiology Tree app to read full this article<
Quantitative CT and Histology
Get Radiology Tree app to read full this article<
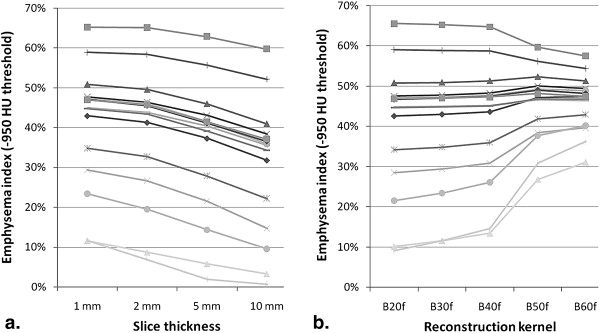
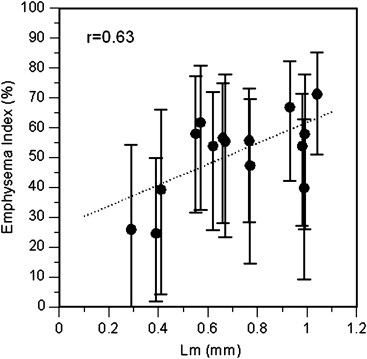
Table 3
Correlation Coefficients Comparing Lm Values in 4 Lobes and 11 Lungs with Computed Tomography Emphysema Index Values at Each Combination of section Thickness, Reconstruction Kernel, and Emphysema Index HU Threshold
1 mm B20f B30f B40f B50f B60f −960 HU .67 .67 .66 .63 .60 −950 HU .67 .67 .66 .62 .59 −940 HU .67 .67 .66 .61 .59 −930 HU .66 .66 .65 .60 .58 −920 HU .65 .64 .64 .59 .57 −910 HU .63 .63 .62 .59 .57 −900 HU .60 .60 .60 .58 .56 −890 HU .57 .57 .58 .57 .56
2 mm B20f B30f B40f B50f B60f −960 HU .67 .67 .67 .64 .63 −950 HU .68 .68 .67 .64 .62 −940 HU .68 .67 .67 .63 .61 −930 HU .67 .67 .66 .62 .60 −920 HU .65 .65 .65 .61 .60 −910 HU .63 .63 .63 .59 .59 −900 HU .60 .60 .60 .58 .58 −890 HU .57 .57 .57 .58 .57
5 mm B20f B30f B40f B50f B60f −960 HU .64 .65 .66 .61 .64 −950 HU .66 .67 .67 .60 .64 −940 HU .66 .67 .67 .60 .63 −930 HU .66 .67 .66 .60 .62 −920 HU .64 .65 .65 .59 .61 −910 HU .63 .64 .63 .58 .60 −900 HU .60 .61 .61 .57 .59 −890 HU .56 .58 .58 .55 .58
10 mm B20f B30f B40f B50f B60f −960 HU .61 .62 .62 .63 .63 −950 HU .64 .64 .64 .63 .63 −940 HU .65 .65 .65 .63 .62 −930 HU .65 .65 .65 .63 .61 −920 HU .64 .64 .64 .62 .61 −910 HU .62 .62 .62 .60 .59 −900 HU .60 .59 .59 .58 .58 −890 HU .56 .56 .56 .56 .56
Lm, mean linear intercept; HU, Hounsfield unit.
P < .05 for all r values.
Reconstruction kernels ordered from smoothest (B20f) to sharpest (B60f).
Get Radiology Tree app to read full this article<
Discussion
Get Radiology Tree app to read full this article<
Get Radiology Tree app to read full this article<
Get Radiology Tree app to read full this article<
Get Radiology Tree app to read full this article<
Get Radiology Tree app to read full this article<
Get Radiology Tree app to read full this article<
Get Radiology Tree app to read full this article<
Get Radiology Tree app to read full this article<
Get Radiology Tree app to read full this article<
Get Radiology Tree app to read full this article<
Get Radiology Tree app to read full this article<
Get Radiology Tree app to read full this article<
Get Radiology Tree app to read full this article<
References
1. Chatila W.M., Hoffman E.A., Gaughan J., et. al.: Advanced emphysema in African-American and white patients: do differences exist?. Chest 2006; 130: pp. 108-118.
2. Dransfield M.T., Washko G.R., Foreman M.G., et. al.: Gender differences in the severity of CT emphysema in COPD. Chest 2007; 132: pp. 464-470.
3. Martinez F.J., Curtis J.L., Sciurba F., et. al.: Sex differences in severe pulmonary emphysema. Am J Respir Crit Care Med 2007; 176: pp. 243-252.
4. Demeo D.L., Hersh C.P., Hoffman E.A., et. al.: Genetic determinants of emphysema distribution in the national emphysema treatment trial. Am J Respir Crit Care Med 2007; 176: pp. 42-48.
5. Ogawa E., Nakano Y., Ohara T., et. al.: Body mass index in male patients with chronic obstructive pulmonary disease; correlation with low attenuation areas on CT. Thorax 2009; 64: pp. 20-25.
6. Dirksen A.: Progress of emphysema in severe alpha 1-antitrypsin deficiency as assessed by annual CT. Acta Radiol 1997; 38: pp. 826-832.
7. Roth M.D., Connett J.E., D’Armiento J.M., et. al.: Feasibility of retinoids for the treatment of emphysema study. Chest 2006; 130: pp. 1334-1345.
8. Boschetto P., Quintavalle S., Zeni E., et. al.: Association between markers of emphysema and more severe chronic obstructive pulmonary disease. Thorax 2006; 61: pp. 1037-1042.
9. Patel B.D., Coxson H.O., Pillai S.G., et. al.: Airway wall thickening and emphysema show independent familial aggregation in chronic obstructive pulmonary disease. Am J Respir Crit Care Med 2008; 178: pp. 500-505.
10. Gierada D.S., Pilgram T.K., Whiting B.R., et. al.: Comparison of standard- and low-radiation-dose CT for quantification of emphysema. AJR Am J Roentgenol 2007; 188: pp. 42-47.
11. Madani A., De Maertelaer V., Zanen J., Gevenois P.A.: Pulmonary emphysema: radiation dose and section thickness at multidetector CT quantification—comparison with macroscopic and microscopic morphometry. Radiology 2007; 243: pp. 250-257.
12. Coxson H.O., Rogers R.M.: Quantitative computed tomography of chronic obstructive pulmonary disease. Acad Radiol 2005; 12: pp. 1457-1463.
13. Friedman P.J.: Imaging studies in emphysema. Proc Am Thorac Soc 2008; 5: pp. 494-500.
14. Reilly J.: Using computed tomographic scanning to advance understanding of chronic obstructive pulmonary disease. Proc Am Thorac Soc 2006; 3: pp. 450-455.
15. Kemerink G.J., Kruize H.H., Lamers R.J., et. al.: CT lung densitometry: dependence of CT number histograms on sample volume and consequences for scan protocol comparability. J Comput Assist Tomogr 1997; 21: pp. 948-954.
16. Boedeker K.L., McNitt-Gray M.F., Rogers S.R., et. al.: Emphysema: effect of reconstruction algorithm on CT imaging measures. Radiology 2004; 232: pp. 295-301.
17. Bland J.M., Altman D.G.: Comparing methods of measurement: why plotting difference against standard method is misleading. Lancet 1995; 346: pp. 1085-1087.
18. Guo J., Reinhardt J.M., Kitaoka H., et. al.: Integrated system for CT-based assessment of parenchymal lung disease. IEEE Int Symp Biomed Imaging 2002; pp. 871-874.
19. Gevenois P.A., De Vuyst P., de Maertelaer V., et. al.: Comparison of computed density and microscopic morphometry in pulmonary emphysema. Am J Respir Crit Care Med 1996; 154: pp. 187-192.
20. Madani A., Zanen J., de Maertelaer V., et. al.: Pulmonary emphysema: objective quantification at multi-detector row CT—comparison with macroscopic and microscopic morphometry. Radiology 2006; 238: pp. 1036-1043.
21. Muller N.L., Staples C.A., Miller R.R., et. al.: “Density mask.” An objective method to quantitate emphysema using computed tomography. Chest 1988; 94: pp. 782-787.
22. Mittermayer C., Wybitul K., Rau W.S., et. al.: Standardized fixation of human lung for radiology and morphometry; description of a “two chamber” system with formaldehyde vapor inflation. Pathol Res Pract 1978; 162: pp. 115-130.
23. Wright B.M., Slavin G., Kreel L., et. al.: Postmortem inflation and fixation of human lungs. A technique for pathological and radiological correlations. Thorax 1974; 29: pp. 189-194.
24. Woods J.C., Choong C.K., Yablonskiy D.A., et. al.: Hyperpolarized 3He diffusion MRI and histology in pulmonary emphysema. Magn Reson Med 2006; 56: pp. 1293-1300.
25. Bland J.M., Altman D.G.: Statistical methods for assessing agreement between two methods of clinical measurement. Lancet 1986; 1: pp. 307-310.
26. Yuan R., Mayo J.R., Hogg J.C., et. al.: The effects of radiation dose and CT manufacturer on measurements of lung densitometry. Chest 2007; 132: pp. 617-623.
27. Weibel E.R., Hsia C.C., Ochs M.: How much is there really? Why stereology is essential in lung morphometry. J Appl Physiol 2007; 102: pp. 459-467.
28. Mitzner W.: Use of mean airspace chord length to assess emphysema. J Appl Physiol 2008; 105: pp. 1980-1981.
29. Greaves I.A.: Commentaries on viewpoint: use of mean airspace chord length to assess emphysema. Mean airspace chord length is useful in assessing emphysema. J Appl Physiol 1982; 2008: pp. 105. author reply 1986–1987
30. Hsia C.C., Hyde D.M., Ochs M., Weibel E.R.: Commentaries on viewpoint: use of mean airspace chord length to assess emphysema. To be or not to be-accurate. J Appl Physiol 2008; 105: pp. 1982-1983. author reply 1986–1987
31. Bates J.H.: Commentaries on viewpoint: use of mean airspace chord length to assess emphysema. Purists versus pragmatists. J Appl Physiol 1983; 2008: pp. 105. author reply 1986–1987
32. Rossiter H.B., Breen E.C.: Commentaries on viewpoint: use of mean airspace chord length to assess emphysema. Assessment of emphysema benefits from quantification of heterogeneity. J Appl Physiol 2008; 105: pp. 1983-1984. author reply 1986–1987
33. Parameswaran H., Majumdar A., Hamakawa H., Suki B.: Commentaries on viewpoint: use of mean airspace chord length to assess emphysema. Pattern of parenchymal destruction determines lung function decline. J Appl Physiol 1984; 2008: pp. 105. author reply 1986–1987
34. Fehrenbach H.: Commentaries on viewpoint: use of mean airspace chord length to assess emphysema. What does Lm tell us about lung pathology?. J Appl Physiol 2008; 105: pp. 1984-1985. author reply 1986–1987
35. Mata J.F.: Commentaries on viewpoint: use of mean airspace chord length to assess emphysema. Mean airspace chord length and hyperpolarized gas magnetic-resonance measurements. J Appl Physiol 1985; 2008: pp. 105. author reply 1986–1987
36. Trotta B.M., Stolin A.V., Williams M.B., Gay S.B., Brody A.S., Altes T.A.: Characterization of the relation between CT technical parameters and accuracy of quantification of lung attenuation on quantitative chest CT. AJR Am J Roentgenol 2007; 188: pp. 1683-1690.