
Rationale and Objectives
Attending radiologist signature time (AST) is a variable and modifiable component of overall report turnaround time. Delays in finalized reports have potential to undermine radiologists’ value as consultants and adversely affect patient care. This study was performed to evaluate the impact of notebook computer distribution and daily automated e-mail notification on reducing AST.
Materials and Methods
Two simultaneous interventions were initiated in the authors’ radiology department in February 2010. These included the distribution of a notebook computer with preloaded software for each attending radiologist to sign radiology reports and daily automated e-mail notifications for unsigned reports. The digital dictation system archive and the radiology information system were queried for all radiology reports produced from January 2009 through August 2010. The time between resident approval and attending radiologist signature before and after the intervention was analyzed. Potential unintended “side effects” of the intervention were also studied.
Results
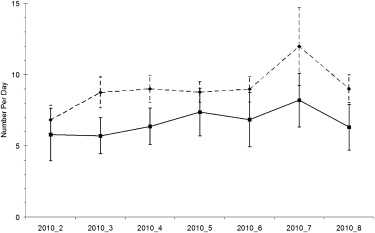
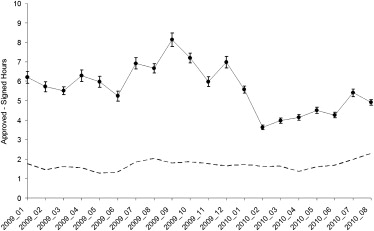
Resident-authored reports were signed, on average, 2.53 hours sooner after the intervention. This represented a highly significant ( P = .003) decrease in AST with all else held equal. Postintervention reports were authored by residents at the same rate (about 70%). An unintended “side effect” was that attending radiologists were less likely to make changes to resident-authored reports after the intervention.
Conclusions
E-mail notification combined with offsite signing can reduce AST substantially. Notebook computers with preloaded software streamline the process of accessing, editing, and signing reports. The observed decrease in AST reflects a positive change in the timeliness of report signature.
The timely provision of the final radiology report is a measure of professional quality in radiology. In fact, radiology report turnaround time (RTAT) is one of the standards regulated by accreditation organizations and cited in the American Board of Radiology’s Maintenance of Certification Practice Quality Improvement requirements . The American College of Radiology’s Practice Guideline for Communication of Diagnostic Imaging Findings states that “effective communication is a critical component of diagnostic imaging. Quality patient care can only be achieved when study results are conveyed in a timely fashion to those responsible for treatment decisions” . RTAT is one of multiple factors that contribute to timely communication. Delays in the availability of finalized reports have potential to negatively affect relationships with referring physicians, undermine radiologists’ value as consultants, and ultimately result in decreased quality of patient care .
The total time for the generation of finalized radiology results is dependent on a process consisting of multiple steps, starting with the initial request for a radiologic study and ending with the communication of the finalized radiology report to the referring physician. In an academic setting, a frequent intermediary step includes the dictation of a preliminary report by a trainee, which is reviewed, corrected, and then verified (signed) by the attending radiologist. The verification or signature time for an attending radiologist to edit and sign a finalized report can contribute significantly to RTAT, in some cases accounting for close to one third to one half of total RTAT . It is this segment of the report turnaround process over which faculty radiologists have direct control and can potentially modify. Therefore, time from resident approval to final attending radiologist signature was selected as the focus of our interventions.
Get Radiology Tree app to read full this article<
Get Radiology Tree app to read full this article<
Get Radiology Tree app to read full this article<
Get Radiology Tree app to read full this article<
Materials and methods
Get Radiology Tree app to read full this article<
Interventions
Get Radiology Tree app to read full this article<
Get Radiology Tree app to read full this article<
Get Radiology Tree app to read full this article<
Data Sources and Variables
Get Radiology Tree app to read full this article<
Get Radiology Tree app to read full this article<
Get Radiology Tree app to read full this article<
Get Radiology Tree app to read full this article<
Statistical Analysis
Get Radiology Tree app to read full this article<
Table 1
Reports Included in the Study
Preintervention Postintervention Total reports 293,434 168,482 Dictated by resident 203,061 (69.2%) 120,507 (71.5%) Dictated by resident and changed by attending radiologist before signature 69,281 (34.1%) 39,173 (32.5%)
Table 2
Categorical Variable Descriptive Statistics
Variable Level Preintervention Postintervention Patient location Emergency department 21.21% 26.36% Inpatient 33.88% 31.72% Outpatient 44.90% 41.93% Priority Stat 36.17% 39.16% Routine 63.83% 60.84% Imaging location Hospital wing 1 59.98% 39.53% Hospital wing 2 7.37% 31.58% Outpatient center 1 21.16% 18.55% Outpatient center 2 4.13% 3.87% Outpatient center 3 7.35% 6.47% Modality Computed tomography 18.92% 19.57% Fluoroscopy 3.63% 3.30% Mammography 3.92% 3.67% Magnetic resonance imaging 6.85% 6.75% Nuclear medicine 1.79% 1.64% Positron emission tomography 0.49% 0.48% Ultrasound 7.63% 8.07% Radiography 56.78% 56.52% Division Thoracoabdominal 53.35% 54.15% Interventional 2.22% 2.11% Mammographic 4.15% 3.91% Musculoskeletal 22.95% 21.85% Neurologic 17.33% 17.98%
Percentages are for each level within the five variables.
Table 3
Quantitative Variable Descriptive Statistics
Variable Preintervention Postintervention Number of accession numbers (exams) covered by each dictation 1.18 ± 0.52 (1.176–1.180) 1.17 ± 0.49 (1.170–1.175) AST (hours) 6.34 ± 16.4 (6.270–6.415) 4.35 ± 9.83 (4.295–4.406) lnRAED ∗ 7.65 ± 1.84 (7.637–7.664) 7.60 ± 1.87 (7.583–7.620)
Data are expressed as mean ± standard deviation (95% confidence interval).
AST, attending radiologist signature time; lnRAED, natural logarithm of resident–attending radiologist edit distance.
Get Radiology Tree app to read full this article<
Get Radiology Tree app to read full this article<
Get Radiology Tree app to read full this article<
Get Radiology Tree app to read full this article<
Get Radiology Tree app to read full this article<
Get Radiology Tree app to read full this article<
Results
Get Radiology Tree app to read full this article<
Get Radiology Tree app to read full this article<
Get Radiology Tree app to read full this article<
Get Radiology Tree app to read full this article<
Get Radiology Tree app to read full this article<
Get Radiology Tree app to read full this article<
Discussion
Get Radiology Tree app to read full this article<
Get Radiology Tree app to read full this article<
Get Radiology Tree app to read full this article<
Get Radiology Tree app to read full this article<
Get Radiology Tree app to read full this article<
Get Radiology Tree app to read full this article<
Get Radiology Tree app to read full this article<
Get Radiology Tree app to read full this article<
Get Radiology Tree app to read full this article<
References
1. Seltzer S.E., Kelly P., Adams D.F., et. al.: Expediting the turnaround of radiology reports: use of total quality management to facilitate radiologists’ report signing. AJR Am J Roentgenol 1994; 162: pp. 775-781.
2. Strife J.L., Kun L.E., Becker G.J., et. al.: The American Board of Radiology perspective on maintenance of certification: part IV—practice quality improvement in diagnostic radiology. AJR Am J Roentgenol 2007; 188: pp. 1183-1186.
3. American College of Radiology. ACR practice guideline for communication of diagnostic imaging findings. Available at: http://www.acr.org/SecondaryMainMenuCategories/quality_safety/guidelines/toc.aspx . Accessed October 11, 2010.
4. Boland G.W., Guimaraes A.S., Mueller P.R.: Radiology report turnaround: expectations and solutions. Eur Radiol 2008; 18: pp. 1326-1328.
5. Oguz K.K., Yousem D.M., Deluca T., et. al.: Impact of pager notification on report verification times. Acad Radiol 2002; 9: pp. 954-959.
6. Lepanto L.: Impact of electronic signature on radiology report turnaround time. J Digit Imaging 2003; 16: pp. 306-309.
7. Langer L.G.: Impact of tightly coupled PACS/speech recognition on report turnaround time in the radiology department. J Digit Imaging 2002; 15: pp. 234-236.
8. Morgan M.B., Branstetter B.F., Lionetti D.M., et. al.: The radiology digital dashboard: effects on report turnaround time. J Digit Imaging 2008; 21: pp. 50-58.
9. Andriole K.P., Prevedello L.M., Dufault A., et. al.: Augmenting the impact of technology adoption with financial incentive to improve radiology report signature times. J Am Coll Radiol 2010; 7: pp. 198-204.
10. Boland G.W., Halpern E.F., Gazelle G.S.: Radiologist report turnaround time: impact of pay-for-performance measures. AJR Am J Roentgenol 2010; 195: pp. 707-711.
11. Johnson A.J., Ying J., Swan J.S., et. al.: Improving the quality of radiology reporting: a physician survey to define the target. J Am Coll Radiol 2004; 1: pp. 497-505.
12. Swensen S.J., Johnson C.D.: Flying in the plane you service: patient-centered radiology. J Am Coll Radiol 2010; 7: pp. 216-221.