
Rationale and Objectives
This study evaluates utilization trends of emergency department (ED)-ordered magnetic resonance imaging (MRI) examinations in an adult academic medical center over a 5-year period (2001–2005).
Materials and Methods
MRI examinations from the ED-ordering location were identified by searching the radiology information system (RIS). Overall MRI volume and ED patient encounters were also assessed during the same period. Each examination was assessed by type of examination, examination completion time, and primary and secondary clinical indications by reviewing the RIS and medical record.
Results
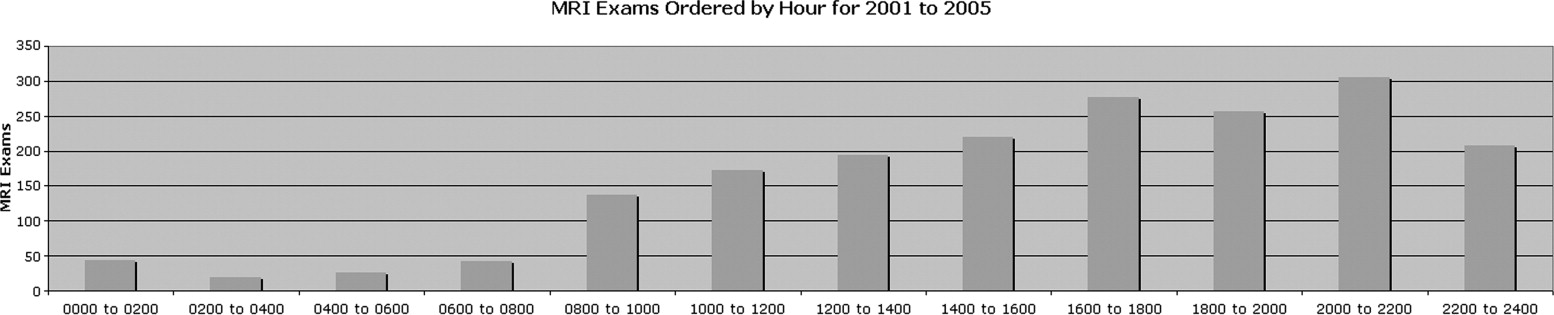
During the study period, 1,900 ED-ordered MRI examinations were performed on 1,020 patients. During the same period, 62,823 total MRI examinations were performed, and the total ED patient volume was 420,840. ED-ordered MRI volume increased 391% over the study period (125 to 614 examinations/year), whereas total MRI volume increased only 38.9% and ED patient volume in our institution actually decreased by −9%. MRI examinations of the brain, magnetic resonance angiography of the head and neck, and spinal MRI were the most commonly ordered tests. Clinical indications were analyzed. Peak times of ED-ordered examination completion were between 4:00 PM and 11:00 PM. A total of 15.5% of examinations required overtime or callback of MRI technologists for completion.
Conclusions
Multiple reasons are suggested that may increase utilization (perceived need for diagnostic certainty, as well as medico-legal and patient-driven factors). Whether this increase in MRI utilization resulted in improved patient outcomes is unclear and should be studied further. Implications for radiologist coverage and resident training are discussed.
In the United States, the total volume of imaging studies continues to increase ( ). The volume, relative value units (RVU), and RVU per case-mix-adjusted admission of cross-sectional imaging techniques, such as magnetic resonance imaging (MRI) and computed tomography, has particularly increased ( ). In the emergency department (ED) setting, previous studies have assessed utilization trends of computed tomographic (CT) imaging and found significant increases over the past 5 years ( ). Increasing medical costs related to imaging can be significant ( ). Concerns regarding radiation exposure have prompted more detailed assessment of CT utilization, especially in the pediatric population ( ). Although less commonly obtained as an emergency study, we have noticed a trend of increased utilization of MR studies in the ED in our institution. MRI is a highly useful imaging modality for a wide variety of clinical indications and provides unique information that can clearly affect patient care. Although radiation exposure concerns are not an issue with MRI, the more limited availability of MRI, difficulty in scheduling MRI examinations at some institutions, less experience of residents with MRI interpretation, and potential for significant impact of emergency/unscheduled MRI examinations on radiologist and technologist staffing prompted our evaluation of MRI performance. We could find no previous study assessing overall MRI utilization in the ED setting. Baseline information is necessary to begin to evaluate potential areas of overuse, define examinations that are high yield for clinically important findings, provide a framework for resident instruction in commonly performed examinations and indications, and address staffing changes potentially made necessary by changes in utilization.
Materials and Methods
Emergency MRI exams were identified by electronically searching the radiology information system (Quadris, Cerner Corp, Kansas City, MO) for ED-ordering location between January 1, 2001, and December 31, 2005. These included examinations ordered while the patient was in the emergency room. The patient may have been subsequently admitted before examination performance; however, this identified examinations that were unscheduled requiring emergent interpretation, thus exhibiting maximum impact on the imaging department. Examinations were grouped by type of examination, time of examination order, time of examination completion, date, and clinical indication. Clinical indications were identified by searching the medical record and ordering indication and described as primary and secondary. The primary indication is the main reason given for the ordering the examination. The secondary indication could include other related indications. An example indication for a brain MRI would be “mental status change, assess for intracranial mass.” The primary indication would be “mental status change” and the secondary “possible intracranial mass.” These indications were combined for analysis to give a more complete picture of the clinical scenario of each examination, and were grouped into standard categories. The total number of MRI examinations and ED visits was also obtained and compared with the ED-ordering location MRI volume. Ordering physicians included ED physicians and clinical house staff primarily from the neurosurgery, neurology, and surgical departments.
Get Radiology Tree app to read full this article<
Get Radiology Tree app to read full this article<
Get Radiology Tree app to read full this article<
Results
Get Radiology Tree app to read full this article<
Table 1
Number of ED-Ordered MRI Examinations, Total MRI Examinations, and ED Visits 2001–2005
Year ED MRI Exams % Change ED MRI Patients % Change MRI Exams per Patient Total MRI Exams % Change ED Visits % Change 2001 125 NA 76 NA 1.64 10,579 NA 85,475 NA 2002 205 64.00 114 50.00 1.8 10,870 2.70 87,572 2.40 2003 409 99.50 218 91.23 1.9 12,413 14.20 85,850 −2.00 2004 547 33.70 288 32.11 1.9 14,275 15.00 84,128 −2.00 2005 614 12.20 324 12.50 1.9 14,686 2.90 77,815 −7.50
ED: emergency department; MRI: magnetic resonance imaging; % change: yearly percent change in volume; NA: not applicable.
Get Radiology Tree app to read full this article<
Get Radiology Tree app to read full this article<
Table 2
Number of ED-Ordered Examinations 2001–2005 by Examination Type
Exam 2001 2002 2003 2004 2005 Total % MRI head 23 49 133 166 171 542 28.5 MRA head 28 36 89 135 125 413 21.7 MRA neck 24 37 77 110 107 355 18.7 MRI cervical 14 30 47 43 91 225 11.8 MRI lumbar 23 32 37 57 77 226 11.8 MRI thoracic 8 14 19 24 40 105 5.5 Other 5 7 7 12 3 34 1.8
Other includes MRI lower extremity (23), MRI orbits (5), MRI pelvis (3), and MRI chest (3).
ED: emergency department; MRI: magnetic resonance imaging; MRA: magnetic resonance angiography.
Get Radiology Tree app to read full this article<
Get Radiology Tree app to read full this article<
Table 3
Top Five Clinical Indications for ED-Ordered MRI Examinations 2001–2005
Exam Type 1 2 3 4 5 MRI head Weakness (94/13.1%) Headache (61/8.5%) Sensory deficit (60/8.3%) Vertigo/ataxia (54/7.5%) Stroke/NOS (45/6.2%) MRA head Weakness (88/15.4%) Headache (58/10.1%) Sensory deficit (51/8.9%) Vertigo/ataxia (49/8.6%) Stroke/NOS (36/6.3%) MRA neck Weakness (84/17.9%) Sensory deficit (47/10.0%) Vertigo/ataxia (43/9.2%) Trauma/deficit (36/7.8%) Stroke/NOS (32/6.8%) MRI cervical Fracture (35/12.9%) Sensory (31/11.4%) Trauma/weakness (31/11.4%) Trauma/NOS (28/10.3%) Pain (27/9.9%) MRI lumbar Possible cord compression (50/19.0%) Weakness (35/13.2%) Pain (35/13.2%) Sensory (18/6.8%) Possible discitis (17/6.4%) MRI thoracic Possible cord compression (26/24.8%) Weakness (21/16.9%) Trauma/weakness (12/9.7%) Trauma/fracture (9/7.2%) Sensory (9/7.2%)
ED: emergency department; MRI: magnetic resonance imaging; MRA: magnetic resonance angiography; NOS: not otherwise specified; possible cord compression: symptoms are decreased rectal tone or new incontinence; trauma/NOS or stroke/NOS: possible stroke- or traumatic-related symptoms that were not otherwise specified by the ordering personnel; sensory: new sensory symptoms including paresthesia or sensory loss; weakness: typically meant focal weakness or motor deficit, although generalized weakness was also included for brain MRI examinations; trauma deficit: trauma with new neurologic deficit (for neck MRA, this was typically for evaluation of traumatic vessel dissection).
Get Radiology Tree app to read full this article<
Get Radiology Tree app to read full this article<
Get Radiology Tree app to read full this article<
Get Radiology Tree app to read full this article<
Get Radiology Tree app to read full this article<
Get Radiology Tree app to read full this article<
Discussion
Get Radiology Tree app to read full this article<
Get Radiology Tree app to read full this article<
Get Radiology Tree app to read full this article<
Get Radiology Tree app to read full this article<
Get Radiology Tree app to read full this article<
Get Radiology Tree app to read full this article<
Get Radiology Tree app to read full this article<
Get Radiology Tree app to read full this article<
Get Radiology Tree app to read full this article<
Get Radiology Tree app to read full this article<
Get Radiology Tree app to read full this article<
Get Radiology Tree app to read full this article<
Get Radiology Tree app to read full this article<
References
1. Oguz K.K., Yousem D.M., Deluca T., et. al.: Effect of emergency department CT on neuroimaging case volume and positive scan rates. Acad Radiol 2002; 9: pp. 1018-1024.
2. Rao V.M., Parker L., Levin D., et. al.: Use trends and geographic variation in neuroimaging: nationwide medicare data for 1993 and 1998. AJNR Am J Neuroradiol 2001; 22: pp. 1643-1649.
3. Matin A., Bates D.W., Sussman A., et. al.: Inpatient radiology utilization: trends over the past decade. AJR Am J Roentgenol 2006; 186: pp. 7-11.
4. Broder J., Warshauer D.M.: Increasing utilization of computed tomography in the adult emergency department, 2000–2005. Emerg Radiol 2006; 13: pp. 25-30.
5. Baker L., Birnbaum H., Geppert J., et. al.: The relationship between technology availability and health care spending. Health Aff (Millwood) 2003; W3: pp. 537-551.
6. Donnelly L.F.: Reducing radiation dose associated with pediatric CT by decreasing unnecessary examinations. AJR Am J Roentgenol 2005; 176: pp. 289-296.
7. ACR appropriateness criteria, 2006. http://www.acr.org/ac Accessed August 10, 2007
8. Baker L.C., Wheeler S.K.: Managed care and technology diffusion: the case of MRI. Health Aff (Millwood) 1998; 17: pp. 195-207.
9. Birbeck G.L., Gifford D., Song J., et. al.: Do malpractice concerns, payment mechanisms, and attitudes influence test-ordering decisions?. Neurology 2004; 62: pp. 119-121.
10. Chalela J.A., Kidwell C.S., Nentwich L.M., et. al.: Magnetic resonance imaging and computed tomography in emergency assessment of patients with suspected acute stroke: a prospective comparison. Lancet 2007; 369: pp. 293-298.
11. Alberts M.J., Latchaw R.E., Selman W.R., et. al., for the Brain Attack Coalition: Recommendations for comprehensive stroke centers: a consensus statement from the Brain Attack Coalition. Stroke 2005; 36: pp. 1597-1616.
12. Köhrmann M., Jüttler E., Huttner H., et. al.: Acute stroke imaging for thrombolytic therapy—an update. Cerebrovasc Dis 2007; 24: pp. 161-169.
13. Caille’ J., Dousset V.: Benefits of cerebral magnetic resonance imaging examinations with normal results. Acad Radiol 1996; 3: pp. S38-S39.
14. Demaerel P., Beastse E., Roels K., et. al.: Intermediate short-term outcomes after brain computed tomography and magnetic resonance imaging in neurology outpatients. Med Decis Making 2001; 21: pp. 444-450.