
To evaluate financial performance, academic radiology departments most often measure examination volume and general technical and professional expenses. Although these metrics are not standardized, their frequency of use reflects that productivity and financial health are high priorities for academic radiology departments across the United States. In this article, we discuss both of these topics, in the context of projects to expand services, particularly those with an information technology (IT) component. First, we discuss several informatics innovations that increase productivity or expand service. Second, we explain core financial analysis concepts applicable to radiology departments. Third, we discuss the unique challenge of evaluating a potential IT project for an academic radiology department, when intangible benefits are difficult to quantify. Financial models are only one of several components used for guidance in strategic decisions, but are crucial to building a business case that justifies the initial or capital investment as well as startup and ongoing operational expenses.
The academic medicine endeavor is traditionally described as a three-legged stool, metaphorically representing clinical practice, education, and research. A fourth leg, representing administrative responsibilities, recently has been recognized. These administrative responsibilities include evaluating a department’s financial performance, which for radiology most often involves non-standardized metrics such as examination volume, and general technical and professional expenses . Because hospital managers often trust radiologists with decisions about technological innovations and their associated costs, workflow implications, and potential revenue, this fourth leg is particularly apparent among radiologists .
Dividing time appropriately among the different legs of the stool is essential. Therefore, time is a valuable resource that must be allocated and used efficiently. Many informatics tools exist to help academic radiology departments achieve this goal. For clinical practice, which constitutes the largest portion of time for most academic radiology faculty, there are picture archiving and communication systems (PACS) and, more recently, multisite and integrated work list tools. In the research realm, there are data-mining tools for radiology reports, and dedicated research PACS. For education, there are integrated and searchable electronic teaching files. Finally, for administration, business analytics tools and computer-based scheduling systems are relevant examples.
Deciding which informatics tools are worthwhile investments is challenging. In business, financial modeling aids such decisions. Previous publications have described financial modeling for decision-making in the context of private practice radiology . Most successful academic radiology departments also use financial modeling . To manage an academic radiology department, and to communicate with hospital and health center leaders, particularly in the current medical economy, academic radiology administrators must be financially articulate. In this article, we describe several informatics innovations that can increase productivity or market share. Then, we introduce basic financial modeling tools. Finally, we discuss their applications and limitations in the context of academic radiology departments.
Information technology and radiology
Of all medical specialties, radiology historically has been the leader in implementing effective information technology (IT) solutions. Radiology information systems (RIS) and PACS are just the beginning of many innovations that IT offers radiologists to improve productivity. In fact, it has been suggested that every radiology practice designate a medical imaging informatics radiologist to facilitate adopting these technological advances .
Clinical information systems can be categorized into four broad categories based on what they improve: documentation and access to clinical information, communication, access to medical knowledge, and decision-making . In this article, systems for improving access to clinical information include PACS storage of outside images, web-based PACS, automated presentation of relevant priors, PACS integration with external work lists, and PACS integration with electronic medical records (EMRs). Tools for improving communication include multifacility common work lists and systems for notifying clinicians of subcritical findings. Although PACS storage of outside images and web-based PACS do not have an easily quantifiable impact on radiologist and referring physician productivity, they likely result in increased satisfaction among referring physicians, more accurate reports, and improved service. In contrast, the first group has a more direct impact on productivity. IT innovations that improve access to medical knowledge and decision support are beyond the scope of this article, but examples relevant to radiology include PACS integration with a resource such as STATdx (Amirsys, Inc., Salt Lake City, UT ©2011) and a RIS that alerts the radiologist when protocoling a contrast-enhanced study for a patient with a known contrast allergy ( Table 1 ).
Table 1
IT Innovations or Clinical Information Systems, Grouped into Four Categories
Category IT Innovation or Clinical Information System Documentation and access to clinical information PACS storage of outside images
Web-based PACS
Automated presentation of relevant priors
PACS integration with external work lists
PACS integration with EMRs Communication Multifacility common work lists
Systems for reporting subcritical findings Access to medical knowledge PACS integration with STATdx Decision support Contrast allergy alert system
EMR, electronic medical records; PACS, picture archiving and communication systems.
Get Radiology Tree app to read full this article<
Get Radiology Tree app to read full this article<
Get Radiology Tree app to read full this article<
Get Radiology Tree app to read full this article<
Get Radiology Tree app to read full this article<
Get Radiology Tree app to read full this article<
Get Radiology Tree app to read full this article<
Financial modeling
Get Radiology Tree app to read full this article<
Get Radiology Tree app to read full this article<
Get Radiology Tree app to read full this article<
Get Radiology Tree app to read full this article<
$2,000,000$480,000/year=4.2years $
2
,
000
,
000
$
480
,
000
/
year
=
4.2
years
or 50 months ( Table 2 ). Following the payback rule, one should purchase the scanner, because the payback period is shorter than the enterprise specified cutoff of 5 years.
Table 2
An Example of the Payback Method for Evaluating the Purchase of a CT Scanner
Year Cash Flow Net 0 −$2,000,000 −$2,000,000 1 $480,000 −$1,520,000 2 $480,000 −$1,040,000 3 $480,000 −$560,000 4 $480,000 −$80,000 5 $480,000 $400,000 6 $480,000 $880,000 7 $480,000 $1,360,000
Get Radiology Tree app to read full this article<
NPV Method
Get Radiology Tree app to read full this article<
FV=PV×(1+r)t F
V
=
P
V
×
(
1
+
r
)
t
where FV is the future value of the investment, PV is the present value of the investment, r is the decimal interest rate, and t is the number of years invested. This equation can be solved for PV to obtain the formula for present value:
PV=FV(1+r)t P
V
=
F
V
(
1
+
r
)
t
Get Radiology Tree app to read full this article<
Get Radiology Tree app to read full this article<
Get Radiology Tree app to read full this article<
NPV=∑Tt=0CF(1+r)t=CF0+CF1(1+r)1+CF2(1+r)2+…+CFT(1+r)T N
P
V
=
∑
t
=
0
T
C
F
(
1
+
r
)
t
=
C
F
0
+
C
F
1
(
1
+
r
)
1
+
C
F
2
(
1
+
r
)
2
+
…
+
C
F
T
(
1
+
r
)
T
where CF is the cash flow, CF 0 is the initial investment, CF t is the cash flow (revenue − expenses) for the period at time t , r is the discount rate, and T is the number of time periods over which the model is being projected. Note that because CF 0 is the initial investment, it is a negative number. Excel (Microsoft, Redmond, WA) has an NPV function that performs these calculations, given a discount rate and a set of cash flows. As a simple example, we can calculate the NPV for the same CT scanner used in the payback method example, assuming a discount rate of 8% and a project lifetime of 7 years ( Table 3 ). An additional example including investment, cash flows, and expenses is shown in Table 4 , assuming a discount rate of 5% and a project lifetime of 4 years. In finance, the NPV rule states that a project should be accepted if it has a positive NPV for a given discount rate . Thus, based on this financial model, we should purchase the CT scanner in both examples. The CT scanner is used here as the example for how to apply the NPV method because it produces concrete cash flows; an example using an IT project investment will be discussed later in this article.
Table 3
An Example of the NPV Method for Evaluating the Purchase of the Same CT Scanner as in Table 2
Year Net Cash Flow Net Cash Flow in Present Value 0 −$2,000,000 −$2,000,000 1 $480,000 $444,444 2 $480,000 $411,523 3 $480,000 $381,039 4 $480,000 $352,814 5 $480,000 $326,680 6 $480,000 $302,481 7 $480,000 $280,075 NPV $499,058
NPV, net present value.
Table 4
An Example of the NPV Method
Year Investment Revenue Expenses Net Cash Flow Net Cash Flow in Present Value 0 −$500,000 $200,000 −$100,000 −$400,000 −$400,000 1 $300,000 −$150,000 $150,000 $142,857.14 2 $300,000 −$150,000 $150,000 $136,054.42 3 $250,000 −$150,000 $100,000 $86,383.76 4 $250,000 −$150,000 $100,000 $82,270.25 NPV $47,566
NPV, net present value.
Get Radiology Tree app to read full this article<
Get Radiology Tree app to read full this article<
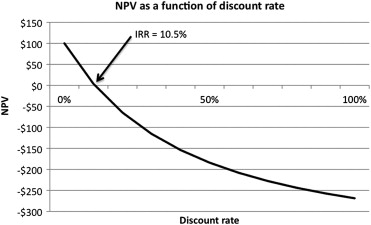
IRR Method
Get Radiology Tree app to read full this article<
Table 5
An Example of the IRR Method
Year Investment Revenue Expenses Net Cash Flow 0 −$500,000 $200,000 −$100,000 −$400,000 1 $300,000 −$150,000 $150,000 2 $300,000 −$150,000 $150,000 3 $250,000 −$150,000 $100,000 4 $250,000 −$150,000 $100,000 IRR 10.5%
IRR, internal rate of return.
Get Radiology Tree app to read full this article<
Get Radiology Tree app to read full this article<
Get Radiology Tree app to read full this article<
Get Radiology Tree app to read full this article<
Get Radiology Tree app to read full this article<
Applications in academic radiology departments
Get Radiology Tree app to read full this article<
Get Radiology Tree app to read full this article<
Table 6
An example of the NPV method for evaluating an IT software project
Year Estimated Income Annual Cost for Support and Software License Fee Net Estimated Cash Flow Net Estimated Cash Flow in Present Value 1 $45,000 −$30,000 $15,000 $13,889 2 $45,000 −$30,000 $15,000 $12,860 3 $45,000 −$30,000 $15,000 $11,907 NPV $38,656
Get Radiology Tree app to read full this article<
Get Radiology Tree app to read full this article<
Get Radiology Tree app to read full this article<
References
1. Ondategui-Parra S., Bhagwat J.G., Zou K.H., et. al.: Use of productivity and financial indicators for monitoring performance in academic radiology departments: U.S. nationwide survey. Radiology 2005; 236: pp. 214-219.
2. Ondategui-Parra S., Bhagwat J.G., Zou K.H., et. al.: Practice management performance indicators in academic radiology departments. Radiology 2004; 233: pp. 716-722.
3. Hillman B.J., Munger P.L.: Faculty contracting for the technical management of an academic radiology department: a case study. Acad Radiol 1995; 2: pp. 341-344.
4. Siegle R.L., Nelsen L.: Changing roles: the radiologist in management. Acad Radiol 1999; 6: pp. 307-313.
5. Berlin J.W., Lexa F.J.: Finance for practicing radiologists. J Am Coll Radiol 2005; 2: pp. 254-261.
6. Lexa F.J., Berlin J.W.: Financial modeling in medicine: cash flow, basic metrics, the time value of money, discount rates, and internal rate of return. J Am Coll Radiol 2005; 2: pp. 225-231.
7. Lexa F.J., Berlin J.W.: First principles for financial modeling in medicine. J Am Coll Radiol 2005; 2: pp. 220-224.
8. Yousem D.M., Norman J., Beauchamp J.: Radiology Business Practice: How to Succeed.2008.SaundersPhiladelphia
9. Geis J.R.: Medical imaging informatics: how it improves radiology practice today. J Digit Imaging 2007; 20: pp. 99-104.
10. Shea S., Clayton P.D.: Computerized clinical decision support systems begin to come of age. Am J Med 1999; 106: pp. 261-262.
11. Burnside E.S., Sickles E.A., Sohlich R.E., et. al.: Differential value of comparison with previous examinations in diagnostic versus screening mammography. AJR Am J Roentgenol 2002; 179: pp. 1173-1177.
12. Sodickson A., Opraseuth J., Ledbetter S.: Outside imaging in emergency department transfer patients: CD import reduces rates of subsequent imaging utilization. Radiology 2011; 260: pp. 408-413.
13. Kalia V., Carrino J.A., Macura K.J.: Policies and procedures for reviewing medical images from portable media: survey of radiology departments. J Am Coll Radiol 2010; 8: pp. 39-48.
14. Sipe C.Y., West R.W.: Risks associated with outside radiographs. J Am Coll Radiol 2005; 2: pp. 859-861.
15. Avrin D. “Storage Model.” Samuel J. Dwyer, III, PhD Memorial Lecture. Society for Imaging Informatics in Medicine. Charlotte, NC, 6 June 2009.
16. RSNA Image Share Network Reaches First Patients. Available at: http://www.rsna.org/Publications/rsnanews/September-2011/image_share_feature.cfm . Accessed October 16, 2011.
17. Arenson R.L.: PACS: current status and cost-effectiveness. Eur Radiol 2000; 10: pp. S354-S356.
18. Andriole K., Avrin D., Yin L., et. al.: PACS databases and enrichment of the folder manager concept. J Digital Imaging 2000; 13: pp. 3-12.
19. Coakley F, Dillon W, Elicker B, et al. Radiology Department Policy on Subcritical Findings. Available at: http://www.radiology.ucsf.edu/patient-care/patient-safety/results/subcritical-findings . Accessed October 16, 2011.
20. Medicare programs: fee schedules for radiologists’ services. Fed Register 1989; pp. 8994-9023.
21. Available at: Investopedia.com . Accessed September 19, 2011.
22. Parente S., Dunbar J.: Is health information technology investment related to the financial performance of US hospitals? An exploratory analysis. Int J Healthcare Technol Manage 2001; 3: pp. 48-58.
23. Berk J., DeMarzo P.: Corporate Finance.2nd ed.2011.Prentice HallBoston
24. Brealey R.A., Myers S.C., Allen F.: Principles of Corporate Finance.2nd ed.2011.McGraw-HillNew York
25. Graham J., Harvey C.: How do CFOs make capital budgeting and capital structure decisions?. J Appl Corp Finance 2002; 15.1: pp. 8-23.
26. Ryan P., Ryan G.: Capital budgeting practices of the Fortune 1000: how have things changed?. J Business Manage 2002; 8: pp. 355-364.
27. Breitner L.K., Anthony R.N.: Essentials of Accounting.10th ed.2010.Prentice HallUpper Saddle River, NJ
28. Reilly S.R., Avrin D.: Financial modeling.Dreyer K.H.Thrall J.Mehta A.PACS: a guide to the digital revolution.2006.Springer Science+Business Media, Inc.New York:pp. 125-144.
29. Parrino R., Kidwell D.: Fundamentals of Corporate Finance.2009.John Wiley & SonsNew York
30. Graham J., Harvey C.: The theory and practice of corporate finance: evidence from the field. J Finan Econ 2001; 60: pp. 187-243.