
Rationale and Objectives
To determine the potential value of entropy of T2-weighted imaging combined with apparent diffusion coefficient (ADC) before uterine artery embolization (UAE) for prediction of uterine leiomyoma volume reduction (VR) after UAE.
Materials and Methods
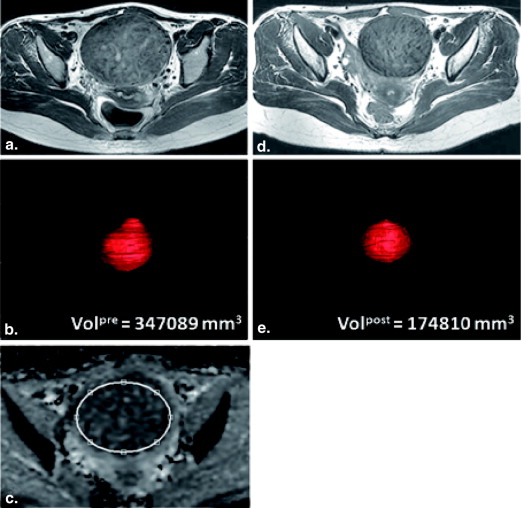
In this prospective study, 11 patients with uterine leiomyomas who underwent pelvic magnetic resonance imaging including diffusion-weighted imaging before and 6 months after UAE were included. A total number of 16 leiomyomas larger than 2 cm in diameter were evaluated. The volume of each leiomyoma before and after UAE was determined, and the percentage change in volume was calculated. Entropy of T2-weighted imaging and ADC before UAE were assessed. Pearson correction coefficients were calculated between leiomyoma VR after UAE and age, leiomyoma volume, ADC, and entropy, respectively. Multiple regression analysis was performed to investigate the parameters that determine the VR after UAE. Receiver operating characteristic curve analysis was used to determine the sensitivity and specificity of ADC, entropy and the combination of ADC and entropy for predicting volume response.
Results
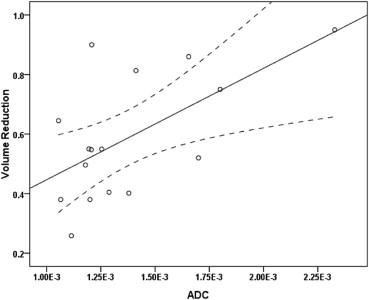
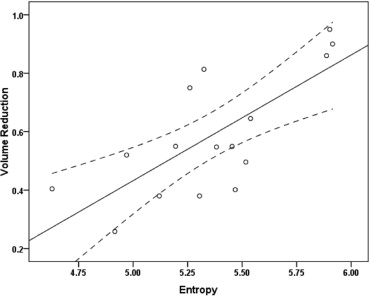
The mean leiomyoma VR was 58.9% (range 25.8%–95.0%) in the 6-month follow-up. The mean ADC of leiomyomas was 1.37 × 10 −3 mm 2 /s (range 1.05 × 10 −3 –2.32 × 10 −3 mm 2 /s) and the mean entropy of T2-weighted imaging was 5.36 (range 4.62–5.91) before UAE. ADC and entropy were significantly correlated with leiomyoma VR, respectively ( r = 0.61, P = .012; r = 0.73, P = .001). On multiple regression analysis, a combination of ADC and entropy constituted the best model for determining leiomyoma VR using Akaike information criterion. For predicting ≥50% VR, the optimal cutoff value of ADC was 1.39 × 10 −3 mm 2 /s (sensitivity 45.5%, specificity 80.0%) and the optimal cutoff value of entropy was 5.15 (sensitivity 90.9%, specificity 60.0%). The combination of ADC and entropy (area under the curve [AUC] 0.86) provided better classification accuracy than ADC or entropy alone (AUC 0.69 and 0.82, respectively).
Conclusions
Pre-UAE entropy of T2-weighted imaging and ADC of leiomyomas were significantly correlated with the leiomyoma VR 6 months after embolization. Higher entropy and higher ADC may be related to greater leiomyoma VR after UAE. A combination of entropy and ADC may have predictive value for leiomyoma VR after UAE.
Leiomyomas are the most common gynecologic neoplasm, with an incidence of 20%–30% in women of reproductive age, which can cause menorrhagia, urinary frequency, constipation, or can negatively impact fertility . In recent years, uterine artery embolization (UAE) has become an alternative option for symptomatic leiomyomas offering minimal invasiveness compared to hysterectomy and myomectomy . UAE has also proven to be effective in improvement of bulk-related symptoms in 90%–96% of cases and a volume reduction of 40%–70% in the dominant leiomyomas . As for the relationship between clinical success and the degree of leiomyoma volume reduction (VR) after embolization, Toor et al. showed that VR after UAE was lesser in patients with poor clinical improvement.
Although ultrasonography is the preferred initial imaging technique to diagnose leiomyomas, magnetic resonance imaging (MRI) is more accurate in detection and localization of leiomyomas and discrimination from their mimics, such as adenomyosis or solid adnexal masses . Therefore, MRI is often performed before embolization to assess leiomyomas, their vascular supply, and their potential procedural risk . MRI assessment mainly includes a series of imaging sequences, such as T1-weighted, T2-weighted, and postcontrast enhancement. MRI appearances give information about the signal intensity (SI), homogeneity, and composition of leiomyomas, which is helpful to recognize nondegenerated and degenerated leiomyomas.
Get Radiology Tree app to read full this article<
Table 1
Literature Review of Published T2-weighted SI, T1-weighted SI, Degree of Contrast Enhancement, Size and ADC before UAE for Prediction of Leiomyoma Volume Reduction after UAE
Author, year Magnetic Field Strength Time after UAE T2-weighted SI T1-weighted SI Degree of Contrast Enhancement Size ADC Burn et al., 2000 1.0 T 2 and 6 months Yes Yes No No deSouza et al., 2002 0.5 T 4 months Yes No Watson et al., 2002 1.0 T 6 months Yes No Harman et al., 2006 0.3 T 6 months Yes Yes Yes Yes Jain et al., 2007 1.5 T 3 months No Hect et al., 2011 1.5 T 152–316 days No No No Yes Lee et al., 2013 3.0 T 3 months Yes
ADC, apparent diffusion coefficient; SI, signal intensity; UAE, uterine artery embolization.
A ‘yes’ means the parameter had predictive value and ‘no’ means the parameter had no predictive value. Blank item means that the parameter was not assessed in the literature.
Get Radiology Tree app to read full this article<
Get Radiology Tree app to read full this article<
Get Radiology Tree app to read full this article<
Get Radiology Tree app to read full this article<
Materials and methods
Study Population
Get Radiology Tree app to read full this article<
MRI Procedure
Get Radiology Tree app to read full this article<
Get Radiology Tree app to read full this article<
Image Analysis
Get Radiology Tree app to read full this article<
VR=(Volpre−Volpost)/Volpre×100% VR
=
(
Vol
pre
−
Vol
post
)
/
Vol
pre
×
100
%
Get Radiology Tree app to read full this article<
Get Radiology Tree app to read full this article<
ADC=−ln(Sb/S0)/b ADC
=
−
ln
(
Sb
/
S0
)
/
b
where b is the diffusion-sensitizing factor (b-value) and Sb and S0 represent the signal intensity at a nonzero b-value and zero b-value, respectively.
Get Radiology Tree app to read full this article<
Get Radiology Tree app to read full this article<
Entropy=∑(−pi)(log(pi)) Entropy
=
∑
(
−
p
i
)
(
log
(
p
i
)
)
where pi represents the probability of certain signal intensity i in the image and is calculated by dividing the pixel number of each signal intensity by the total pixel number.
Get Radiology Tree app to read full this article<
Get Radiology Tree app to read full this article<
UAE Technique
Get Radiology Tree app to read full this article<
Statistical Analysis
Get Radiology Tree app to read full this article<
Get Radiology Tree app to read full this article<
Results
Get Radiology Tree app to read full this article<
Get Radiology Tree app to read full this article<
Get Radiology Tree app to read full this article<
Get Radiology Tree app to read full this article<
Get Radiology Tree app to read full this article<
Get Radiology Tree app to read full this article<
VR=0.355×entropy+0.258×ADC−1.670 VR
=
0.355
×
entropy
+
0.258
×
ADC
−
1.670
Table 2
Multiple Regression Models Predicting Leiomyoma VR after Embolization Using the Backward Stepwise Method
Parameters Leiomyoma VR Prediction Full Model Intermediate Model Reduced Model_P_ Value_P_ Value_P_ Value Age .57 Leiomyoma volume .10 .10 ADC .086 .065 .019 Entropy .002 .001 .003
ADC, apparent diffusion coefficient; VR, volume reduction.
Get Radiology Tree app to read full this article<
Get Radiology Tree app to read full this article<
Get Radiology Tree app to read full this article<
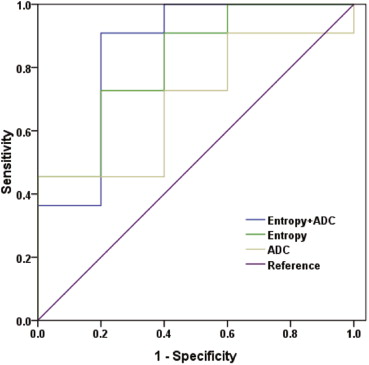
Table 3
Receiver Operating Characteristic (ROC) Analyses for Predicting Volume Reduction of ≥50% Based on Leiomyoma ADC, Entropy of T2-weighted Imaging, and the Combination of ADC and Entropy, Respectively
Cutoff Value AUC Sensitivity % Specificity % ADC 1.39 × 10 −3 mm 2 /s 0.69 45.5 80.0 Entropy 5.15 0.82 90.9 60.0 [ADC, Entropy] [1.07 × 10 −3 mm 2 /s, 5.30] 0.86 90.9 80.0
ADC, apparent diffusion coefficient; AUC, area under the ROC curve.
Get Radiology Tree app to read full this article<
Discussion
Get Radiology Tree app to read full this article<
Get Radiology Tree app to read full this article<
Get Radiology Tree app to read full this article<
Get Radiology Tree app to read full this article<
Get Radiology Tree app to read full this article<
Get Radiology Tree app to read full this article<
Conclusions
Get Radiology Tree app to read full this article<
Get Radiology Tree app to read full this article<
Get Radiology Tree app to read full this article<
References
1. Deshmukh S.P., Gonsalves C.F., Guglielmo F.F., et. al.: Role of MR imaging of uterine leiomyomas before and after embolization. Radiographics 2012; 32: pp. E251-E281.
2. Ravina J., Ciraru-Vigneron N., Bouret J., et. al.: Arterial embolisation to treat uterine myomata. Lancet 1995; 346: pp. 671-672.
3. Goodwin S.C., Vedantham S., McLucas B., et. al.: Preliminary experience with uterine artery embolization for uterine fibroids. J Vasc Interv Radiol 1997; 8: pp. 517-526.
4. Worthington-Kirsch R.L., Popky G.L., Hutchins F.L.: Uterine arterial embolization for the management of leiomyomas: quality-of-life assessment and clinical response. Radiology 1998; 208: pp. 625-629.
5. Spies J.B., Scialli A.R., Jha R.C., et. al.: Initial results from uterine fibroid embolization for symptomatic leiomyomata. J Vasc Interv Radiol 1999; 10: pp. 1149-1157.
6. Spies J.B., Ascher S.A., Roth A.R., et. al.: Uterine artery embolization for leiomyomata. Obstet Gynecol 2001; 98: pp. 29-34.
7. Toor S.S., Tan K.T., Simons M.E., et. al.: Clinical failure after uterine artery embolization: evaluation of patient and MR imaging characteristics. J Vasc Interv Radiol 2008; 19: pp. 662-667.
8. Nikolaidis P., Siddiqi A.J., Carr J.C., et. al.: Incidence of nonviable leiomyomas on contrast material—enhanced pelvic MR imaging in patients referred for uterine artery embolization. J Vasc Interv Radiol 2005; 16: pp. 1465-1471.
9. Katsumori T., Akazawa K., Mihara T.: Uterine artery embolization for pedunculated subserosal fibroids. AJR Am J Roentgenol 2005; 184: pp. 399-402.
10. Hecht E.M., Do R.K., Kang S.K., et. al.: Diffusion-weighted imaging for prediction of volumetric response of leiomyomas following uterine artery embolization: a preliminary study. J Magn Reson Imaging 2011; 33: pp. 641-646.
11. Burn P.R., McCall J.M., Chinn R.J., et. al.: Uterine fibroleiomyoma: MR imaging appearances before and after embolization of uterine arteries. Radiology 2000; 214: pp. 729-734.
12. deSouza N., Williams A.: Uterine arterial embolization for leiomyomas: perfusion and volume changes at MR imaging and relation to clinical outcome. Radiology 2002; 222: pp. 367.
13. Watson G., Walker W.: Uterine artery embolisation for the treatment of symptomatic fibroids in 114 women: reduction in size of the fibroids and women’s views of the success of the treatment. BJOG 2002; 109: pp. 129-135.
14. Harman M., Zeteroglu S., Arslan H., et. al.: Predictive value of magnetic resonance imaging signal and contrast-enhancement characteristics on post-embolization volume reduction of uterine fibroids. Acta Radiol 2006; 47: pp. 427-435.
15. Jain T., Srivastava D., Sahu R., et. al.: Uterine artery embolization for symptomatic fibroids with imaging follow up. Australas Radiol 2007; 51: pp. 246-252.
16. Lee M.S., Kim M.D., Chung D.C., et. al.: Apparent diffusion coefficient of uterine leiomyoma as a predictor of the potential response to uterine artery embolization. J Vasc Interv Radiol 2013; 24: pp. 1361-1365.
17. Szafer A., Zhong J., Gore J.C.: Theoretical model for water diffusion in tissues. Magn Reson Med 1995; 33: pp. 697-712.
18. Shannon C.E.: A mathematical theory of communication. ACM SIGMOBILE Mobile Computing and Communications Review 2001; 5: pp. 3-55.
19. Tavazzi E., Dwyer M.G., Weinstock-Guttman B., et. al.: Quantitative diffusion weighted imaging measures in patients with multiple sclerosis. Neuroimage 2007; 36: pp. 746-754.
20. Cui J.-L., Wen C.-Y., Hu Y., et. al.: Entropy-based analysis for diffusion anisotropy mapping of healthy and myelopathic spinal cord. Neuroimage 2011; 54: pp. 2125-2131.
21. Hshiao M.-H., Chen P.-C., Jao J.-C., et. al.: Quantifying liver cirrhosis by extracting significant features from MRI T2 image. The Scientific World Journal 2012; 2012: pp. 343847.
22. Fujimoto K., Tonan T., Azuma S., et. al.: Evaluation of the mean and entropy of apparent diffusion coefficient values in chronic hepatitis C: correlation with pathologic fibrosis stage and inflammatory activity grade. Radiology 2011; 258: pp. 739-748.
23. Kierans A.S., Bennett G.L., Mussi T.C., et. al.: Characterization of malignancy of adnexal lesions using ADC entropy: comparison with mean ADC and qualitative DWI assessment. J Magn Reson Imaging 2013; 37: pp. 164-171.
24. Joe B.N., Suh J., Hildebolt C.F., et. al.: MR volumetric measurements of the myomatous uterus: improved reliability of stereology over linear measurements. Acad Radiol 2007; 14: pp. 455-462.
25. Yushkevich P.A., Piven J., Hazlett H.C., et. al.: User-guided 3D active contour segmentation of anatomical structures: significantly improved efficiency and reliability. Neuroimage 2006; 31: pp. 1116-1128.
26. Davnall F., Yip C.S., Ljungqvist G., et. al.: Assessment of tumor heterogeneity: an emerging imaging tool for clinical practice?. Insights into imaging 2012; 3: pp. 573-589.
27. Akaike H.: A new look at the statistical model identification. Automatic Control, IEEE Transactions on 1974; 19: pp. 716-723.
28. Lupattelli T., Basile A., Garaci F.G., et. al.: Percutaneous uterine artery embolization for the treatment of symptomatic fibroids: current status. Eur J Radiol 2005; 54: pp. 136-147.
29. Hald K., Noreng H.J., Istre O., et. al.: Uterine artery embolization versus laparoscopic occlusion of uterine arteries for leiomyomas: long-term results of a randomized comparative trial. J Vasc Interv Radiol 2009; 20: pp. 1303-1310.
30. Faye N., Pellerin O., Thiam R., et. al.: Diffusion-weighted imaging for evaluation of uterine arterial embolization of fibroids. Magn Reson Med 2013; 70: pp. 1739-1747.
31. Yamashita Y., Torashima M., Takahashi M., et. al.: Hyperintense uterine leiomyoma at T2-weighted MR imaging: differentiation with dynamic enhanced MR imaging and clinical implications. Radiology 1993; 189: pp. 721-725.
32. Kirby J.M., Burrows D., Haider E., et. al.: Utility of MRI before and after uterine fibroid embolization: why to do it and what to look for. Cardiovasc Intervent Radiol 2011; 34: pp. 705-716.
33. Dong S., Ye X.-D., Yuan Z., et. al.: Relationship of apparent diffusion coefficient to survival for patients with unresectable primary hepatocellular carcinoma after chemoembolization. Eur J Radiol 2012; 81: pp. 472-477.
34. Szurowska E., Nowicki T.K., Izycka-Swieszewska E., et. al.: Predictive value of apparent diffusion coefficient in evaluation of colorectal carcinoma hepatic metastases’ response to radiofrequency ablation. J Magn Reson Imaging 2013; 38: pp. 1027-1032.
35. Lemke A., Laun F.B., Klau M., et. al.: Differentiation of pancreas carcinoma from healthy pancreatic tissue using multiple b-values: comparison of apparent diffusion coefficient and intravoxel incoherent motion derived parameters. Invest Radiol 2009; 44: pp. 769-775.
36. Hutchins F.L., Worthington-Kirsch R., Berkowitz R.P.: Selective uterine artery embolization as primary treatment for symptomatic leiomyomata uteri. J Am Assoc Gynecol Laparo 1999; 6: pp. 279-284.