
Rationale and Objectives
Little is known about the frequency and risk factors of hepatic steatosis in the tertiary care setting. Such knowledge is essential to clinicians making decisions about testing for this condition. Thus, our aim was to describe the epidemiology of hepatic steatosis, as captured by magnetic resonance imaging (MRI), at a tertiary care center.
Materials and Methods
A near-consecutive cohort of 1006 adult patients underwent standard-of-care liver MRIs. Images were retrospectively processed to derive proton density fat fraction (PDFF) maps. Data from three spatially distinct regions of interest (ROIs) were aggregated to derive overall hepatic PDFF values. Demographic, anthropometric, clinical, and laboratory variables were included in a multivariate analysis to determine predictors of hepatic steatosis grades (based on established PDFF cutoffs). Hepatic steatosis grades derived from single vs aggregated ROIs were compared.
Results
Hepatic steatosis was observed in 25% of patients (19% grade 1; 3% grade 2; 3% grade 3). Controlling for all other variables, the odds of hepatic steatosis increased by 7%–9% ( P < .001) for each whole point increase in body mass index (BMI), whereas elevated serum bilirubin was associated with lower odds of hepatic steatosis ( P = .002). Race, diabetes mellitus, dyslipidemia, and metabolic syndrome were not independently predictive of hepatic steatosis when controlling for other variables (eg, BMI). Employing single ROIs (rather than three aggregated ROIs) resulted in incorrect steatosis grading in up to 8.0% of patients.
Conclusion
Many adult patients undergoing liver MRI at a tertiary care center have hepatic steatosis, with larger BMIs as the only independent predictor of higher grades. This information can be used by clinicians at such centers to make evidence-based decisions about when to test for hepatic steatosis in their patients.
Introduction
Hepatic steatosis, the abnormal accumulation of lipids within hepatocytes, is a common condition affecting roughly 20%–30% of the population in Western countries . Etiologies of hepatic steatosis have typically been partitioned into nonalcoholic fatty liver disease (NAFLD) and alcoholic fatty liver disease. Importantly, the prevalence of NAFLD, which has been linked to nonalcoholic steatohepatitis and cirrhosis, has risen sharply in recent decades, in tandem with the obesity epidemic . Even in the absence of cirrhosis, hepatic steatosis is a risk factor for the development of hepatocellular carcinoma and is associated with insulin resistance and cardiovascular disease .
The detection of hepatic steatosis is important in guiding clinical management. The current gold standard for diagnosing and grading hepatic steatosis is nontargeted percutaneous biopsy with direct histologic visualization . Although generally safe, percutaneous liver biopsy is an invasive procedure with non-negligible risks of hospitalization (3%) and death (0.01%), with even higher risks of complications in patients with advanced liver disease . Moreover, fat deposition within the hepatic parenchyma can exhibit significant spatial heterogeneity, potentially resulting in undergrading or overgrading due to sampling error . Consequently, there is a need for safe and accurate methods of globally interrogating hepatic fat levels. With the advent of multiecho chemical shift-encoded sequences, magnetic resonance imaging (MRI) has emerged as a reliable, noninvasive means of liver fat quantification .
Get Radiology Tree app to read full this article<
Materials and Methods
Patient Identification
Get Radiology Tree app to read full this article<
Get Radiology Tree app to read full this article<
Get Radiology Tree app to read full this article<
Get Radiology Tree app to read full this article<
Get Radiology Tree app to read full this article<
Get Radiology Tree app to read full this article<
Get Radiology Tree app to read full this article<
Image Acquisition
Get Radiology Tree app to read full this article<
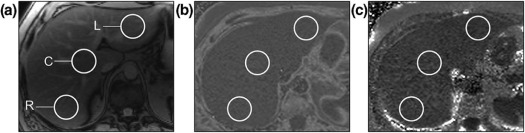
Region of Interest Selection
Get Radiology Tree app to read full this article<
Get Radiology Tree app to read full this article<
Liver Fat Quantification, Histologic Grade Estimation, and Heterogeneity Assessment
Get Radiology Tree app to read full this article<
Get Radiology Tree app to read full this article<
Get Radiology Tree app to read full this article<
Liver Iron Quantification and Histologic Grade Estimation
Get Radiology Tree app to read full this article<
Get Radiology Tree app to read full this article<
Get Radiology Tree app to read full this article<
Statistical Analysis
Get Radiology Tree app to read full this article<
Get Radiology Tree app to read full this article<
Get Radiology Tree app to read full this article<
Get Radiology Tree app to read full this article<
Get Radiology Tree app to read full this article<
Get Radiology Tree app to read full this article<
Get Radiology Tree app to read full this article<
Get Radiology Tree app to read full this article<
Get Radiology Tree app to read full this article<
Results
Patient Population
Get Radiology Tree app to read full this article<
TABLE 1
Patient Characteristics
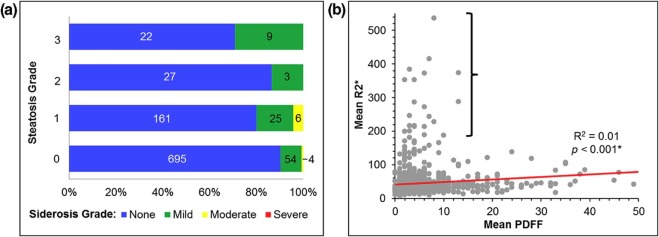
Liver Fat and Iron Levels Hepatic steatosis Grade 0 (mean PDFF of <5.5%) 75% ( n = 753) Grade 1 (mean PDFF of 5.5–16.2%) 19% ( n = 192) Grade 2 (mean PDFF of 16.3–21.6%) 3% ( n = 30) Grade 3 (mean PDFF of 21.7% or greater) 3% ( n = 31) Hepatic siderosis None (mean LIC of <2.0 mg/g) 90% ( n = 905) Mild (mean LIC of 2.0–7.9 mg/g) 9% ( n = 91) Moderate (mean LIC of 8.0–15.0 mg/g) 1% ( n = 10) Severe (mean LIC of >15.0 mg/g) 0% ( n = 0)
Demographic Parameters Age (mean ± SEM, y) 57.1 ± 0.4 ( n = 1006) Gender Male 54% ( n = 543) Female 46% ( n = 463) Race White 81% ( n = 813) Black 16% ( n = 160) Asian 1% ( n = 15) Other 2% ( n = 18)
Risk Factors (RFs) RF-None subgroup None of risk factors below 23% ( n = 230) Any of risk factors below 77% ( n = 776)
NAFLD-related RFs BMI (mean ± SEM, kg/m 2 ) 28.7 ± 0.2 ( n = 1006) DM Yes 24% ( n = 238) No 76% ( n = 768) Dyslipidemia Yes 20% ( n = 197) No 80% ( n = 809) Metabolic syndrome Yes 4% ( n = 38) No 96% ( n = 968) RF-NAFLD subgroup Any NAFLD-related RFs 42% ( n = 427) No NAFLD-related RFs 58% ( n = 579)
CLD-related RFs Alcohol abuse within 12 mo Yes 31% ( n = 310) No 69% ( n = 696) Active HCV infection Yes 19% ( n = 196) No 81% ( n = 810) Active HBV infection Yes 2% ( n = 21) No 98% ( n = 985) RF-CLD subgroup Any CLD-related RFs 46% ( n = 461) No CLD-related RFs 54% ( n = 545)
Cancer-related RFs Liver metastases Yes 8% ( n = 85) No 92% ( n = 921) Chemotherapy within 6 mo Yes 16% ( n = 162) No 84% ( n = 844) RF-CA subgroup Any cancer-related RFs 21% ( n = 214) No cancer related RFs 79% ( n = 792)
Laboratory Values ALP Normal 56% ( n = 563) Abnormal 44% ( n = 443) tBILI Normal 52% ( n = 519) Abnormal 48% ( n = 487) AST Normal 50% ( n = 498) Abnormal 50% ( n = 508) ALT Normal 59% ( n = 590) Abnormal 41% ( n = 416) Abnormal laboratories Any 75% ( n = 751) None 25% ( n = 255)
ALP, alkaline phosphatase; ALT, alanine aminotransferase; AST, aspartate aminotransferase; tBILI, total bilirubin; BMI, body mass index; DM, diabetes mellitus; HBV, hepatitis B virus; HCV, hepatitis C virus; LIC, liver iron concentration; PDFF, proton density fat fraction; RF-CA subgroup, patients with known cancer; RF-CLD subgroup, patients with risk factors for chronic liver disease; RF-NAFLD subgroup, patients with risk factors for non-alcoholic fatty liver disease; RF-None subgroup, patients without any identifiable risk factors; SEM, standard error of the mean.
Get Radiology Tree app to read full this article<
Get Radiology Tree app to read full this article<
TABLE 2
Liver Imaging Indications as Provided by Ordering Physician
Indication Frequency Hepatic metastatic disease 28% ( n = 281) Viral hepatitis ± cirrhosis 24% ( n = 239) Primary liver malignancy (HCC, ICC, H-ChC, etc.) 12% ( n = 119) Other indication 8% ( n = 82) Indeterminate liver mass 6% ( n = 60) Elevated liver enzymes 5% ( n = 47) PSC and/or IBD 4% ( n = 43) Abdominal pain 3.5% ( n = 36) Alcoholic liver disease, including alcoholic cirrhosis 3.5% ( n = 36) Pancreatitis 3% ( n = 28) NAFLD, NASH ± cirrhosis 2% ( n = 23) Iron deposition (known or suspected) 1% ( n = 12)
HCC, hepatocellular carcinoma; H-ChC, hepato-cholangiocarcinoma; IBD, inflammatory bowel disease; ICC, intrahepatic cholangiocarcinoma; NAFLD, nonalcoholic fatty liver disease; NASH, nonalcoholic steatohepatitis; PSC, primary sclerosing cholangitis.
Get Radiology Tree app to read full this article<
Predictors of Hepatic Steatosis
Get Radiology Tree app to read full this article<
TABLE 3
Results of Analysis of Various Demographic, Clinical, and Laboratory Parameters as Individual Predictors of Hepatic Steatosis Grades
Hepatic Steatosis Grades_P_ Values for Prediction of Hepatic Steatosis Grades 0
( n = 753) 1
( n = 192) 2
( n = 30) 3
( n = 31)Demographic parameters Age (mean ± SEM, y) 57.1 ± 0.5 57.5 ± 0.9 55.5 ± 2.1 55.8 ± 2.0 .83 Gender, n (%) .12 Male 416 (55.3) 93 (48.4) 20 (66.7) 14 (45.2) Female 337 (44.8) 99 (51.6) 10 (33.3) 17 (54.8) Race, n (%) .97 White 606 (80.5) 156 (81.3) 26 (86.7) 25 (80.7) Black 120 (15.9) 31 (16.2) 4 (13.3) 5 (16.1) Asian 12 (1.6) 2 (1.0) 0 (0.0) 1 (3.2) Other 15 (2.0) 3 (1.5) 0 (0.0) 0 (0.0) Risk factors (RFs) RF-None subgroup, n (%) .02 None of risk factors below 188 (25.0) 36 (18.7) 3 (10.0) 3 (9.7) Any of risk factors below 565 (75.0) 156 (81.3) 27 (90.0) 28 (90.3)NAFLD-related RFs BMI (mean ± SEM, kg/m 2 ) 27.8 ± 0.2 31.0 ± 0.5 32.1 ± 1.6 32.5 ± 1.8 <.001 \* (larger BMI ➔ higher grades) DM, n (%) Yes 157 (20.8) 58 (30.2) 13 (43.3) 10 (32.2) .001 \* (DM ➔ higher grades) No 596 (79.2) 134 (69.8) 17 (56.7) 21 (77.8) Dyslipidemia, n (%) Yes 129 (17.1) 45 (23.4) 12 (40.0) 11 (35.5) <.001 \* (dyslipidemia ➔ higher grades) No 624 (82.9) 147 (76.6) 18 (60.0) 20 (64.5) Metabolic syndrome, n (%) Yes 19 (2.5) 9 (4.7) 6 (20.0) 4 (12.9) <.001 \* (metabolic syndrome ➔ higher grades) No 734 (97.5) 183 (95.3) 24 (80.0) 27 (87.1) RF-NAFLD subgroup, n (%) Any NAFLD-related RFs 291 (38.7) 99 (51.6) 19 (63.3) 18 (58.1) <.001 \* (any NAFLD-related RFs ➔ higher grades) No NAFLD-related RFs 462 (61.3) 93 (48.4) 11 (36.7) 13 (41.9)CLD-related RFs Alcohol abuse within previous 12 mo, n (%) Yes 221 (29.3) 65 (33.9) 14 (46.7) 10 (32.2) .18 No 532 (70.7) 127 (66.1) 16 (53.3) 21 (77.8) Active HCV infection, n (%) Yes 161 (21.4) 30 (15.6) 1 (3.3) 4 (12.9) .02 No 592 (78.6) 162 (84.4) 29 (96.7) 27 (87.1) Active HBV infection, n (%) Yes 16 (2.1) 4 (2.1) 1 (3.3) 0 (0.0) .68 No 737 (97.9) 188 (97.9) 29 (96.7) 31 (100.0) RF-CLD subgroup, n (%) Any CLD-related RFs 348 (46.2) 86 (44.8) 15 (50.0) 12 (38.7) .81 No CLD-related RFs 405 (53.8) 106 (55.2) 15 (50.0) 19 (61.3)Cancer-related RFs Liver metastases, n (%) Yes 60 (8.0) 14 (7.3) 5 (16.7) 6 (19.4) .09 No 693 (92.0) 178 (92.7) 25 (83.3) 25 (80.6) Chemotherapy within previous 6 mo, n (%) Yes 120 (15.9) 33 (17.2) 5 (16.7) 4 (12.9) .93 No 633 (84.1) 159 (82.8) 25 (83.3) 27 (87.1) RF-CA subgroup, n (%) Any cancer-related RFs 156 (20.7) 41 (21.4) 8 (26.7) 9 (29.0) .64 No cancer related RFs 597 (79.3) 151 (78.6) 22 (73.3) 22 (71.0)Laboratory values ALP, n (%) Normal 395 (52.5) 125 (65.1) 19 (63.3) 24 (77.4) <.001 \* (elevated ALP ➔ lower grades) Abnormal 358 (47.5) 67 (34.9) 11 (36.7) 7 (22.6) tBILI, n (%) Normal 358 (47.5) 127 (66.2) 15 (50.0) 19 (61.3) <.001 \* (elevated tBILI ➔ lower grades) Abnormal 395 (52.5) 65 (33.8) 15 (50.0) 12 (38.7) AST, n (%) Normal 363 (48.2) 103 (53.7) 16 (53.3) 16 (51.6) .56 Abnormal 390 (51.8) 89 (46.4) 14 (46.7) 15 (48.4) ALT, n (%) Normal 436 (57.9) 121 (63.0) 16 (53.3) 17 (54.8) .53 Abnormal 317 (42.1) 71 (37.0) 14 (46.7) 14 (45.2)
ALP, alkaline phosphatase; ALT, alanine aminotransferase; AST, aspartate aminotransferase; BMI, body mass index; DM, diabetes mellitus; HBV, hepatitis B virus; HCV, hepatitis C virus; RF-CA subgroup, patients with known cancer; RF-CLD subgroup, patients with risk factors for chronic liver disease; RF-NAFLD subgroup, patients with risk factors for nonalcoholic fatty liver disease; RF-None subgroup, patients without any identifiable risk factors; SEM, standard error of the mean; tBILI, total bilirubin.
Get Radiology Tree app to read full this article<
Get Radiology Tree app to read full this article<
Get Radiology Tree app to read full this article<
TABLE 4
Results of Multinomial Logistic Regression Analysis of Various Demographic, Clinical, and Laboratory Parameters as Predictors of Hepatic Steatosis Grades
Grade 1 † Grade 2 † Grade 3 † L-R χ 2 P Value for Prediction of HFD Grades OR (95% CI) OR (95% CI) OR (95% CI) Demographic parameters Age (continuous) 1.00 (0.99–1.02) 0.98 (0.96–1.01) 0.99 (0.96–1.02) 1.56 .67 Gender (Ref = Female) Male 0.90 (0.76–1.06) 1.35 (0.89–2.06) 0.86 (0.58–1.28) 4.56 .21 Race (Ref = White) Black 1.06 (0.58–1.93) us us 3.88 .92 Asian 0.88 (0.26–2.94) us us Other 1.09 (0.64–1.85) us us Risk factors (RFs) RF-None subgroup (Ref = None) 3.60 .31 Any of risk factors below 1.10 (0.82–1.48) 1.09 (0.49–2.42) 2.41 (0.80–7.27) NAFLD-related RFs BMI (continuous) 1.08 (1.05–1.11) 1.07 (1.00–1.14) 1.09 (1.03–1.16) 33.38 <.001 \* DM (Ref = No) Yes 1.29 (1.00–1.66) 1.54 (0.90–2.65) 1.22 (0.72–2.06) 5.96 .11 Dyslipidemia (Ref = No) Yes 1.20 (0.93–1.56) 1.48 (0.85–2.58) 1.61 (0.93–2.79) 5.55 .14 Metabolic syndrome (Ref = No) Yes 0.90 (0.56–1.43) 1.82 (0.94–3.53) 1.34 (0.66–2.74) 4.25 .24 RF-NAFLD subgroup (Ref = None) Any NAFLD-related RFs 0.78 (0.57–1.08) 0.79 (0.39–1.62) 0.69 (0.36–1.33) 3.30 .35 CLD-related RFs Alcohol abuse within previous 12 mo (Ref = No) Yes 1.14 (0.93–1.40) 1.43 (0.92–2.22) 1.07 (0.69–1.66) 3.58 .31 Active HCV infection (Ref = No) Yes 0.85 (0.66–1.08) 0.41 (0.15–1.14) 0.84 (0.47–1.50) 6.39 .09 Cancer-related RFs Liver metastases (Ref = No) Yes 0.89 (0.64–1.23) 1.64 (0.94–2.86) 1.62 (0.95–2.76) 6.49 .09 Laboratory values ALP (Ref = Normal) Abnormal 0.87 (0.73–1.04) 0.76 (0.50–1.16) 0.62 (0.40–0.98) 7.29 .06 tBILI (Ref = Normal) Abnormal 0.71 (0.59–0.85) 1.06 (0.70–1.59) 0.89 (0.59–1.34) 5.15 .002 \*
ALP, alkaline phosphatase; BMI, body mass index; CI, confidence interval; DM, diabetes mellitus; HCV, hepatitis C virus; L-R χ 2 , likelihood ratio chi-squared; OR, odds ratio; Ref, reference category; RF-NAFLD subgroup, patients with risk factors for nonalcoholic fatty liver disease; RF-None subgroup, patients without any identifiable risk factors; tBILI, total bilirubin.
Get Radiology Tree app to read full this article<
Get Radiology Tree app to read full this article<
Get Radiology Tree app to read full this article<
Association Between Hepatic Steatosis and Hepatic Siderosis
Get Radiology Tree app to read full this article<
Get Radiology Tree app to read full this article<
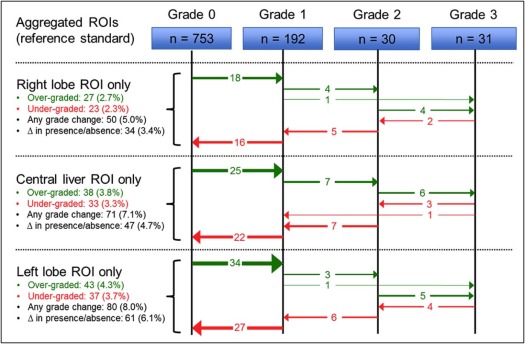
Spatial Heterogeneity of Hepatic Steatosis
Get Radiology Tree app to read full this article<
Get Radiology Tree app to read full this article<
Get Radiology Tree app to read full this article<
Discussion
Get Radiology Tree app to read full this article<
Get Radiology Tree app to read full this article<
Get Radiology Tree app to read full this article<
Get Radiology Tree app to read full this article<
Get Radiology Tree app to read full this article<
Get Radiology Tree app to read full this article<
Get Radiology Tree app to read full this article<
Get Radiology Tree app to read full this article<
Supplementary Data
Get Radiology Tree app to read full this article<
Table S1
Get Radiology Tree app to read full this article<
Get Radiology Tree app to read full this article<
References
1. Scaglioni F., Ciccia S., Marino M., et. al.: ASH and NASH. Dig Dis 2011; 29: pp. 202-210.
2. Lazo M., Clark J.M.: The epidemiology of nonalcoholic fatty liver disease: a global perspective. Semin Liver Dis 2008; 28: pp. 339-350.
3. Guzman G., Brunt E.M., Petrovic L.M., et. al.: Does nonalcoholic fatty liver disease predispose patients to hepatocellular carcinoma in the absence of cirrhosis?. Arch Pathol Lab Med 2008; 132: pp. 1761-1766.
4. Adams L.A., Waters O.R., Knuiman M.W., et. al.: NAFLD as a risk factor for the development of diabetes and the metabolic syndrome: an eleven-year follow-up study. Am J Gastroenterol 2009; 104: pp. 861-867.
5. Schindhelm R.K., Diamant M., Heine R.J.: Nonalcoholic fatty liver disease and cardiovascular disease risk. Curr Diab Rep 2007; 7: pp. 181-187.
6. Brunt E.M., Janney C.G., Di Bisceglie A.M., et. al.: Nonalcoholic steatohepatitis: a proposal for grading and staging the histological lesions. Am J Gastroenterol 1999; 94: pp. 2467-2474.
7. Rowe J.W., Wands J.R., Mezey E., et. al.: Familial hemochromatosis: characteristics of the precirrhotic stage in a large kindred. Medicine (Baltimore) 1977; 56: pp. 197-211.
8. Bravo A.A., Sheth S.G., Chopra S.: Liver biopsy. N Engl J Med 2001; 344: pp. 495-500.
9. Ratziu V., Charlotte F., Heurtier A., et. al.: Sampling variability of liver biopsy in nonalcoholic fatty liver disease. Gastroenterology 2005; 128: pp. 1898-1906.
10. Wood J.C., Zhang P., Rienhoff H., et. al.: Liver MRI is more precise than liver biopsy for assessing total body iron balance: a comparison of MRI relaxometry with simulated liver biopsy results. Magn Reson Imaging 2014; 33: pp. 761-767.
11. Reeder S.B., Sirlin C.B.: Quantification of liver fat with magnetic resonance imaging. Magn Reson Imaging Clin N Am 2010; 18: pp. 337-357.
12. Sirlin C.B., Reeder S.B.: Magnetic resonance imaging quantification of liver iron. Magn Reson Imaging Clin N Am 2010; 18: pp. 359-381.
13. Yokoo T., Bydder M., Hamilton G., et. al.: Nonalcoholic fatty liver disease: diagnostic and Fat-grading accuracy of low-flip-angle multiecho gradient-recalled-echo MR imaging at 1.5 T. Radiology 2009; 251: pp. 67-76.
14. Pietrangelo A.: Iron and the liver. Liver Int 2016; pp. 116-123.
15. Bydder M., Yokoo T., Hamilton G., et. al.: Relaxation effects in the quantification of fat using gradient echo imaging. Magn Reson Imaging 2008; 26: pp. 347-359.
16. Meisamy S., Hines C.D.G., Hamilton G., et. al.: Quantification of hepatic steatosis with T1-independent, T2-corrected MR imaging with spectral modeling of fat: blinded comparison with MR spectroscopy. Radiology 2011; 258: pp. 767-775.
17. Kang G.H., Cruite I., Shiehmorteza M., et. al.: Reproducibility of MRI-determined proton density fat fraction across two different MR scanner platforms. J Magn Reson Imaging 2011; 34: pp. 928-934.
18. Szczepaniak L.S., Nurenberg P., Leonard D., et. al.: Magnetic resonance spectroscopy to measure hepatic triglyceride content: prevalence of hepatic steatosis in the general population. Am J Physiol Endocrinol Metab 2005; 288: pp. E462-E468.
19. St Pierre T.G., House M.J., Bangma S.J., et. al.: Stereological analysis of liver biopsy histology sections as a reference standard for validating non-invasive liver fat fraction measurements by MRI. PLoS ONE 2016; 11: e0160789
20. Storey P., Thompson A.A., Carqueville C.L., et. al.: R2* imaging of transfusional iron burden at 3T and comparison with 1.5T. J Magn Reson Imaging 2007; 25: pp. 540-547.
21. Wood J.C., Enriquez C., Ghugre N., et. al.: MRI R2 and R2* mapping accurately estimates hepatic iron concentration in transfusion-dependent thalassemia and sickle cell disease patients. Blood 2005; 106: pp. 1460-1465.
22. Gomori J.M., Horev G., Tamary H., et. al.: Hepatic iron overload: quantitative MR imaging. Radiology 1991; 179: pp. 367-369.
23. Alústiza J.M., Artetxe J., Castiella A., et. al.: MR quantification of hepatic iron concentration. Radiology 2004; 230: pp. 479-484.
24. Hochberg Y., Benjamini Y.: More powerful procedures for multiple significance testing. Stat Med 1990; 9: pp. 811-818.
25. Bedogni G., Miglioli L., Masutti F., et. al.: Prevalence of and risk factors for nonalcoholic fatty liver disease: the Dionysos nutrition and liver study. Hepatology 2005; 42: pp. 44-52.
26. Browning J.D., Szczepaniak L.S., Dobbins R., et. al.: Prevalence of hepatic steatosis in an urban population in the United States: impact of ethnicity. Hepatology 2004; 40: pp. 1387-1395.
27. Bambha K., Belt P., Abraham M., et. al.: Ethnicity and nonalcoholic fatty liver disease. Hepatology 2012; 55: pp. 769-780.
28. Fernandez F.G., Ritter J., Goodwin J.W., et. al.: Effect of steatohepatitis associated with irinotecan or oxaliplatin pretreatment on resectability of hepatic colorectal metastases. J Am Coll Surg 2005; 200: pp. 845-853.
29. Chang Y., Ryu S., Zhang Y., et. al.: A cohort study of serum bilirubin levels and incident non-alcoholic fatty liver disease in middle aged Korean workers. PLoS ONE 2012; 7: e37241
30. Tian J., Zhong R., Liu C., et. al.: Association between bilirubin and risk of non-alcoholic fatty liver disease based on a prospective cohort study. Sci Rep 2016; 6: pp. 31006.
31. Hinds T.D., Hosick P.A., Hankins M.W., et. al.: Mice with hyperbilirubinemia due to Gilbert’s syndrome polymorphism are resistant to hepatic steatosis by decreased serine 73 phosphorylation of PPARα. Am J Physiol Endocrinol Metab 2017; 312: pp. E244-E252.
32. Hopkins P.N., Wu L.L., Hunt S.C., et. al.: Higher serum bilirubin is associated with decreased risk for early familial coronary artery disease. Arterioscler Thromb Vasc Biol 1996; pp. 250-255.
33. Bonekamp S., Tang A., Mashhood A., et. al.: Spatial distribution of MRI-determined hepatic proton density fat fraction in adults with nonalcoholic fatty liver disease. J Magn Reson Imaging 2014; 39: pp. 1525-1532.
34. Bashir M.R., Zhong X., Nickel M.D., et. al.: Quantification of hepatic steatosis with a multistep adaptive fitting MRI approach: prospective validation against MR spectroscopy. AJR Am J Roentgenol 2015; 204: pp. 297-306.
35. Mamidipalli A., Hamilton G., Manning P., et. al.: Cross-sectional correlation between hepatic R2* and proton density fat fraction (PDFF) in children with hepatic steatosis. J Magn Reson Imaging 2017;
36. Nomura R., Ishizaki Y., Suzuki K., et. al.: Development of hepatic steatosis after pancreatoduodenectomy. Am J Roentgenol 2007; 189: pp. 1484-1488.