
Quantitative imaging is increasing in almost all fields of radiological science. Modern quantitative imaging biomarkers measure complex parameters including metabolism, tissue microenvironment, tissue chemical properties or physical properties. In this paper, we focus on measurement reliability assessment in quantitative imaging. We review essential concepts related to measurement such as measurement variability and measurement error. We also discuss reliability study methods for intraobserver and interobserver variability, and the applicable statistical tests including: intraclass correlation coefficient, Pearson correlation coefficient, and Bland-Altman graphs and limits of agreement, standard error of measurement, and coefficient of variation.
Introduction
Quantitative imaging technologies are increasingly used for the measurement of normal biological processes, pathologic processes, patient risk stratification, treatment response measurement in clinical care, and drug development . The goal of quantitative imaging is objective, accurate, and precise measurement of quantifiable features obtained from in vivo imaging studies, termed quantitative imaging biomarkers (QIBs). The simplest QIBs comprise measurement of the size of organs, vessels, or lesions. More complex QIBs measure parameters including metabolism, for example, the standardized uptake value in positron emission tomography imaging; tissue microenvironment, for example, diffusion or perfusion; tissue chemical properties, for example, spectroscopy; or physical properties, for example, tissue stiffness . QIBs are continuous variables, of which there are two subtypes: (1) ratio variables, such as shear wave velocity measured in meters per second (m/s) by shear wave sonoelastography methods for liver fibrosis assessment, or (2) interval variables, such as computed tomography (CT) densitometry measured in Hounsfield units for estimating emphysema severity. Ordinal variables are not QIBs. For example, the widely used Prostate Imaging Reporting and Data System (PI-RADS) classification system used for prostate magnetic resonance imaging assessment has five numbered categories: PI-RADS 1 (very low probability) to PI-RADS 5 (very high probability) of prostate cancer . Although these categories are numbered, the numbers denote order, rather than quantity, and therefore PI-RADS is not a QIB.
To be clinically useful, QIBs must be reliably comparable to one another and to known reference measurements . The goal of this paper is to facilitate better understanding of QIB reliability measurement by imaging researchers new to the field, and to assist researchers to incorporate reliability study design principles into their own quantitative imaging studies.
In this review, we define relevant metrologic terminology and concepts including measurement, reliability, reproducibility, and agreement. We discuss common reliability studies, including intraobserver, interobserver, and method comparison studies. We introduce guidelines for reporting , reviewing , and critical appraisal of reliability studies, and we review statistical measures of reliability for continuous variables, including intraclass correlation coefficient (ICC), Pearson correlation coefficient, and measures of agreement including Bland-Altman graph and limits of agreement, standard error of measurement (SEM), and coefficient of variation (CV).
Definitions and Statistical Concepts
Measurements are central to biomedical research and clinical practice and are used to evaluate current disease status and change over time. In population studies, measurements permit useful comparison of health outcomes within or between patients. The Quantitative Imaging Biomarkers Alliance (QIBA) is an initiative by the Radiological Society of North America to promote the use of QIBs in clinical research and practice. QIBA working groups defined QIB concepts based on the Joint Committee for Guides in Metrology in 2012–2013 . For QIBs, measurement is the process of experimentally obtaining one or more quantity values that can reasonably be attributed to a quantity. Quantity is a property of a variable, where the property has a magnitude and can be expressed as a number, which is called quantity value. The measurand is the quantity intended to be measured .
Mu (µ) or mean, is a measure of central tendency of a data set, and is computed as the sum of the data set values divided by the number of values. Sigma (σ) or standard deviation (SD) is a measure used to quantify the dispersion of a set of data values, and is computed as the square root of the average of the squared differences from the mean (µ) divided by number of values minus 1. A low SD implies that the data values tend to be close to the mean, whereas a high SD implies the data points are spread out over a wider value range.
Measurement Uncertainties and Measurement Variability in QIBs
Get Radiology Tree app to read full this article<
Get Radiology Tree app to read full this article<
Get Radiology Tree app to read full this article<
Get Radiology Tree app to read full this article<
Get Radiology Tree app to read full this article<
Get Radiology Tree app to read full this article<
Get Radiology Tree app to read full this article<
Get Radiology Tree app to read full this article<
Get Radiology Tree app to read full this article<
Reliability Study Design
Get Radiology Tree app to read full this article<
Get Radiology Tree app to read full this article<
Get Radiology Tree app to read full this article<
Statistical Measures of Reliability for Continuous Variables
Get Radiology Tree app to read full this article<
Get Radiology Tree app to read full this article<
reliability=σ2tσ2t+σ2e reliability
=
σ
t
2
σ
t
2
+
σ
e
2
Get Radiology Tree app to read full this article<
Get Radiology Tree app to read full this article<
reliability=σ2tσ2t+σ2se+σ2re reliability
=
σ
t
2
σ
t
2
+
σ
s
e
2
+
σ
r
e
2
Get Radiology Tree app to read full this article<
Intraclass correlation coefficient (ICC)
Get Radiology Tree app to read full this article<
ICC=σ2pσ2p+σ2r+σ2residual I
C
C
=
σ
p
2
σ
p
2
+
σ
r
2
+
σ
residual
2
where (σ 2 p ) is the true QIB variance, ( σ2r σ
r
2 ) is the variance between observers, and ( σ2residual σ
residual
2 ) is the residual variance comprising interaction between observers and patients, in addition to random error.
Get Radiology Tree app to read full this article<
Acceptable ICC
Get Radiology Tree app to read full this article<
Pearson correlation coefficient
Get Radiology Tree app to read full this article<
Statistical Measures of Agreement for Continuous Variables
Get Radiology Tree app to read full this article<
Get Radiology Tree app to read full this article<
Bland-Altman Graph and Analysis
Get Radiology Tree app to read full this article<
limits of agreement=∑(x1−x2)n±1.96σdiff limits of agreement
=
∑
(
x
1
−
x
2
)
n
±
1.96
σ
diff
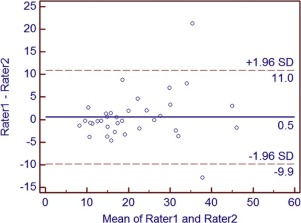
where x 1 is observer 1, x 2 is the other observer, n is the number of patients, and σ diff is the SD of the difference of measurements between observers. For Example 2 , using the Example 1 data set, we have drawn a Bland-Altman graph using MedCalc for Windows, version 12.4.0.0. This illustrates agreement between two observers and depicts bias of 0.5 and limits of agreement of (−9.9 to 11.0) ( Fig 2 ).
Get Radiology Tree app to read full this article<
Get Radiology Tree app to read full this article<
Get Radiology Tree app to read full this article<
SEM=σ(1−ICC)−−−−−−−−√ S
E
M
=
σ
(
1
−
I
C
C
)
Get Radiology Tree app to read full this article<
Coefficient of Variation
Get Radiology Tree app to read full this article<
CV=σof repeated measurementsμof repeated measurements C
V
=
σ
of repeated measurements
μ
of repeated measurements
Get Radiology Tree app to read full this article<
Get Radiology Tree app to read full this article<
Conclusion
Get Radiology Tree app to read full this article<
Summary Statements
Get Radiology Tree app to read full this article<
Get Radiology Tree app to read full this article<
Get Radiology Tree app to read full this article<
References
1. Buckler A.J., Bresolin L., Dunnick N.R., et. al.: A collaborative enterprise for multi-stakeholder participation in the advancement of quantitative imaging. Radiology 2011; 258: pp. 906-914.
2. Buckler A.J., Ouellette M., Danagoulian J., et. al.: Quantitative Imaging Biomarker Ontology (QIBO) for knowledge representation of biomedical imaging biomarkers. J Digit Imaging 2013; 26: pp. 630-641. Springer US
3. Sullivan D.C., Bresolin L., Seto B., et. al.: Introduction to metrology series. Stat Methods Med Res 2015; 24: pp. 3-8.
4. Kessler L.G., Barnhart H.X., Buckler A.J., et. al.: The emerging science of quantitative imaging biomarkers terminology and definitions for scientific studies and regulatory submissions. Stat Methods Med Res 2014; 24: pp. 9-26. 0962280214537333
5. Horn G.L., Hahn P.F., Tabatabaei S., et. al.: A practical primer on PI-RADS version 2: a pictorial essay. Abdom Radiol (NY) 2016; 41: pp. 899-906.
6. Moertel C.G., Hanley J.A.: The effect of measuring error on the results of therapeutic trials in advanced cancer. Cancer 1976; 38: pp. 388-394.
7. Kottner J., Gajewski B.J., Streiner D.L.: Guidelines for Reporting Reliability and Agreement Studies (GRRAS). Int J Nurs Stud 2011; 48: pp. 659-660. Elsevier Ltd
8. Mokkink L.B., Terwee C.B., Knol D.L., et. al.: The COSMIN checklist for evaluating the methodological quality of studies on measurement properties: a clarification of its content. BMC Med Res Methodol 2010; 10: pp. 22.
9. Lucas N.P., Macaskill P., Irwig L., et. al.: The development of a Quality Appraisal Tool for Studies of Diagnostic Reliability (QAREL). J Clin Epidemiol 2010; 63: pp. 854-861. Elsevier Inc
10. de Vet H.C.W., Terwee C.B., Knol D.L., et. al.: When to use agreement versus reliability measures. J Clin Epidemiol 2006; 59: pp. 1033-1039.
11. Guyatt G., Walter S., Norman G.: Measuring change over time: assessing the usefulness of evaluative instruments. J Chronic Dis 1987; 40: pp. 171-178.
12. Bartlett J.W., Frost C.: Reliability, repeatability and reproducibility: analysis of measurement errors in continuous variables. Ultrasound Obstet Gynecol 2008; 31: pp. 466-475.
13. Raunig D.L., McShane L.M., Pennello G., et. al.: Quantitative imaging biomarkers: a review of statistical methods for technical performance assessment. Stat Methods Med Res 2015; 24: pp. 27-67.
14. de Vet H.C.W., Terwee C.B., Mokkink L.B., et. al.: Measurement in Medicine.2011.Cambridge University PressUnited Kingdom
15. Kottner J., Audigé L., Brorson S., et. al.: Guidelines for Reporting Reliability and Agreement Studies (GRRAS) were proposed. J Clin Epidemiol 2011; 64: pp. 96-106. Elsevier Inc
16. Tinsley H.E.A., Brown S.D.: Handbook of Applied Multivariate Statistics and Mathematical Modeling.2000.Academic PressSan Diego 1 p
17. Shoukri M.M., Asyali M.H., Donner A.: Sample size requirements for the design of reliability study: review and new results. Stat Methods Med Res 2004; 13:
18. Fleiss J.L.: Design and analysis of clinical experiments. John Wiley & Sons2011. 1 p
19. Anvari A., Dhyani M., Stephen A.E., et. al.: Reliability of shear-wave elastography estimates of the Young modulus of tissue in follicular thyroid neoplasms. AJR Am J Roentgenol 2016; 206: pp. 609-616.
20. Bland J.M., Altman D.G.: Applying the right statistics: analyses of measurement studies. Ultrasound Obstet Gynecol 2003; 22: pp. 85-93.
21. Anvari A., Halpern E.F., Samir A.E.: Statistics 101 for radiologists. Radiographics 2015; 35: pp. 1789-1801.
22. Bland J.M., Altman D.G.: Statistical methods for assessing agreement between two methods of clinical measurement. Lancet 1986; 1: pp. 307-310.
23. Zaki R, Bulgiba A, Ismail R, Ismail NA.: Statistical methods used to test for agreement of medical instruments measuring continuous variables in method comparison studies: a systematic review. Rapallo F, editor PLoS ONE 2012; 7: e37908
24. Euser A.M., Dekker F.W., Cessie S.: A practical approach to Bland-Altman plots and variation coefficients for log transformed variables. J Clin Epidemiol 2008; 61: pp. 978-982.Giavarina D.: Understanding Bland Altman analysis. Biochemia Medica 2015; 25: pp. 141-151.
25. Reed G.F., Lynn F., Meade B.D.: Use of coefficient of variation in assessing variability of quantitative assays. Clin Vaccine Immunol 2002; 9: pp. 1235-1239.