
Rationale and Objectives
Magnetic resonance (MR) imaging is used to assess brain tumor response to therapies, and a MR quality assurance (QA) program is necessary for multicenter clinical trials employing imaging. This study was performed to determine overall variability of quantitative imaging metrics measured with the American College of Radiology (ACR) phantom among 11 sites participating in the Pediatric Brain Tumor Consortium (PBTC) Neuroimaging Center (NIC) MR QA program.
Materials and Methods
An MR QA program was implemented among 11 participating PBTC sites and quarterly evaluations of scanner performance for seven imaging metrics defined by the ACR were sought and subject to statistical evaluation over a 4.5-year period. Overall compliance with the QA program, means, standard deviations, and coefficients of variation (CV) for the quantitative imaging metrics were evaluated.
Results
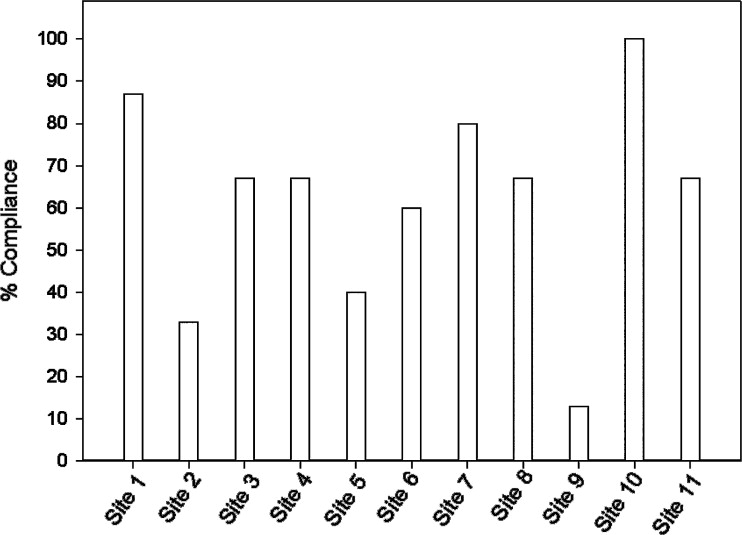
Quantitative measures of the seven imaging metrics were generally within ACR recommended guidelines for all sites. Compliance improved as the study progressed. Intersite variabilities, as gauged by CV for slice thickness and geometric accuracy, imaging parameters that influence size or positioning measurements in tumor studies, were on the order of 10% and 1%, respectively.
Conclusions
Although challenging to establish, MR QA programs within the context of PBTC multisite clinical trials when based on the ACR MR phantom program can indicate sites performing below acceptable image quality levels and establish levels of precision through instrumental variabilities that are relevant to quantitative image analyses (eg, tumor volume changes).
Among children ages 0–19 years, the incidence rate for pediatric brain tumors was 29.1 cases/1,000,000 between 1996 and 2003 ( ). Given these statistics, efforts to accrue sufficient numbers of patients for investigating more effective treatment strategies must hinge largely on multicenter trials, a defining feature of the National Institutes of Health–funded Pediatric Brain Tumor Consortium (PBTC), established in 1999. Comprising 10 major pediatric brain tumor research centers and the neuro-oncology branch of the National Cancer Institute, the PBTC broadened its mission in 2003 with the addition of the Neuroimaging Center (NIC) whose mission is three-fold to: 1) coordinate imaging research; 2) provide imaging support for novel therapeutic trials; and 3) develop a framework by which correlative imaging data are codified and uniformly applied to PBTC multicenter trials.
Equipped with relatively sophisticated neuroimaging capabilities and a commitment to neuroimaging research, the NIC is intensively engaged in facilitating quality assurance (QA) and promoting clinically relevant imaging research. Specifically, imaging acquisition protocols aimed primarily at positron emission tomography and magnetic resonance (MR) must be continuously analyzed, modified, updated, and uniformly applied across institutions and within relevant trials. The importance of standardizing acquisition protocols among sites cannot be understated. After protocols are standardized, tumor volume measurements, for example, typically calculated during most trials, can be compared reliably to those taken during similar or equivalent trials within the PBTC. In addition to standardizing imaging protocols, the NIC is assessing the variability of basic imaging metrics among the various PBTC instruments, gauging whether statistically significant differences exist, and determining whether these differences affect or skew findings within representative PBTC cohorts. An assessment of variability measures is an essential feature of any comprehensive QA program ( ), and nowhere is this more evident than in the context of MR, in general, and in the efforts of the NIC, in particular.
Get Radiology Tree app to read full this article<
Materials and methods
Overview of Data Collection Guidelines
Get Radiology Tree app to read full this article<
Get Radiology Tree app to read full this article<
Table 1
Results from the Geometric Accuracy Test from T1-weighted Images
Length (mm) n Mean Standard Deviation Min Max Coefficient Variation P1 148 259 146.91 1.27 140.00 149.50 0.87 P2 190 260 189.84 1.06 182.00 192.00 0.56 P3 190 260 189.94 0.78 186.00 192.00 0.41 P4 190 260 189.92 0.91 185.00 192.00 0.48 P5 190 260 189.85 1.05 180.10 193.00 0.55 P6 190 260 189.71 0.93 186.40 192.40 0.49 P7 190 260 189.78 0.83 186.90 192.00 0.44
Max, maximum; Min, minimum; P, phantom lengths.
The American College of Radiology specifies that lengths should be within ±2 mm of actual length shown in first column.
Get Radiology Tree app to read full this article<
Get Radiology Tree app to read full this article<
Get Radiology Tree app to read full this article<
E-mail Notification System for Submission of MR QA Reports
Get Radiology Tree app to read full this article<
Imaging Test Analysis
Get Radiology Tree app to read full this article<
Get Radiology Tree app to read full this article<
Get Radiology Tree app to read full this article<
Results
Get Radiology Tree app to read full this article<
Get Radiology Tree app to read full this article<
Get Radiology Tree app to read full this article<
Get Radiology Tree app to read full this article<
Table 2
High-contrast Spatial Resolution Results from the T1- and T2-weighted Images from the Lower Right (LR) and Upper Left (UL) Grids at the Three Separate Spatial Resolutions 1.1, 1.0, and 0.9 mm provided in the American College of Radiology Phantom
Scores T1 Percent Test Success T2 Percent Test Success LR (1.1) 100 100 UL (1.1) 100 100 LR (1.0) 97 94 UL (1.0) 98 98 RL (0.9) 58 38 UL (0.9) 54 39
The American College of Radiology specifies that a 1-mm resolution should be regularly achieved with the settings employed for this test.
Get Radiology Tree app to read full this article<
Get Radiology Tree app to read full this article<
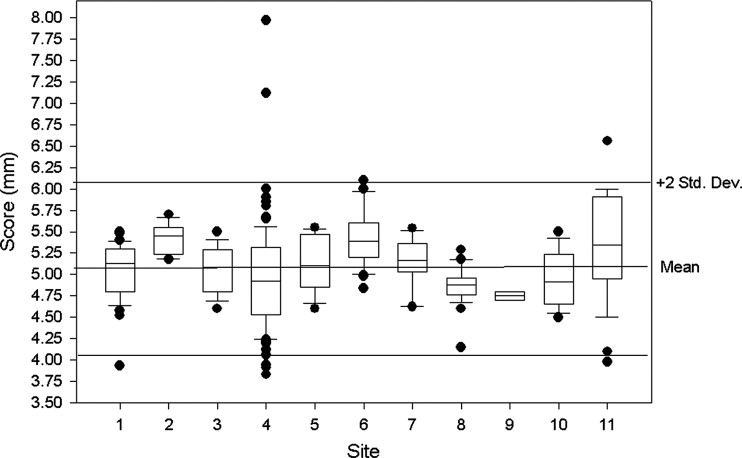
Table 3
MR QA Summary Statistics for the Remaining 5 Imaging Tests
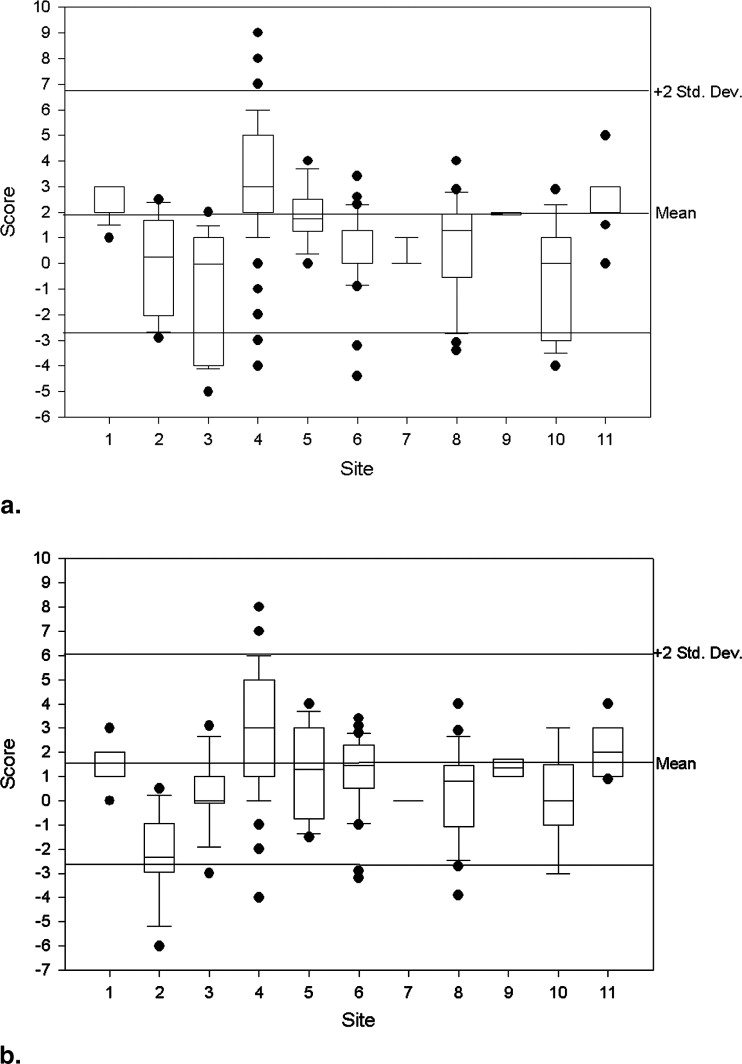
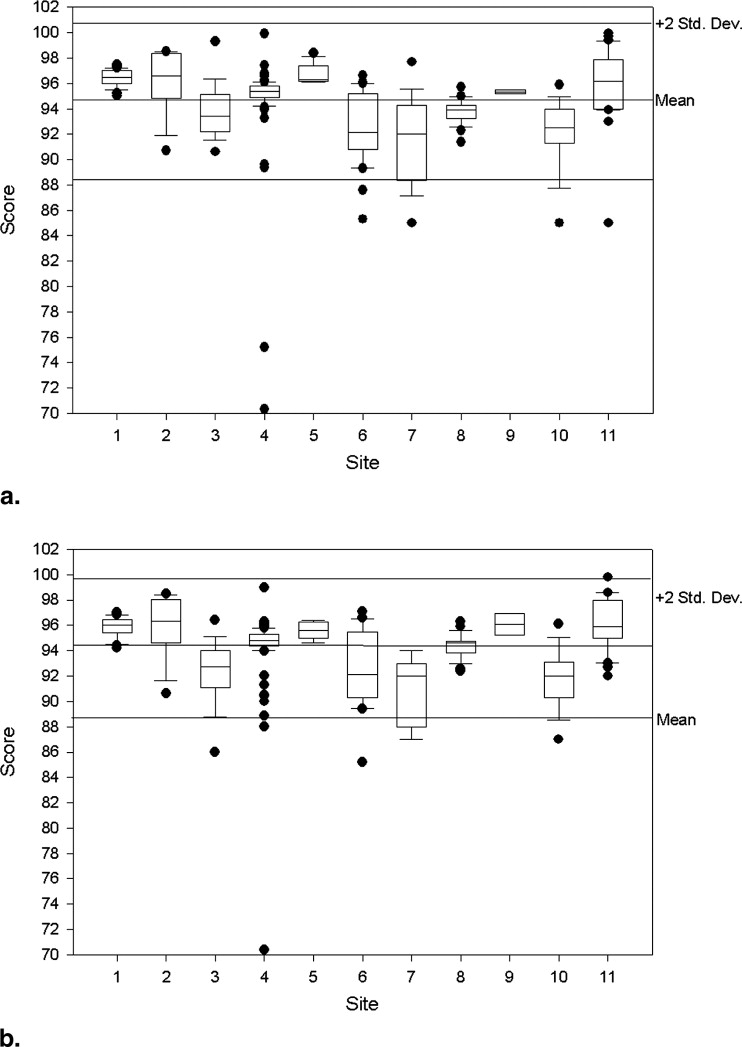
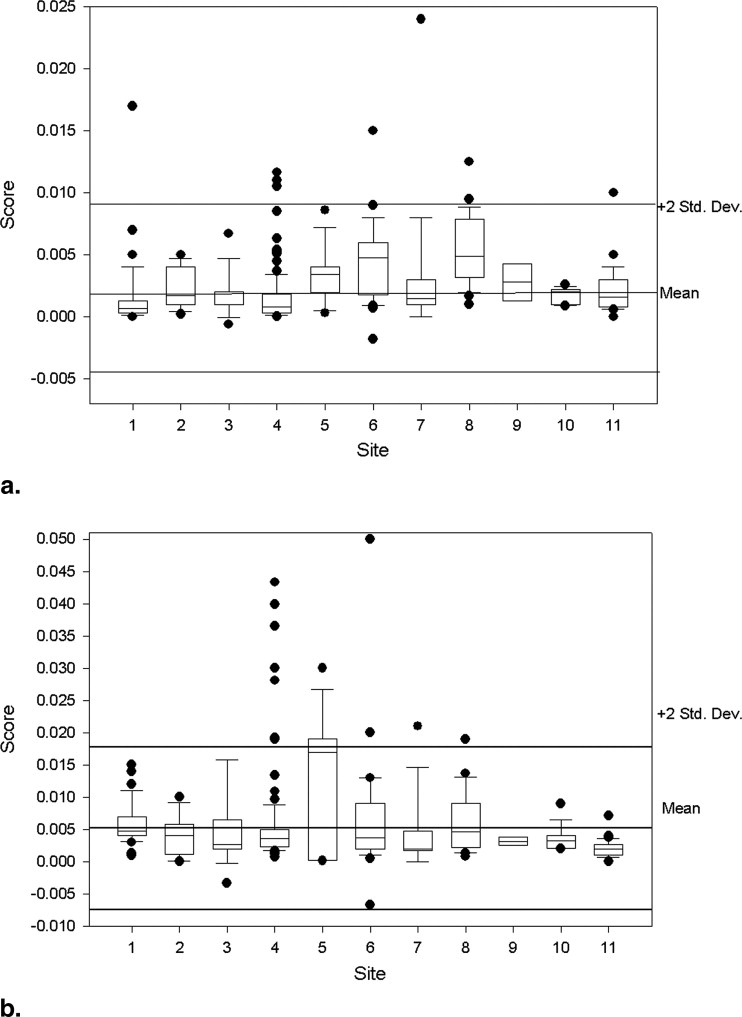
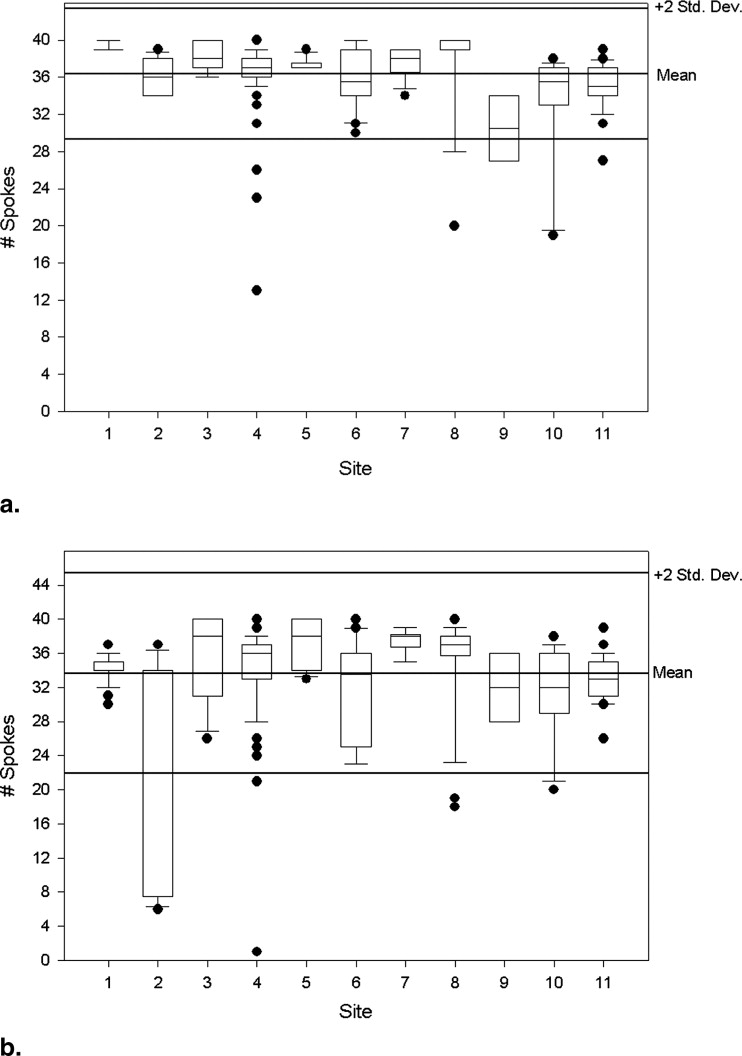
Measure n Mean (95% CI) Standard Deviation Coefficient Variation Median Min Max ACR Specs Slice thickness accuracy 261 5.07 (5.00–5.13) 0.52 10.34 5.05 3.83 7.97 5 ± 0.7 mm Slice 1 position accuracy 262 1.98 (1.69–2.28) 2.40 121.00 2.00 −5.00 9.00 <5 mm Slice 11 position accuracy 263 1.69 (1.42–1.95) 2.17 128.81 1.60 −6.00 8.00 <5 mm T1 percent integral uniformity 261 94.60 (94.22–94.98) 3.09 3.27 95.20 70.32 99.95 >87.5% T2 percent integral uniformity 259 94.28 (93.94–94.62) 2.77 2.94 94.80 70.37 99.80 >87.5% T1 signal ghosting ratio 260 0.0024 (0.0021–0.0028) 0.0030 125.39 0.0014 −0.0018 0.0240 <0.025 T2 signal ghosting ratio 256 0.0054 (0.0046–0.0063) 0.0068 125.85 0.0036 −0.0067 0.0500 <0.025 T1 low-contrast detectability 263 36.62 (36.19–37.05) 3.53 9.65 37.00 13.00 40.00 >9 T2 low-contrast detectability 260 33.68 (32.98–34.38) 5.75 17.08 35.00 1.00 40.00 >9
CI, confidence interval; Max, maximum; Min, minimum.
The American College of Radiology (ACR) recommended specifications for the various test values are provided in the last column.
Get Radiology Tree app to read full this article<
Get Radiology Tree app to read full this article<
Get Radiology Tree app to read full this article<
Get Radiology Tree app to read full this article<
Get Radiology Tree app to read full this article<
Get Radiology Tree app to read full this article<
Get Radiology Tree app to read full this article<
Get Radiology Tree app to read full this article<
Discussion
Get Radiology Tree app to read full this article<
Compliance
Get Radiology Tree app to read full this article<
Geometric Accuracy
Get Radiology Tree app to read full this article<
High Contrast
Get Radiology Tree app to read full this article<
Slice Thickness
Get Radiology Tree app to read full this article<
Slice Position Accuracy
Get Radiology Tree app to read full this article<
Image Intensity Uniformity
Get Radiology Tree app to read full this article<
Get Radiology Tree app to read full this article<
Ghosting Ratios
Get Radiology Tree app to read full this article<
Get Radiology Tree app to read full this article<
Low-contrast Detectability
Get Radiology Tree app to read full this article<
Get Radiology Tree app to read full this article<
Conclusion
Get Radiology Tree app to read full this article<
Acknowledgments
Get Radiology Tree app to read full this article<
Appendix
Pediatric Brain Tumor Consortium Neuroimaging Center MR Quality Assurance Form 2
Section A: General Information
Get Radiology Tree app to read full this article<
Get Radiology Tree app to read full this article<
Get Radiology Tree app to read full this article<
Get Radiology Tree app to read full this article<
Get Radiology Tree app to read full this article<
Section B: Results of Test 1—Geometric Accuracy
Get Radiology Tree app to read full this article<
Section C: Results of Test 2—High-contrast Spatial Resolution
Get Radiology Tree app to read full this article<
Section D: Results of Test 3—Slice Thickness Accuracy
Get Radiology Tree app to read full this article<
Section E: Results of Test 4—Slice Position Accuracy
Get Radiology Tree app to read full this article<
Section F: Results of Test 5—Image Intensity Uniformity
Get Radiology Tree app to read full this article<
Section G: Results of Test 6—Signal Ghosting Ratio
Get Radiology Tree app to read full this article<
Section H: Results of Test 7—Low-contrast Object Detectability
Get Radiology Tree app to read full this article<
Get Radiology Tree app to read full this article<
References
1. Ries L., Harkins D., Krapcho M.: SEER cancer statistics review, 1975-2003.2006.National Cancer InstituteBethesda, MD
2. The American College of Radiology for the ACR MRI accreditation program. Phantom test guidance2005. Reston, VA www.acr.org Accessed December 27, 2007.
3. Site scanning instructions for use of the MR phantom for the ACR MRI accreditation program: The American College of Radiology for the ACR MRI accreditation program.2005. Reston, VA www.acr.org
4. Evans A.C.: The NIH MRI study of normal brain development. NeuroImage 2006; 30: pp. 184-202.
5. Lerski R.A., de Certaines J.D.: Performance assessment and quality control in MRI by Eurospin test objects and protocols. Magn Reson Imaging 1993; 11: pp. 817-833.
6. Ihalainen T., Sipila O., Savolainen S.: MRI quality control: six imagers studied using eleven unified image quality parameters. Eur Radiol 2004; 14: pp. 1859-1865.
7. Colombo P., Baldassarri A., Del Corona M., et. al.: Multicenter trial for the set-up of a MRI quality assurance programme. Magn Reson Imaging 2004; 22: pp. 93-101.
8. Mulkern R.V., Wong S.T., Winalski C., et. al.: Contrast manipulation and artifact assessment of 2D and 3D RARE sequences. Magn Reson Imaging 1990; 8: pp. 557-566.
9. Constable R.T., Gore J.C.: The loss of small objects in variable TE imaging: implications for FSE, RARE, and EPI. Magn Reson Med 1992; 28: pp. 9-24.
10. Melki P.S., Jolesz F.A., Mulkern R.V.: Partial RF echo planar imaging with the FAISE method. Magn Reson Med 1992; 26: pp. 328-341.
11. Huisman T.A., Sorensen A.G.: Perfusion-weighted magnetic resonance imaging of the brain: techniques and application in children. Eur Radiol 2004; 14: pp. 59-72.
12. Wu O., Ostergaard L., Sorensen A.G.: Technical aspects of perfusion-weighted imaging. Neuroimaging Clin North Am 2005; 15: pp. 623-637.
13. Provenzale J.M., York G., Moya M.G., et. al.: Correlation of relative permeability and relative cerebral blood volume in high-grade cerebral neoplasms. AJR Am J Roentgenol 2006; 187: pp. 1036-1042.
14. Magnusson P., Olsson L.E.: Image analysis methods for assessing levels of image plane nonuniformity and stochastic noise in a magnetic resonance image of a homogeneous phantom. Med Phys 2000; 27: pp. 1980-1994.
15. Heidemann R.M., Ozsarlak O., Parizel P.M., et. al.: A brief review of parallel magnetic resonance imaging. Eur Radiol 2003; 13: pp. 2323-2337.
16. Olsrud J., Nilsson A., Mannfolk P., et. al.: A two-compartment gel phantom for optimization and quality assurance in clinical BOLD fMRI. Magn Reson Imag 2008; 26: pp. 279-286.
17. Mattila S., Renvall V., Hiltunen J., et. al.: Phantom-based evaluation of geometric distortions in functional magnetic resonance and diffusion tensor imaging. Magn Reson Med 2007; 57: pp. 754-763.