
Rationale and Objectives
Head circumference (HC) is an important developmental measure used both clinically and in research. This paper advances a method to estimate HC from imaging studies when a direct HC-tape measurement cannot be secured. Unlike former approaches, the model takes into account the fact that growth is nonlinear, and that HC growth rates are sexually dimorphic.
Materials and Methods
A model was first established based on published data to represent the normative HC growth curves for males and females. Then, using magnetic resonance (MR) studies of 90 subjects (birth to 18 years), a linear method to estimate HC was adapted to take into account the nonlinear and sex-specific HC normative growth curves. The accuracy of this model was tested prospectively by comparing the estimated HC with HC measurements from twelve computed tomography (CT) studies using the perimeter tracing of oblique slices that correspond to the plane at which a clinical HC-tape measurement is secured.
Results
Prospective comparison of estimated HC to HC tracings using a paired t-test validates that the model provides an accurate estimation of the measured HC (t=−.845, p=0.416 overall; t=.54, p=.615 for females and t=−2.34, p=.066 for males).
Discussion
HC can be calculated indirectly from imaging studies. The model is highly predictive of HC-tape measurements and provides the physician or scientist with a very reliable method to secure HC when it is not feasible to secure the HC-tape measurement.
Introduction
Measurements of head size, both prenatally and postnatally, are medically important to assess the growth of the cranium. The typical prenatal ultrasound measurement is based on biparietal (BP) diameter or head circumference (HC) tracing ( ). The conventional postnatal clinical method, which is reportedly a highly reliable measurement ( ), is to secure a direct HC measurement by applying a measuring tape around the frontal forehead and occiput (HC-tape). HC-tape measurement is typically not secured clinically after age 2 and is therefore not always a readily available measurement to secure retrospectively for medical or research purposes. Thus, the purpose of this paper is to estimate HC from imaging studies when a direct HC-tape measurement or HC tracing cannot be secured.
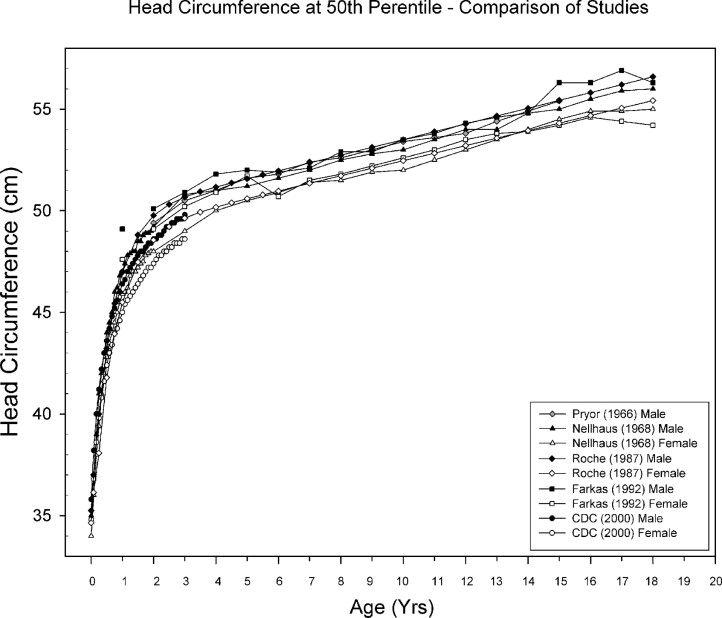
There are only a few studies that report on HC measurement throughout the developmental age range, i.e. , approximately the first two decades of life ( Table 1 ) ( ). The HC measurements reported by Nellhaus ) span the entire developmental age range and are used as the normative standard in most specialty clinics ( ). HC follows the neural growth curve, as defined by Scammon; by age 6 years HC has reached 80 % of its adult size, but continues to increase at a more gradual rate until about age 18 ( ) ( Figure 1 ).
Table 1
Summary of Studies with Normative Head Circumference Measurements
Study Year Total (N) Age Range Geography How HC was Measured Male Female Pryor 1966 12000 One to 15 years US Caucasians Millimeter tapes with spring handles to regulate tension. 6000 (M) 6000 (F) Nellhaus 1968 NA Birth to 18 years North America, Scotland, Belgium, Sweden, Switzerland, England, Japan, Finland, Czechoslovakia Tape applied over the greatest frontal protuberances; means and standard deviations for age and sex were calculated from the pooled variances of reports of HC published since 1948. Roche 1987 888 Birth to 18 years US (Ohio) The tape was placed with its inferior margin just touching the superior borders of the eyebrows. The posterior part of the tape was aligned so that the maximum head circumference was recorded. Farkas 1992 1596 One to 18 years North American Caucasians Measurements taken directly from head of subject; on glabella-opisthocranion plane. 792 (M) 804 (F) CDC Centers for Disease Control & Prevention 2000 362 Birth to 36 months US (National Survey) Data for HC at birth from 362 infants in the Fels Longitudinal Study who were born between the years 1960 and 1994, corresponding to the national surveys.
Get Radiology Tree app to read full this article<
Get Radiology Tree app to read full this article<
Get Radiology Tree app to read full this article<
Materials and methods
Get Radiology Tree app to read full this article<
Subjects
Get Radiology Tree app to read full this article<
Get Radiology Tree app to read full this article<
Get Radiology Tree app to read full this article<
Get Radiology Tree app to read full this article<
Measurements
Get Radiology Tree app to read full this article<
Get Radiology Tree app to read full this article<
Results
Normative HC Development Model
Get Radiology Tree app to read full this article<
g(x,λ)={(xλ−1)/λ,logx,λ≠0λ=0, g
(
x
,
λ
)
=
{
(
x
λ
−
1
)
/
λ
,
λ
≠
0
log
x
,
λ
=
0
,
Get Radiology Tree app to read full this article<
Get Radiology Tree app to read full this article<
Y=β0+β1g(x,λ)+β2g(x,γ)+e, Y
=
β
0
+
β
1
g
(
x
,
λ
)
+
β
2
g
(
x
,
γ
)
+
e
,
Get Radiology Tree app to read full this article<
Get Radiology Tree app to read full this article<
Female:HCNellhaus=34.0530+8.1589×g(age+1,−0.25)−7.6527×g(age+1,−2)−0.0187×g(age+1,1.75)+0.0155×g(age+1,1.79) Female
:
HC
Nellhaus
=
34.0530
+
8.1589
×
g
(
age
+
1
,
−
0.25
)
−
7.6527
×
g
(
age
+
1
,
−
2
)
−
0.0187
×
g
(
age
+
1
,
1.75
)
+
0.0155
×
g
(
age
+
1
,
1.79
)
Male:HCNellhaus=35.0923+9.2739×g(age+1,−0.30)−9.6138×g(age+1,−2)+0.0659×g(age+1,1.80)−0.0690×g(age+1,1.79) Male
:
HC
Nellhaus
=
35.0923
+
9.2739
×
g
(
age
+
1
,
−
0.30
)
−
9.6138
×
g
(
age
+
1
,
−
2
)
+
0.0659
×
g
(
age
+
1
,
1.80
)
−
0.0690
×
g
(
age
+
1
,
1.79
)
Get Radiology Tree app to read full this article<
Get Radiology Tree app to read full this article<

Get Radiology Tree app to read full this article<
Estimating HC Using the Normative HC Development Model
Get Radiology Tree app to read full this article<
HCLab=π×0.5×(HL2+ManW2)−−−−−−−−−−−−−−−−−−√ HC
Lab
=
π
×
0.5
×
(
HL
2
+
ManW
2
)
Get Radiology Tree app to read full this article<
Get Radiology Tree app to read full this article<
Female:HCLab-Corrected/Nellhaus=7.7550−5.3610×g(HCLab,2)+5.5860×g(HCLab,1.99) Female:
HC
Lab-Corrected/Nellhaus
=
7.7550
−
5.3610
×
g
(
HC
Lab
,
2
)
+
5.5860
×
g
(
HC
Lab
,
1.99
)
Male:HCLab-Corrected/Nellhaus=−91017−706402×g(HCLab,−1.95)+906667×g(HCLab,−2) Male:
HC
Lab-Corrected/Nellhaus
=
−
91017
−
706402
×
g
(
HC
Lab
,
−
1.95
)
+
906667
×
g
(
HC
Lab
,
−
2
)
Get Radiology Tree app to read full this article<
Get Radiology Tree app to read full this article<

Get Radiology Tree app to read full this article<
Prospective Verification of the Model
Get Radiology Tree app to read full this article<
Get Radiology Tree app to read full this article<
Discussion
Get Radiology Tree app to read full this article<
Get Radiology Tree app to read full this article<
Get Radiology Tree app to read full this article<
Get Radiology Tree app to read full this article<
Get Radiology Tree app to read full this article<
Get Radiology Tree app to read full this article<
Acknowledgements
Get Radiology Tree app to read full this article<
Get Radiology Tree app to read full this article<
References
1. Dobbing J., Sands J.: Head circumference, biparietal diameter and brain growth in fetal and postnatal life. Early Human Development 1978; 2: pp. 81-87.
2. Chitty L.S., Altman D.G., Henderson A., Campbell S.: Charts of fetal size: 2. Head measurements. British Journal of Obstretrics and Gynaecology 1994; 101: pp. 35-43.
3. Johnsen S.L., Wilsgaard T., Rasmussen S., Sollien R., Kiserud T.: Longitudinal reference charts for growth of the fetal head, abdomen and femur. European Journal of Obstetrics and Gynecology and Reproductive Biology 2006; 127: pp. 172-185.
4. Sher P., Brown S.: A longitudinal study of head growth in pre-term infants, I: normal rates of head growth. Developmental Medicine & Child Neurology 1975; 17: pp. 705-710.
5. WHO Multicentre Growth Reference Study Group: Reliability of anthropometric measurements in the WHO Multicentre Growth Reference Study. Acta Paediatrica 2006; 450: pp. 38-46.
6. Pryor H.: Charts of normal body measurement and revised width-weight tables in graphic form. Journal of Pediatrics 1966; 68: pp. 615-631.
7. Nellhaus G.: Head circumference from birth to eighteen years. Pediatrics 1968; 41: pp. 106-114.
8. Roche A.F., Mukherjee D., Guo S., Moore W.M.: Head circumference reference data: Birth to 18 year. Pediatrics 1987; 79: pp. 706-712.
9. Farkas L., Posnick J.: Growth and Development of Regional Units in the Head and Face based on Anthropometric Measurements. Cleft Palate-Craniofacial Journal 1992; 29: pp. 300-329.
10. Centers for Disease Control and Prevention, National Center for Health Statistics: CDC growth charts: United States.2002.
11. Rudolph C.D., Rudolph A.M., Hostetter M.K., Lister G., Siegel N.J.: Rudolph’s Pediatrics.21st Ed.2003.McGraw-HillNew York
12. Scammon R.E.: The measurement of the body in childhood.Harris J.A.Jackson C.M.Patterson D.G.Scammon R.E.The measurement of Man.1930.University of Minnesota PressMinneapolis:pp. 173-215.
13. Oba H., Terada H., Norman D., Barkovich J.: Measurement of Children’s Head Circumference by MRI. International Journal of Neuroradiology 1996; 2: pp. 73-76.
14. Terada H., Oba H., Barkovich T., Norman D.: Measurement of Children’s Head Circumference by MRI. International Journal of Neuroradiology 1996; 2: pp. 77-82.
15. Vorperian H.K., Kent R.D., Lindstrom M.J., Kalina C.M., Gentry L.R., Yandell B.S.: Development of vocal tract length during early childhood: A Magentic Resonance Imaging Study. Journal of the Acoustical Society of America 2005; 117: pp. 338-350.
16. Box G.E.P., Cox D.R.: An analysis of transformations. Journal of the Royal Statistical B 1964; 26: pp. 211-252. (with discussion)
17. Seber G.A.F., Lee A.J.: Linear Regression Analysis.2nd ed.2003.WileyNew York
18. Gale C.R., O’Callaghan F.J., Bredow M., Martyn C.N., Avon Longitudinal Study of Parents and Children Study Team: The influence of head growth in fetal life, infancy, and childhood on intelligence at the ages of 4 and 8 years. Pediatrics 2006; 118: pp. 1486-1492. Oct
19. Hazlett H.C., Poe M., Gerig G., et. al.: Magnetic resonance imaging and head circumference study of brain size in autism: birth through age 2 years. Arch Gen Psychiatry 2005; 62: pp. 1366-1376.
20. Redcay E., Courchesne E.: When is the brain enlarged in autism?. Biol Psychiatry 2005; 58: pp. 1-9. Jul 1
21. Toledo C., Alembik Y., Aguirre Jaime A., Stoll C.: Growth curves of children with Down syndrome. Ann Genet 1999; 42: pp. 81-90.