
Rationale and Objectives
The goal of this study was to determine the accuracy and precision of using scores from a receiver operating characteristic rating scale to estimate sensitivity and specificity.
Materials and Methods
We used data collected in a previous study that measured the improvements in radiologists’ ability to classify mammographic microcalcification clusters as benign or malignant with and without the use of a computer-aided diagnosis scheme. Sensitivity and specificity were estimated from the rating data from a question that directly asked the radiologists their biopsy recommendations, which was used as the “truth,” because it is the actual recall decision, thus it is their subjective truth. By thresholding the rating data, sensitivity and specificity were estimated for different threshold values.
Results
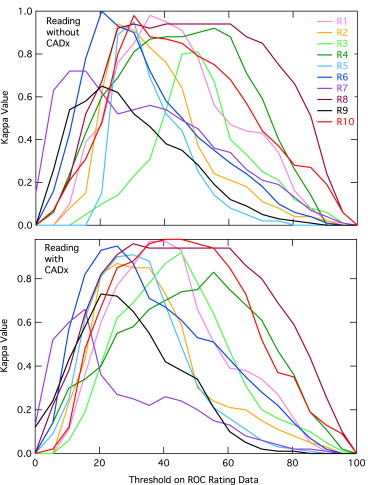
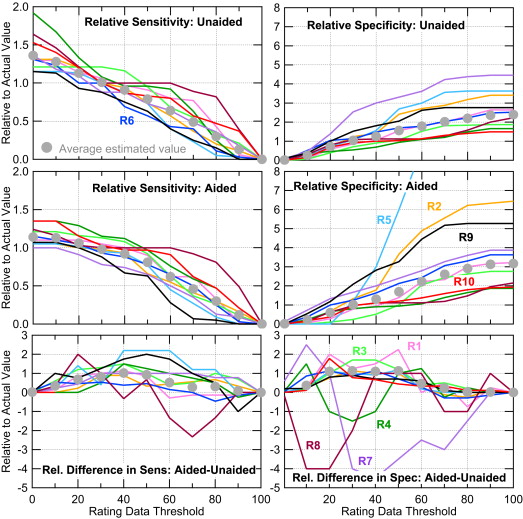
Because of interreader and intrareader variability, estimated sensitivity and specificity values for individual readers could be as much as 100% in error when using rating data compared to using the biopsy recommendation data. When pooled together, the estimates using thresholding the rating data were in good agreement with sensitivity and specificity estimated from the recommendation data. However, the statistical power of the rating data estimates was lower.
Conclusions
By simply asking the observer his or her explicit recommendation (eg, biopsy or no biopsy), sensitivity and specificity can be measured directly, giving a more accurate description of empirical variability and the power of the study can be maximized.
Receiver operating characteristic (ROC) analysis is a useful tool to evaluate imaging technology . When used in an observer study or a clinical study , ROC analysis can be used to compare two different technologies or different reading conditions. Area under the ROC curve (AUC) is often used as a summary figure of merit as it is independent of how aggressively the radiologist reads. That is, two radiologists can have the same diagnostic accuracy, as measured by AUC, but different sensitivity and specificity values for the actual binary (diseased or not diseased) medical decision. Compared to a conservative radiologist, an aggressive radiologist will have higher sensitivity, but lower specificity even if both have the same AUC. Thus, AUC is a better metric for estimating the general diagnostic accuracy of a radiologist.
While it is useful to measure an ROC curve and compute AUC, clinically, radiologists operate at a single point on the ROC curve. This operating point is important because it will define the radiologist’s sensitivity and specificity. These two metrics are needed to calculate efficacy of using a technology–clinical utility and cost-effectiveness depend directly on sensitivity and specificity and not AUC . In fact, AUC cannot be used to estimate cost-effectiveness because it is averaged across both positive and negative cases while it contains no information about prevalence. Thus, it is important to determine sensitivity and specificity as accurately and precisely as possible. Further, Gur et al have argued that sensitivity and specificity maybe a more relevant clinical end points and in fact can have statistical advantages over AUC in certain situations.
Get Radiology Tree app to read full this article<
Get Radiology Tree app to read full this article<
Get Radiology Tree app to read full this article<
Method
Get Radiology Tree app to read full this article<
Get Radiology Tree app to read full this article<
Get Radiology Tree app to read full this article<
Get Radiology Tree app to read full this article<
Get Radiology Tree app to read full this article<
Get Radiology Tree app to read full this article<
Get Radiology Tree app to read full this article<
Get Radiology Tree app to read full this article<
Results
Get Radiology Tree app to read full this article<
Table 1
Readers’ Rating Data near the Division between Biopsy and No-Biopsy Cases for Benign Cases (B) and Malignant Cases (M)
R1 R2 R3 R4 R5 R6 R7 R8 R9 R10 B M B M B M B M B M B M B M B M B M B M_11_11__13__14__14__15__16__17__18__11__18__12__18__12__19__14__25__15__26__16__26__17__27__19__29__22__31__24__33__24__18__10__45__37__24__20__14__14__50__48__28__18__29__24__18__15__51__45__53__29__27__30__27__24__19__17__51__47__53__33__34__45__35__25__21__20__42__31__28__26__53__50__65__36__26__28__17__16__39__47__36__25__23__31__36__264440284045441137303322311619246512143132484860511622341714323449516062162335201435365253611724201653631827212553631929222763204124642024642526652526272728303740404345
The cases in italics were not recommended for biopsy, whereas the cases in bold were recommended. For each reader (R), the cases were sorted by biopsy recommendation, and then within each group, the cases were sorted in numerical order. The visual analog scale marking was converted to a value between 0 and 100.
Get Radiology Tree app to read full this article<
Get Radiology Tree app to read full this article<
Table 2
Comparison of the Actual and Estimated Sensitivities and Specificities for the 10 Readers
Reader Actual Sensitivity Estimated Sensitivity % Error Actual Specificity Estimated Specificity % Error R1 0.761 0.804 6% 0.310 0.241 −22% R2 0.761 0.761 0% 0.155 0.172 11% R3 0.826 1.000 21 0.362 0.069 −81 R4 0.522 0.587 13 0.534 0.414 −23 R5 0.870 0.870 0 0.086 0.086 0 R6 0.761 0.761 0 0.276 0.345 25 R7 0.717 0.696 −3 0.259 0.431 67 R8 0.609 0.609 0 0.466 0.448 −4 R9 0.870 0.761 −13 0.190 0.379 100 R10 0.652 0.652 0 0.517 0.414 −20 Average 0.735 0.750 0.316 0.300 Standard deviation 0.113 0.124 0.154 0.146
The estimates are for a threshold of 29.5 on the unaided reading condition. The percentage error (% error) is between the actual and estimated values.
Get Radiology Tree app to read full this article<
Get Radiology Tree app to read full this article<
Table 3
Sensitivity and Specificity Values Averaged over 10 Radiologists for Different Thresholds Applied to the Rating Scores
Threshold Sensitivity Specificity Unaided Aided_P_ Value Unaided Aided_P_ Value Average SD % diff Average SD % diff Average SD % diff Average SD % diff 25.5 0.77 0.12 4 0.88 0.07 1 .0021 0.27 0.14 −15 0.38 0.10 −9 .0067 26.5 0.76 0.12 4 0.88 0.07 1 .0017 0.28 0.14 −11 0.39 0.10 −7 .0103 27.5 0.75 0.12 3 0.88 0.07 0 .0021 0.29 0.15 −8 0.40 0.10 −4 .0096 28.5 0.75 0.12 2 0.87 0.07 0 .0029 0.30 0.15 −5 0.41 0.10 −1 .0089 29.5 0.74 0.13 1 0.87 0.07 −1 .0043 0.31 0.15 −3 0.43 0.11 2 .0082 30.5 0.74 0.13 1 0.86 0.07 −2 .0047 0.32 0.15 1 0.44 0.12 4 .0059 31.5 0.73 0.13 0 0.85 0.07 −2 .0037 0.33 0.15 4 0.44 0.11 5 .0081 32.5 0.72 0.13 −2 0.84 0.08 −3 .0029 0.34 0.15 7 0.45 0.12 7 .0065 33.5 0.71 0.13 −3 0.84 0.08 −4 .0044 0.34 0.15 9 0.47 0.13 11 .0037 Actual 0.73 0.11 0.87 0.09 .0006 0.32 0.15 0.42 0.15 .0026
Percentage difference (% diff) is the difference from the actual value given in the last row. The P value is for the difference between the aided and unaided sensitivities or specificities, calculated using a pair, two-tailed t test.
Get Radiology Tree app to read full this article<
Discussion
Get Radiology Tree app to read full this article<
Get Radiology Tree app to read full this article<
Get Radiology Tree app to read full this article<
Get Radiology Tree app to read full this article<
Get Radiology Tree app to read full this article<
Get Radiology Tree app to read full this article<
Conclusions
Get Radiology Tree app to read full this article<
Get Radiology Tree app to read full this article<
References
1. Metz C.E.: Basic principles of ROC analysis. Semin Nucl Med 1978; 8: pp. 283-298.
2. Shiraishi J., Pesce L.L., Metz C.E., et. al.: Experimental design and data analysis in receiver operating characteristic studies: lessons learned from reports in radiology from 1997 to 20061. Radiology 2009; 253: pp. 822-830.
3. Berg W.A., Blume J.D., Cormack J.B., et. al.: Combined screening with ultrasound and mammography vs mammography alone in women at elevated risk of breast cancer. JAMA 2008; 299: pp. 2151-2163.
4. Pisano E.D., Gatsonis C., Hendrick E., et. al.: Diagnostic performance of digital versus film mammography for breast-cancer screening. N Engl J Med 2005; 353: pp. 1773-1783.
5. Metz C.E.: ROC methodology in radiologic imaging. Investig Radiol 1986; 21: pp. 720-733.
6. Wagner R.E., Beam C.A., Beiden S.V.: Reader variability in mammography and its implications for expected utility over the population of readers and cases. Med Decis Making 2004; 24: pp. 561-572.
7. Gur D., Bandos A.I., Rockette H.E., et. al.: Is an ROC-type response truly always better than a binary response in observer performance studies?. Acad Radiol 2010; 17: pp. 639-645.
8. Beam C.A., Layde P.M., Sullivan D.C.: Variability in the interpretation of screening mammograms by US radiologists. Findings from a national sample. Arch Intern Med 1996; 156: pp. 209-213.
9. Jiang Y., Nishikawa R.M., Schmidt R.A., et. al.: Improving breast cancer diagnosis with computer-aided diagnosis. Acad Radiol 1999; 6: pp. 22-33.
10. Dorfman D.D., Berbaum K.S., Metz C.E.: Receiver operating characteristic rating analysis. Generalization to the population of readers and patients with the jackknife method. Invest Radiol 1992; 27: pp. 723-731.
11. Barlow W.E., Lehman C.D., Zheng Y., et. al.: Performance of diagnostic mammography for women with signs or symptoms of breast cancer. J Natl Cancer Inst 2002; 94: pp. 1151-1159.