
Rationale and Objectives
This study aims to estimate observer performance for a range of dose levels for common computed tomography (CT) examinations (detection of liver metastases or pulmonary nodules, and cause of neurologic deficit) to prioritize noninferior dose levels for further analysis.
Materials and Methods
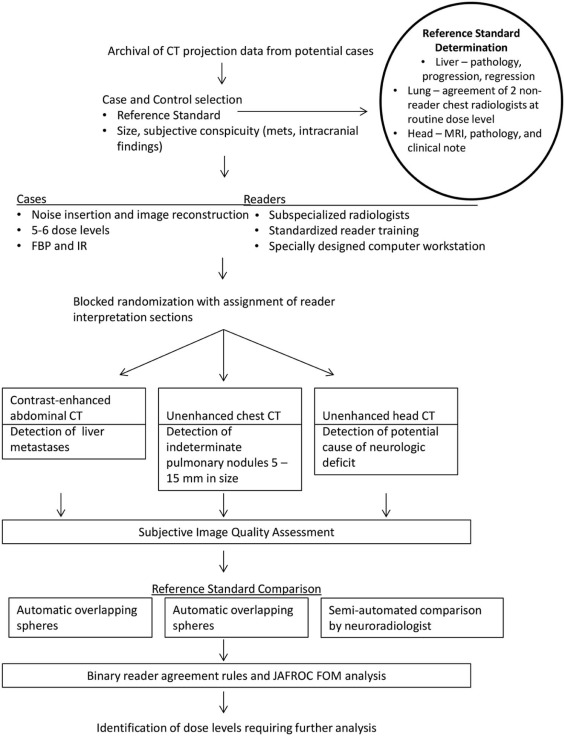
Using CT data from 131 examinations (abdominal CT, 44; chest CT, 44; head CT, 43), CT images corresponding to 4%–100% of the routine clinical dose were reconstructed with filtered back projection or iterative reconstruction. Radiologists evaluated CT images, marking specified targets, providing confidence scores, and grading image quality. Noninferiority was assessed using reference standards, reader agreement rules, and jackknife alternative free-response receiver operating characteristic figures of merit. Reader agreement required that a majority of readers at lower dose identify target lesions seen by the majority of readers at routine dose.
Results
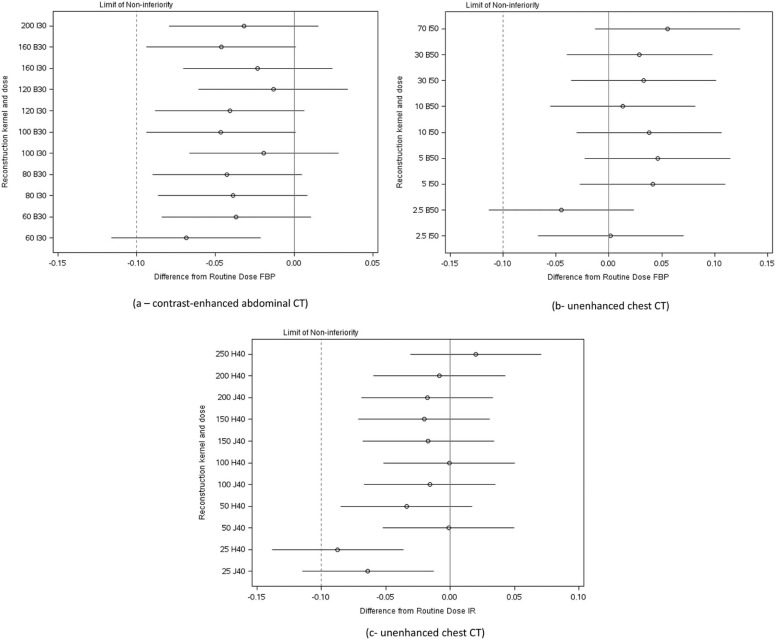
Reader agreement identified dose levels lower than 50% and 4% to have inadequate performance for detection of hepatic metastases and pulmonary nodules, respectively, but could not exclude any low dose levels for head CT. Estimated differences in jackknife alternative free-response receiver operating characteristic figures of merit between routine and lower dose configurations found that only the lowest dose configurations tested (ie, 30%, 4%, and 10% of routine dose levels for abdominal, chest, and head CT examinations, respectively) did not meet criteria for noninferiority. At lower doses, subjective image quality declined before observer performance. Iterative reconstruction was only beneficial when filtered back projection did not result in noninferior performance.
Conclusion
Opportunity exists for substantial radiation dose reduction using existing CT technology for common diagnostic tasks.
Introduction
Computed tomography (CT) imaging is widely used in medical practice to quickly and accurately diagnose a large number of medical conditions and to guide appropriate medical or surgical management. CT is commonly available and readily interpreted by radiologists and referring clinicians, and can provide images with high spatial and temporal resolution that cover large regions of the body, with few contraindications to imaging.
The most notable concern for CT imaging is that it requires exposure to ionizing radiation, and there are both provider and patient concerns over the risk of radiation-induced malignancy, with this risk being low but uncertain for each patient and a subject of ongoing debate . The medical justification for performing CT imaging is that anticipated benefit exceeds anticipated risk. The optimal dose of radiation that will accomplish the diagnostic task but not compromise diagnostic performance should be used . However, this “optimal” dose is not known for even the most common CT examinations, resulting in a wide spectrum of radiation doses being used, even for frequently performed examinations . Alternatively, some radiology practices reduce radiation dose so much that observer performance is compromised, negating the beneficial impact of CT imaging. The lack of available evidence on what dose levels are required to achieve specific results is due to many factors, for example, evolving technology, inability or impracticality of obtaining multiple dose levels simultaneously or consecutively, fear that substantial lowering of the dose may result in compromised diagnostic benefit, and difficulty in study design and expense . To this end, the National Institute of Biomedical Imaging and Bioengineering has held a series of expert conferences and sponsored grants to lay out a pathway to systematically lower radiation dose from CT imaging .
Get Radiology Tree app to read full this article<
Get Radiology Tree app to read full this article<
Get Radiology Tree app to read full this article<
Materials and Methods
Get Radiology Tree app to read full this article<
Get Radiology Tree app to read full this article<
TABLE 1
Reference Standard Criteria for Target Lesions for Each Diagnostic Task in the Present Study
Cohort of Cases Reference Standard Hepatic Metastasis Detection of Indeterminate Pulmonary Nodules Cause of Potential Acute Neurologic Deficit Positive cases_For each case_
Get Radiology Tree app to read full this article<
Two chest radiologists, not participating as readers in the present study, independently evaluate routine dose CT images, unblinded to prior and subsequent examinations
Head CT findings visible in retrospect by diagnostic task leader, and one of the following
Negative cases without other findings
Two nonreader chest radiologists verify the absence of indeterminate pulmonary nodules compared to prior and subsequent CT examinations Two nonreader neuroradiologists to agree on absence of CT findings on routine dose images that would indicate acute neurologic deficit, as well as corresponding neurologic assessment before discharge Negative cases with benign findings Characteristic imaging features plus stability on separate CT or MR examination performed ≥5 months from index CT Not applicable (granulomas are not marked or tracked) Leukoaraiosis was confirmed and noted when present on subsequent MRI examination
CT, computed tomography; GI, gastrointestinal; MR, magnetic resonance; MRI, magnetic resonance imaging.
Get Radiology Tree app to read full this article<
Get Radiology Tree app to read full this article<
Get Radiology Tree app to read full this article<
Get Radiology Tree app to read full this article<
CT Acquisition and Image Reconstruction at Varying Dose Levels
Get Radiology Tree app to read full this article<
TABLE 2
CT Acquisition and Reconstruction Parameters
Acquisition Parameter CT Diagnostic Tasks Detection of Liver Metastases (Contrast-enhanced Abdominal CT) Detection of Indeterminate Pulmonary Nodules (Unenhanced Chest CT) Detection of Potential Causes of Acute Neurologic Deficit (Unenhanced Head CT) Tube energy (kVp) Vendor-supplied automatic kV selection 120 kV 120 kV Tube current setting of routine clinical examination 200 QRM 70 QRM 250 eff. mAs Automatic exposure control On On Off Axial slice thickness and reconstruction interval (mm) 3/2 1.5/1 5/5 Other reconstruction volumes (slice thickness and reconstruction interval [mm]) Coronal 3/2 Thick maximum intensity projection
10/2.5 N/A Reconstruction kernels (FBP or IR) B30/I30 (2) B50/I50 (2) H40/J40 (2) Dose levels (as represented by tube current setting) examined by all readers (top value is routine setting) 200 QRM 70 QRM 250 eff. mAs 160 QRM 30 QRM 200 eff. mAs 120 QRM 10 QRM 150 eff. mAs 100 QRM 5 QRM 100 eff. mAs 80 QRM 2.5 QRM 50 eff. mAs 60 QRM — 25 eff. mAs Dose levels examined by nominal CTDI vol (mGy) 13.5 4.7 38.3 10.8 2.0 30.6 8.1 0.7 23.0 6.8 0.3 15.3 5.4 0.2 7.7 4.1 3.8 Total number of dose and kernel configurations 12 10 12
CT, computed tomography; CTDI vol , volume computed tomography dose index; eff. mAs, effective milliampere-second; FBP, filtered back projection; IR, iterative reconstruction; QRM, quality reference milliampere-second, the setting for the CT system automatic exposure control that delivers equivalent image quality at a given setting across patients of different sizes.
Get Radiology Tree app to read full this article<
Get Radiology Tree app to read full this article<
Image Evaluation
Get Radiology Tree app to read full this article<
Get Radiology Tree app to read full this article<
TABLE 3
Potential Diagnoses Provided by the Subspecialized Radiologists for Circumscribed Lesions Using a Drop-down Menu
Hepatic Metastases Chest CT Potential Causes of Acute Neurologic Deficit*
CT, computed tomography; FNH, focal nodular hyperplasia; RFA, radiofrequency ablation.
Readers specified the location and diagnosis by circumscribing each lesion with region-of-interest tools.
Get Radiology Tree app to read full this article<
Get Radiology Tree app to read full this article<
Reference Standard Assignment and Matching of Reader and Reference Lesions
Get Radiology Tree app to read full this article<
Get Radiology Tree app to read full this article<
Get Radiology Tree app to read full this article<
Statistical Analysis
Get Radiology Tree app to read full this article<
Get Radiology Tree app to read full this article<
Get Radiology Tree app to read full this article<
Get Radiology Tree app to read full this article<
Get Radiology Tree app to read full this article<
Get Radiology Tree app to read full this article<
Get Radiology Tree app to read full this article<
Results
Get Radiology Tree app to read full this article<
Get Radiology Tree app to read full this article<
Get Radiology Tree app to read full this article<
Get Radiology Tree app to read full this article<
TABLE 4
Number of Successfully Interpreted Cases for Each Diagnostic Task—at Every Dose-Reconstruction Configuration—Using Binary Reader Agreement Rules
Contrast-enhanced Abdominal CT for Hepatic Metastasis Dose Level by AEC Setting (QRM) Reconstruction Kernel (FBP or IR) # of Readers with Successful Interpretation Successful Interpretations
All Cases Successful Interpretations
Cases with ( n = 21) : Cases without ( n = 23) Essential Lesions 0/3 1/3 2/3 3/3 200 B30 0 3 9 32 41 20:21 I30 0 3 9 32 41 19:22 160 B30 0 4 12 28 40 18:22 I30 0 4 10 30 40 18:22 120 B30 2 4 5 33 38 16:22 I30 1 4 8 31 39 18:21 100 B303672835 17:18 I30 2 4 9 29 38 17:21 80 B3036102535 14:21 I304482836 14:22 60 B3044102636 14:22 I307482533 14:19
Unenhanced Chest CT for Pulmonary Nodule Detection Dose Level by AEC Setting (QRM) Reconstruction Kernel (FBP or IR) # of Readers with Successful Interpretation Successful Interpretations
All Cases Successful Interpretations
Cases with ( n = 19) : Cases without ( n = 25) Essential Lesions 0/3 1/3 2/3 3/3 70 B50 1 3 12 28 40 19:21 I50 1 1 10 32 42 19:23 30 B50 0 3 9 32 41 17:24 I50 1 3 7 33 40 17:23 10 B50 0 4 8 32 40 18:22 I50 1 2 5 36 41 17:24 5 B50 1 2 7 34 41 18:23 I50 1 1 6 36 42 19:23 2.5 B502643236 13:23 I50 2 3 8 31 39 16:23
Unenhanced Spiral Head CT to Detect Intracranial Findings Causing Neurologic Deficit Dose Level by effective mAs Reconstruction Kernel (FBP or IR) # of Readers with Successful I Successful Interpretations
All Cases Successful Interpretations
Cases with ( n = 18) : Cases without ( n = 25) Essential Lesions 0/3 1/3 2/3 3/3 250 H40 (FBP) 0 2 2 39 41 16:25 J40 (IR) 0 1 7 35 42 17:25 200 H40 (FBP) 0 2 4 37 41 17:24 J40 (IR) 0 2 7 34 41 17:24 150 H40 (FBP) 0 1 6 36 42 17:25 J40 (IR) 1 0 4 38 42 17:25 100 H40 (FBP) 0 0 10 33 43 18:25 J40 (IR) 0 2 6 35 41 16:25 50 H40 (FBP) 1 1 9 32 41 17:24 J40 (IR) 0 1 6 36 42 17:25 25 H40 (FBP) 2 3 8 30 38 14:24 J40 (IR) 2 0 11 30 41 16:25
AEC, automatic exposure control setting, which adjusts the modulation of the CT system tube current; FBP, filtered back projection; IR, iterative reconstruction; QRM, quality reference milliampere-second, the AEC setting that will produce the image quality at a similar effective milliampere-second for a hypothetically normal-sized patient.
For positive cases, a majority of readers had to identify all lesions seen by a majority of readers using the routine dose level; for negative cases, the majority of readers made no nonlesion localizations (ie, no false-positive markings). Bold numbers indicate failure to meet preset thresholds for successful dose-reconstruction configurations. The number of cases with essential lesions reflects cases with target lesions identified by two or more readers at routine dose levels.
Get Radiology Tree app to read full this article<
Get Radiology Tree app to read full this article<
Get Radiology Tree app to read full this article<
Get Radiology Tree app to read full this article<
Get Radiology Tree app to read full this article<
Get Radiology Tree app to read full this article<
Discussion
Get Radiology Tree app to read full this article<
Get Radiology Tree app to read full this article<
Get Radiology Tree app to read full this article<
Get Radiology Tree app to read full this article<
Get Radiology Tree app to read full this article<
Get Radiology Tree app to read full this article<
Get Radiology Tree app to read full this article<
Get Radiology Tree app to read full this article<
Get Radiology Tree app to read full this article<
Acknowledgments
Get Radiology Tree app to read full this article<
Supplementary Data
Get Radiology Tree app to read full this article<
Appendix S1
Get Radiology Tree app to read full this article<
Get Radiology Tree app to read full this article<
References
1. Brenner D.J., Hall E.J.: Computed tomography—an increasing source of radiation exposure. N Engl J Med 2007; 357: pp. 2277-2284.
2. McCollough C.H., Bushberg J.T., Fletcher J.G., et. al.: Answers to common questions about the use and safety of CT scans. Mayo Clin Proc 2015; 90: pp. 1380-1392.
3. McCollough C.H., Guimaraes L., Fletcher J.G.: In defense of body CT. AJR Am J Roentgenol 2009; 193: pp. 28-39.
4. Smith-Bindman R., Lipson J., Marcus R., et. al.: Radiation dose associated with common computed tomography examinations and the associated lifetime attributable risk of cancer. Arch Intern Med 2009; 169: pp. 2078-2086.
5. Fletcher J.G., Yu L., Li Z., et. al.: Observer performance in the detection and classification of malignant hepatic nodules and masses with CT image-space denoising and iterative reconstruction. Radiology 2015; 276: pp. 465-478.
6. McCollough C.H., Chen G.H., Kalender W., et. al.: Achieving routine submillisievert CT scanning: report from the summit on management of radiation dose in CT. Radiology 2012; 264: pp. 567-580.
7. Boone J.M., Hendee W.R., McNitt-Gray M.F., et. al.: Radiation exposure from CT scans: how to close our knowledge gaps, monitor and safeguard exposure–proceedings and recommendations of the radiation dose summit, sponsored by NIBIB, February 24–25, 2011. Radiology 2012; 265: pp. 544-554.
8. Mulkens T.H., Bellinck P., Baeyaert M., et. al.: Use of an automatic exposure control mechanism for dose optimization in multi-detector row CT examinations: clinical evaluation. Radiology 2005; 237: pp. 213-223.
9. Yu L., Fletcher J.G., Grant K.L., et. al.: Automatic selection of tube potential for radiation dose reduction in vascular and contrast-enhanced abdominopelvic CT. AJR Am J Roentgenol 2013; 201: pp. W297-W306.
10. Prakash P., Kalra M.K., Kambadakone A.K., et. al.: Reducing abdominal CT radiation dose with adaptive statistical iterative reconstruction technique. Invest Radiol 2010; 45: pp. 202-210.
11. Gandhi N.S., Baker M.E., Goenka A.H., et. al.: Diagnostic accuracy of ct enterography for active inflammatory terminal ileal Crohn disease: comparison of full-dose and half-dose images reconstructed with FBP and half-dose images with SAFIRE. Radiology 2016; 151281:
12. Goenka A.H., Herts B.R., Dong F., et. al.: Image noise, CNR, and detectability of low-contrast, low-attenuation liver lesions in a phantom: effects of radiation exposure, phantom size, integrated circuit detector, and iterative reconstruction. Radiology 2016; 151621:
13. Pickhardt P.J., Lubner M.G., Kim D.H., et. al.: Abdominal CT with model-based iterative reconstruction (MBIR): initial results of a prospective trial comparing ultra-low dose with standard-dose imaging. AJR Am J Roentgenol 2012; 199: pp. 1266-1274.
14. Schindera S.T., Odedra D., Raza S.A., et. al.: Iterative reconstruction algorithm for CT: can radiation dose be decreased while low-contrast detectability is preserved?. Radiology 2013; 269: pp. 511-518.
15. Goenka A.H., Herts B.R., Obuchowski N.A., et. al.: Effect of reduced radiation exposure and iterative reconstruction on detection of low-contrast low-attenuation lesions in an anthropomorphic liver phantom: an 18-reader study. Radiology 2014; 272: pp. 154-163.
16. Johnson C.D., Chen M.H., Toledano A.Y., et. al.: Accuracy of CT colonography for detection of large adenomas and cancers. N Engl J Med 2008; 359: pp. 1207-1217.
17. Aberle D.R., Adams A.M., Berg C.D., et. al.: Reduced lung-cancer mortality with low-dose computed tomographic screening. N Engl J Med 2011; 365: pp. 395-409.
18. Yu L., Shiung M., Jondal D., et. al.: Development and validation of a practical lower-dose-simulation tool for optimizing computed tomography scan protocols. J Comput Assist Tomogr 2012; 36: pp. 477-487.
19. Fletcher J.G., Hara A.K., Fidler J.L., et. al.: Observer performance for adaptive, image-based denoising and filtered back projection compared to scanner-based iterative reconstruction for lower dose CT enterography. Abdom Imaging 2015; 40: pp. 1050-1059.
20. Froemming A.T., Kawashima A., Takahashi N., et. al.: Individualized kV selection and tube current reduction in excretory phase computed tomography urography: potential for radiation dose reduction and the contribution of iterative reconstruction to image quality. J Comput Assist Tomogr 2013; 37: pp. 551-559.
21. Simon R.: Optimal two-stage designs for phase II clinical trials. Control Clin Trials 1989; 10: pp. 1-10.
22. American Association of Physicists in Medicine : Size-Specific Dose Estimates (SSDE) in Pediatric and Adult Body CT Examinations (AAPM Report No. 204). Book Size-Specific Dose Estimates (SSDE) in Pediatric and Adult Body CT Examinations (AAPM Report No. 204). City: Alexandria, Virginia. American Association of Physicists in Medicine2011.
23. American Association of Physicists in Medicine : Use of water-equivalent diameter for calculating patient size and size-specific dose estimates (SSDE) in CT (AAPM Report No. 220). Book Use of water-equivalent diameter for calculating patient size and size-specific dose estimates (SSDE) in CT (AAPM Report No. 220). City: Alexandria, Virginia. American Association of Physicists in Medicine2014.
24. Sagara Y., Hara A.K., Pavlicek W., et. al.: Abdominal CT: comparison of low-dose CT with adaptive statistical iterative reconstruction and routine-dose CT with filtered back projection in 53 patients. AJR Am J Roentgenol 2010; 195: pp. 713-719.
25. Solomon J., Mileto A., Ramirez-Giraldo J.C., et. al.: Diagnostic performance of an advanced modeled iterative reconstruction algorithm for low-contrast detectability with a third-generation dual-source multidetector CT scanner: potential for radiation dose reduction in a multireader study. Radiology 2015; 275: pp. 735-745.
26. Pontana F., Billard A.S., Duhamel A., et. al.: Effect of iterative reconstruction on the detection of systemic sclerosis-related interstitial lung disease: clinical experience in 55 patients. Radiology 2016; 279: pp. 297-305.
27. Komlosi P., Zhang Y., Leiva-Salinas C., et. al.: Adaptive statistical iterative reconstruction reduces patient radiation dose in neuroradiology CT studies. Neuroradiology 2014; 56: pp. 187-193.
28. Aberle D.R., Berg C.D., Black W.C., et. al.: The national lung screening trial: overview and study design. Radiology 2011; 258: pp. 243-253.
29. Kubo T., Ohno Y., Kauczor H.U., et. al.: Radiation dose reduction in chest CT—review of available options. Eur J Radiol 2014; 83: pp. 1953-1961.
30. Christe A., Charimo-Torrente J., Roychoudhury K., et. al.: Accuracy of low-dose computed tomography (CT) for detecting and characterizing the most common CT-patterns of pulmonary disease. Eur J Radiol 2013; 82: pp. e142-e150.
31. Funama Y., Awai K., Liu D., et. al.: Detection of nodules showing ground-glass opacity in the lungs at low-dose multidetector computed tomography: phantom and clinical study. J Comput Assist Tomogr 2009; 33: pp. 49-53.
32. Smith A.B., Dillon W.P., Lau B.C., et. al.: Radiation dose reduction strategy for CT protocols: successful implementation in neuroradiology section. Radiology 2008; 247: pp. 499-506.
33. American Association of Physicists in Medicine : Adult Routine Head CT Protocols (Version 2.0). Available at: www.aapm.org/pubs/CTProtocols/documents/AdultRoutineHeadCT.pdf Accessed: August 26, 2016
34. Wu T.H., Hung S.C., Sun J.Y., et. al.: How far can the radiation dose be lowered in head CT with iterative reconstruction? Analysis of imaging quality and diagnostic accuracy. Eur Radiol 2013; 23: pp. 2612-2621.
35. Korn A., Fenchel M., Bender B., et. al.: Iterative reconstruction in head CT: image quality of routine and low-dose protocols in comparison with standard filtered back-projection. AJNR Am J Neuroradiol 2012; 33: pp. 218-224.
36. Gabriel S., Eckel L.J., DeLone D.R., et. al.: Pilot study of radiation dose reduction for pediatric head CT in evaluation of ventricular size. AJNR Am J Neuroradiol 2014; 35: pp. 2237-2242.
37. Fletcher J.G., Krueger W.R., Hough D.M., et. al.: Pilot study of detection, radiologist confidence and image quality with sinogram-affirmed iterative reconstruction at half-routine dose level. J Comput Assist Tomogr 2013; 37: pp. 203-211.
38. Rubin G.D.: Lung nodule and cancer detection in computed tomography screening. J Thorac Imaging 2015; 30: pp. 130-138.
39. Armato S.G., Roberts R.Y., Kocherginsky M., et. al.: Assessment of radiologist performance in the detection of lung nodules: dependence on the definition of “truth”. Acad Radiol 2009; 16: pp. 28-38.