
Rationale and Objectives
Ischemic penumbra (IP), the target of thrombolytic therapies, could be estimated by the mismatch region between magnetic resonance imaging (MRI) diffusion- and perfusion-defined abnormalities; however, the accuracy of this method has been challenged recently. In this study, we try to establish a method for calculating IP size based on computed tomography perfusion (CTP) and to observe the early evolution of IP in detail.
Materials and Methods
The middle cerebral artery occlusion (MCAO) model in monkey was used to compare the accuracy in estimating the IP between CTP and MRI methods. A receiver operating characteristic (ROC) curve was performed to calculate the IP threshold of the different CTP parameters, and then the best parameter was obtained. The dynamic evolutions of estimated size of IP by these two methods were compared.
Results
Among the three CTP parameters, relative cerebral blood flow (rCBF) had the highest sensitivity (83.3%) and specificity (98.5%) in estimating the IP. The optimal cutoff threshold of rCBF was 0.203. During the first 15 hours of the MCAO model, the estimated size of IP by the rCBF was larger than that of the MRI method; however, this relationship was reversed 15 hours later.
Conclusion
This study suggests that the rCBF method is more accurate in estimating the IP since previous studies have reported that the MRI method underestimated the exact IP in the early stage of ischemia and overestimated the exact IP in the later stages. Further experimental and clinical studies are needed to validate the conclusion.
In the field of ischemic stroke, ischemic penumbra (IP) is an important concept, proposed by Astrup in 1981 . It refers to the regions of brain tissue, usually peripheral in location, where blood flow is sufficiently reduced to cause hypoxia, severe enough to arrest physiological function, but not so complete as to cause irreversible failure of energy metabolism and cellular necrosis . IP is the target for thrombolytic therapy, which remains the only approved therapy for acute ischemic stroke. The existence time of the IP largely varied individually. So accurately estimating the size of IP is one of the important factors for deciding whether the thrombolytic therapy is needed or not, optimizing the therapeutic methods of ischemic stroke, monitoring the evolution of the disease, and assessing the outcome of the therapy.
Positron emission tomography (PET) can combine perfusion and metabolism information, and is regarded as the gold standard in estimating the IP with reduced cerebral blood flow (CBF) but preserved cerebral metabolic rate for oxygen and raised oxygen extraction fraction . However, PET is not suitable for assessing hyperacute and acute infarcts because it is expensive, radioactive, and not available in some clinical settings.
Get Radiology Tree app to read full this article<
Get Radiology Tree app to read full this article<
Get Radiology Tree app to read full this article<
Materials and methods
Animal Model
Get Radiology Tree app to read full this article<
CT and MRI Examination
Get Radiology Tree app to read full this article<
Get Radiology Tree app to read full this article<
Data Analysis
Get Radiology Tree app to read full this article<
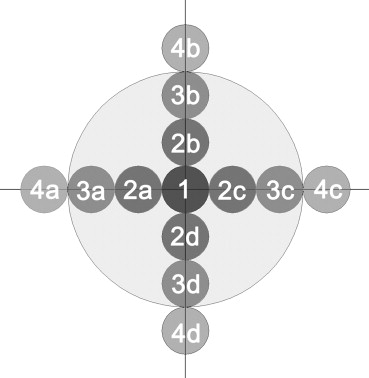
Get Radiology Tree app to read full this article<
Get Radiology Tree app to read full this article<
Statistical Analysis
Get Radiology Tree app to read full this article<
Visualization of IPs
Get Radiology Tree app to read full this article<
Results
Get Radiology Tree app to read full this article<
Differences in CTP Parameters between the Four Series of ROI
Get Radiology Tree app to read full this article<
Differences in CTP parameters between ROIs at different time points
Get Radiology Tree app to read full this article<
Table 1
ANOVA among the CTP Parameters of ROIs 1, 2, and 3 within Infarct Lesions in the Monkey MCAO Model ( P Value)
Time point (hours) rCBF rCBV rMTT PS 1&2 2&3 1&3 1&2 2&3 1&3 1&2 2&3 1&3 1&2 2&3 1&3 1 0.001 ∗ 0.003 ∗ 0.003 ∗ 0.063 0.076 0.008 ∗ 0.069 0.566 0.356 0.356 0.256 0.245 5 0.078 0.001 ∗ 0.005 ∗ 0.111 0.001 ∗ 0.001 ∗ 0.134 0.145 0.346 0.001 ∗ 0.058 0.001 ∗ 10 0.135 0.001 ∗ 0.0003 ∗ 0.456 0.005 ∗ 0.003 ∗ 0.342 0.466 0.234 0.134 0.005 ∗ 0.003 ∗ 15 0.222 0.005 ∗ 0.005 ∗ 0.365 0.005 ∗ 0.001 ∗ 0.125 0.263 0.464 0.235 0.567 0.450 20 0.141 0.002 ∗ 0.001 ∗ 0.654 0.564 0.396 0.268 0.295 0.235 0.432 0.452 0.267 24 0.071 0.321 0.235 0.098 0.287 0.345 0.256 0.007 ∗ 0.005 ∗ 0.535 0.244 0.457
ANOVA, analysis of variance; CTP, computed tomography perfusion; MCAO, middle cerebral artery occlusion; rCBF, relative cerebral blood flow; rCBV, relative cerebral volume; rMTT, relative mean transit time; PS, permeability surface; ROI, region of interest.
Get Radiology Tree app to read full this article<
Get Radiology Tree app to read full this article<
Calculation of IP Thresholds
Get Radiology Tree app to read full this article<
Table 2
ROC Curve Analysis of the CTP Parameters
Parameter Area under the Curve ( x¯ x
¯ ± s )P Threshold Sensitivity Specificity rCBF 0.971 ± 0.015 <.001 0.203 83.3% 98.5% rCBV 0.924 ± 0.028 <.001 0.483 79.2% 86.4% rMTT 0.436 ± 0.066 .352 (—) (—) (—) PS 0.498 ± 0.079 .330 (—) (—) (—)
See Table 1 for abbreviations.
The diagnostic effect would be better if the area under curve was closer to 1.
Get Radiology Tree app to read full this article<
Changes of Sizes of Ischemic Regions on Different Parameter Maps at Different Time Points
Get Radiology Tree app to read full this article<
Table 3
The Ischemic Size Ratios of Imaging Parameters in Monkey MCAO Model ( x¯ x
¯ ± s )
Time point (hours) CBF CBV MTT PS PWI DWI 1 0.648 ± 0.203 0.414 ± 0.105 1.023 ± 0.237 1.121 ± 0.119 0.409 ± 0.039 0.831 ± 0.067 5 0.842 ± 0.153 0.491 ± 0.086 1.095 ± 0.218 1.019 ± 0.208 0.487 ± 0.096 0.918 ± 0.132 10 0.956 ± 0.160 0.722 ± 0.145 1.055 ± 0.223 1.238 ± 0.369 0.731 ± 0.175 0.930 ± 0.123 15 1.096 ± 0.249 0.773 ± 0.147 1.113 ± 0.138 1.209 ± 0.321 0.800 ± 0.179 0.963 ± 0.125 20 1.034 ± 0.198 0.774 ± 0.068 1.155 ± 0.141 1.110 ± 0.178 0.818 ± 0.129 1.016 ± 0.083 24 1.109 ± 0.057 0.830 ± 0.076 1.176 ± 0.080 0.998 ± 0.101 0.805 ± 0.123 0.993 ± 0.032
CBF, cerebral blood flow; CBV, cerebral volume; MTT, mean transit time; PS, permeability surface; PWI, perfusion-weighted imaging; DWI, diffusion-weighted imaging.
The ischemic size ratios of imaging parameters are standardized by the infarct size on T 2 -weighted imaging at 24 hours.
Get Radiology Tree app to read full this article<
Get Radiology Tree app to read full this article<
Evolution of IP Size Estimated by CTP and MRI Methods
Get Radiology Tree app to read full this article<
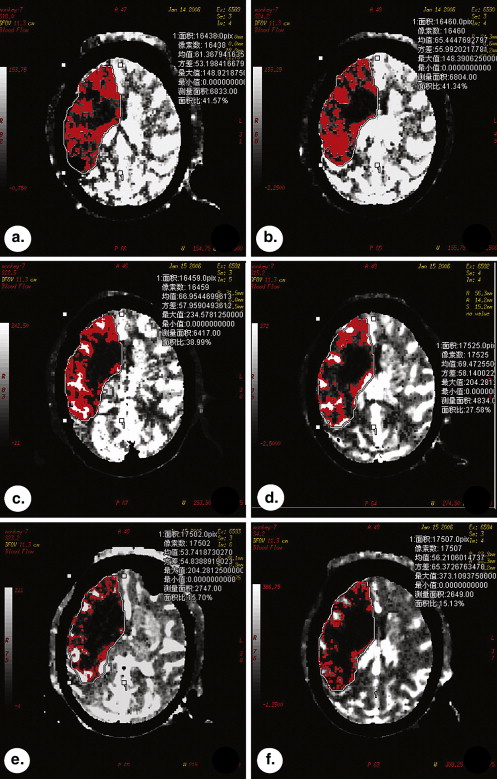
Table 4
IP Size (the Ratio to Infarct Size) in Monkey MCAO Model Calculated by Two Methods
Time points (hours) Method No. 1 No. 2 No. 3 No. 4 No. 5x¯ x
¯ ± s 1 MRI 0.279 0.316 0.206 0.149 0.157 0.221 ± 0.074 CTP 0.286 0.372 0.298 0.257 0.224 0.287 ± 0.055 5 MRI 0.225 0.214 0.183 0.163 0.137 0.184 ± 0.036 CTP 0.267 0.298 0.277 0.24 0.201 0.257 ± 0.037 10 MRI 0.206 0.233 0.181 0.131 0.152 0.181 ± 0.041 CTP 0.253 0.284 0.257 0.231 0.21 0.247 ± 0.028 15 MRI 0.181 0.156 0.169 0.125 0.123 0.151 ± 0.026 CTP 0.216 0.201 0.203 0.175 0.175 0.194 ± 0.018 20 MRI 0.167 0.172 0.168 0.121 0.121 0.150 ± 0.026 CTP 0.147 0.154 0.113 0.098 0.093 0.121 ± 0.028 24 MRI 0.076 0.089 0.124 0.056 0.115 0.092 ± 0.028 CTP 0.051 0.076 0.107 0.068 0.087 0.078 ± 0.021
CTP, computerized tomography perfusion; IP, ischemic penumbra; MCAO, middle cerebral artery occlusion; MRI, magnetic resonance imaging.
MRI method represents perfusion-diffusion mismatch region.
Get Radiology Tree app to read full this article<
Discussion
Get Radiology Tree app to read full this article<
Get Radiology Tree app to read full this article<
Get Radiology Tree app to read full this article<
Get Radiology Tree app to read full this article<
Get Radiology Tree app to read full this article<
Get Radiology Tree app to read full this article<
Get Radiology Tree app to read full this article<
Get Radiology Tree app to read full this article<
Get Radiology Tree app to read full this article<
Acknowledgment
Get Radiology Tree app to read full this article<
Get Radiology Tree app to read full this article<
References
1. Astrup J., Siesjo B.K., Symon L.: Thresholds in cerebral ischemia – the ischemic penumbra. Stroke 1981; 12: pp. 723-725.
2. Hossmann K.A.: Viability thresholds and the penumbra of focal ischemia. Ann Neurol 1994; 36: pp. 557-565.
3. Ginsberg M.D.: Adventures in the pathophysiology of brain ischemia: penumbra, gene expression, neuroprotection: the 2002 Thomas Willis Lecture. Stroke 2003; 34: pp. 214-223.
4. Frykholm P., Anderssonj L.R., Valtyssonj , et. al.: Ametabolic threshold of irreversible ischemia demonstrated by PET in a middle cerebral artery occlusion reperfusion primate model. Acta Eur Scand 2000; 102: pp. 18-26.
5. Takasawa M., Beech J.S., Fryer T.D., et. al.: Imaging of brain hypoxia in permanent and temporary middle cerebral artery occlusion in the rat using 18F-fluoromisonidazole and positron emission tomography: a pilot study. J Cereb Blood Flow Metab 2007; 27: pp. 679-689.
6. Wintermark M., Albers G.W., Alexandrov A.V., et. al.: Acute stroke imaging research roadmap. Stroke 2008; 39: pp. 1621-1628.
7. Akazawa K., Yamada K., Matsushima S., et. al.: Is it possible to define salvageable ischemic penumbra using semiquantitative rCBF levels derived from MR perfusion-weighted imaging?. Neuroradiology 2008; 50: pp. 939-945.
8. Chavez J.C., Zaleska M.M., Wang X., et. al.: Multimodal magnetic resonance imaging for assessing evolution of ischemic penumbra: a key translational medicine strategy to manage the risk of developing novel therapies for acute ischemic stroke. J Cerebral Blood Flow Metab 2009; 29: pp. 217-219.
9. Desmond P.M., Lovell A.C., Rawlinson A.A., et. al.: The value of apparent diffusion coefficient maps in early cerebral ischemia. AJNR Am J Neuroradiol 2001; 22: pp. 1260-1267.
10. Liu K.F., Li F., Tatlisumak T., et. al.: Regional variations in the apparent diffusion coefficient and the intracellular distribution of water in rat brain during acute focal ischemia. Stroke 2001; 32: pp. 1897-1905.
11. Rosso C., Hevia-Montiel N., Deltour S., et. al.: Prediction of infarct growth based on apparent diffusion coefficients: penumbral assessment without intravenous contrast material. Radiology 2009; 250: pp. 184-192.
12. Loh P.S., Butcher K.S., Parsons M.W., et. al.: Apparent diffusion coefficient thresholds do not predict the response to acute stroke thrombolysis. Stroke 2005; 36: pp. 2626-2631.
13. Lansberg M.G., Thijs V.N., Bammer R., et. al.: The MRA-DWI mismatch identifies patients with stroke who are likely to benefit from reperfusion. Stroke 2008; 39: pp. 2491-2496.
14. Schlaug G., Benfield A., Baird A.E., et. al.: The ischemic penumbra: operationally defined by diffusion and perfusion MRI. Neurology 1999; 53: pp. 1528-1537.
15. Muir K.W., Baird-Gunning J., Walker L., et. al.: Can the ischemic penumbra be identified on noncontrast CT of acute stroke?. Stroke 2007; 38: pp. 2485-2490.
16. Parsons M.W., Pepper E.M., Bateman G.A., et. al.: Identification of the penumbra and infarct core on hyperacute noncontrast and perfusion CT. Neurology 2007; 68: pp. 730-736.
17. Soares B.P., Dankbaar J.W., Bredno J., et. al.: Automated versus manual post-processing of perfusion-CT data in patients with acute cerebral ischemia: influence on interobserver variability. Neuroradiology 2009; 51: pp. 445-451.
18. Tan J.C., Dillon W.P., Liu S., et. al.: Systematic comparison of perfusion-CT and CT-angiography in acute stroke patients. Ann Neurol 2007; 61: pp. 533-543.
19. Wintermark M., Flanders A.E., Velthuis B., et. al.: Perfusion-CT assessment of infarct core and penumbra: receiver operating characteristic curve analysis in 130 patients suspected of acute hemispheric stroke. Stroke 2006; 37: pp. 979-985.
20. Hakim A.M.: Ischemic penumbra—the therapeutic window. Neurology 1998; 51: pp. S44-S46.
21. Warach S., Latour L.L.: Evidence of reperfusion injury, exacerbated by thrombolytic therapy, in human focal brain ischemia using a novel imaging marker of early blood-brain barrier disruption. Stroke 2004; 11: pp. 2659-2661.
22. Ebinger M., De Silva D.A., Christensen S., et. al.: Imaging the penumbra – strategies to detect tissue at risk after ischemic stroke. J Clin Neurosci 2009; 16: pp. 178-187.
23. Hacke W., Kaste M., Bluhmki E., et. al.: Thrombolysis with alteplase 3 to 4.5 hours after acute ischemic stroke. N Engl J Med 2008; 359: pp. 1317-1329.
24. Kidwell C.S., Alger J.R., Saver J.L.: Evolving paradigms in neuroimaging of the ischemic penumbra. Stroke 2004; 35: pp. 2662-2665.
25. Darby D.G., Barber P.A., Gerraty R.P., et. al.: Pathophysiological topography of acute ischemia by combined diffusion-weighted and perfusion MRI. Stroke 1999; 30: pp. 2043-2052.
26. Moore-Olufemi S.D., Kozar R.A., Moore F.A., et. al.: Ischemia preconditioning protects against gut dysfunction and mucosal injury after ischemia/reperfusion injury. Shock 2005; 23: pp. 258-263.
27. Lee Y.Z., Lee J.M., Vo K., et. al.: Rapid perfusion abnormality estimation in acute stroke with temporal correlation analysis. Stroke 2003; 34: pp. 1686-1692.
28. Barber P.A., Davis S.M., Darb D.G., et. al.: Absent middle cerebral artery flow predicts the presence and evolution of the ischemic penumbra. Neurology 1999; 52: pp. 1125-1132.
29. Rohl L., Ostergaard L., Simonsen C.Z., et. al.: Viability thresholds of ischemic penumbra of hyperacute stroke defined by perfusion-weighted MRI and apparent diffusion coefficient. Stroke 2001; 32: pp. 1140-1146.
30. Aviv R.I., d’Esterre C.D., Murphy B.D., et. al.: Hemorrhagic transformation of ischemic stroke: prediction with CT perfusion. Radiology 2009; 250: pp. 867-877.
31. Huynh T.J., Murphy B., Pettersen J.A., et. al.: CT perfusion quantification of small-vessel ischemic severity. AJNR Am J Neuroradiol 2008; 29: pp. 1831-1836.
32. Bisdas S., Hartel M., Cheong L.H., et. al.: Prediction of subsequent hemorrhage in acute ischemic stroke using permeability CT imaging and a distributed parameter tracer kinetic model. J Neuroradiol 2007; 34: pp. 101-108.
33. Heiss W.D.: Ischemic penumbra: evidence from functional imaging in man. J Cereb Blood Flow Metab 2000; 20: pp. 1276-1293.
34. Wintermark M., Fischbein N.J., Smith W.S., et. al.: Accuracy of dynamic perfusion CT with deconvolution in detecting acute hemispheric stroke. AJNR Am J Neuroradiol 2005; 26: pp. 104-112.
35. Schaefer P., Ozsunar Y., He J., et. al.: Assessing tissue viability with MR diffusion and perfusion imaging. AJNR Am J Neuroradiol 2003; 24: pp. 436-443.