
Rationale and Objectives
To investigate the accuracy and precision of pulmonary nodule size measurements on chest tomosynthesis images.
Materials and Methods
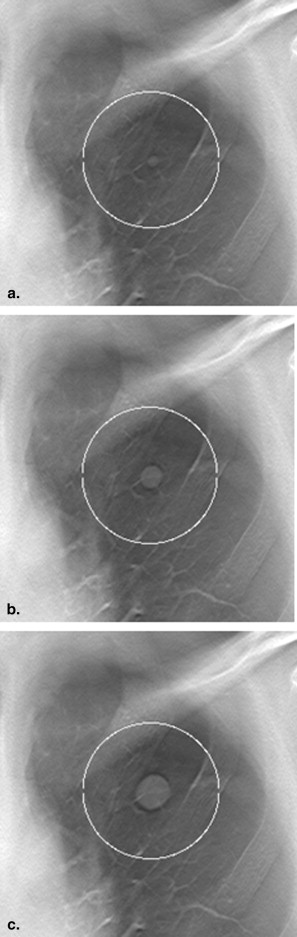
Artificial ellipsoid-shaped nodules with known sizes were inserted in clinical chest tomosynthesis images. The volume of the nodules corresponded to that of a sphere with a diameter of 4.0, 8.0, or 12.0 mm. Four thoracic radiologists were given the task to determine the longest diameter of the nodules. All nodules were measured twice. Measurement accuracy in terms of the mean measurement error was determined. Intraobserver and interobserver variabilities, as well as variability because of differences between nodules and their locations, were used as measures of precision.
Results
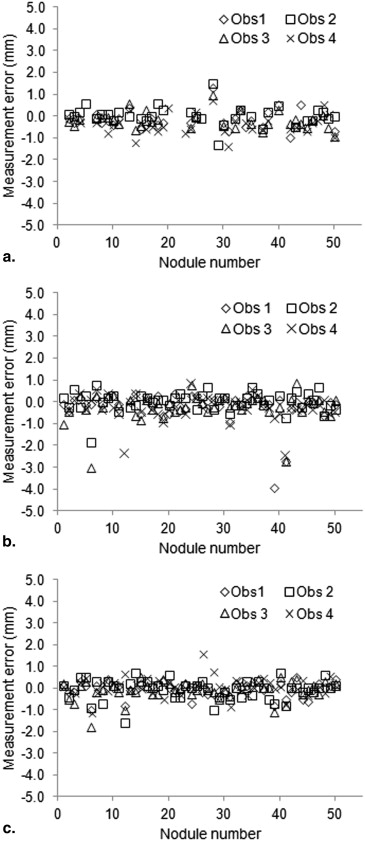
The mean measurement error ranged from −0.3 to 0.1 mm for the nodule size groups and observers. Of the smallest nodules, the observers found 7–17 of total 50 nodules nonmeasurable. The intraobserver and interobserver variabilities were of similar magnitude, indicating relatively small differences between the observers. The internodule variability was in general larger, indicating that the different characteristics of the nodules and their location are sources of variability.
Conclusions
The results suggest a high accuracy and precision for manual measurements of the nodules in chest tomosynthesis images. However, small nodules (<5.0 mm) may be difficult to measure at all because of poor visibility.
Pulmonary nodules are common incidental findings from chest and cardiac computed tomography (CT) examinations . As indicators of malignancy for these lesions, nodule size and growth are important factors . The Fleischner society has proposed a generally accepted management strategy for the follow-up of indeterminate nodules, which is based on repeated CT examinations at certain time intervals, depending on the size of the nodule when it is detected . If a significant size increase in the nodule over time is detected in the images, further diagnostic investigations are initiated. Similar recommendations can be found in the Response Evaluation Criteria In Solid Tumors (RECIST) guidelines concerning the evaluation of treatment response for tumors and metastases . The noninvasive nature of the technique and the high conspicuity of lesions in the images make CT scanning a suitable choice for follow-up. However, repeated CT scans raise concerns regarding the patient radiation dose burden .
Chest tomosynthesis has relatively recently emerged as an interesting alternative modality in lung imaging . The technique allows imaging of the chest in section images at a radiation dose substantially lower than in the case with chest CT . The financial cost for a chest tomosynthesis examination is also, in general, lower than that for a chest CT examination. Additionally, patient throughput is higher for the chest tomosynthesis examinations . Although the depth resolution of chest tomosynthesis is limited compared to CT, previous studies have shown that a relatively large amount of pulmonary nodules visible on CT images are detectable on chest tomosynthesis images . Furthermore, and of even higher importance for the present study, in the study by Vikgren et al. all nodules with a longest diameter larger than 6 mm confirmed on CT were deemed visible in retrospect by tomosynthesis. This indicates the potential of using tomosynthesis for follow-up of already detected nodules.
Get Radiology Tree app to read full this article<
Materials and methods
Image Collection
Get Radiology Tree app to read full this article<
Get Radiology Tree app to read full this article<
Nodule Simulation
Get Radiology Tree app to read full this article<
Nodule Insertion
Get Radiology Tree app to read full this article<
Get Radiology Tree app to read full this article<
Get Radiology Tree app to read full this article<
Get Radiology Tree app to read full this article<
Get Radiology Tree app to read full this article<
Measurement Study
Get Radiology Tree app to read full this article<
Get Radiology Tree app to read full this article<
Get Radiology Tree app to read full this article<
Get Radiology Tree app to read full this article<
Get Radiology Tree app to read full this article<
Data Analysis
Get Radiology Tree app to read full this article<
Get Radiology Tree app to read full this article<
Results
Get Radiology Tree app to read full this article<
Get Radiology Tree app to read full this article<
Table 1
Number of Nodules Judged as Nonmeasurable, Mean Measurement Error, and Mean Relative Measurement Error for Each Observer for the Three Different Size Groups
Parameter Observer 1 Observer 2 Observer 3 Observer 4 4.0 mm N nonmeasurable 15 16 17 7 Mean error (mm) −0.2 (−0.3, 0.0) 0.0 (−0.1, 0.2) −0.2 (−0.3, 0.0) −0.3 (−0.5, −0.2) Mean relative error (%) −3.3 (−6.5, 0.0) 0.5 (−2.7, 3.7) −3.3 (−6.2, −0.5) −7.2 (−10.4, −4.0) 8.0 mm N nonmeasurable 1 3 2 — Mean error (mm) −0.2 (−0.4, 0.0) 0.1 (−0.1, 0.2) −0.2 (−0.4, 0.0) −0.2 (−0.4, 0.0) Mean relative error (%) −1.8 (−3.9, 0.2) 0.6 (−0.8, 2.0) −2.3 (−4.4, −0.1) −2.0 (−3.8, −0.2) 12.0 mm N nonmeasurable — — — — Mean error (mm) −0.1 (−0.2, 0.0) −0.1 (−0.2, 0.1) −0.1 (−0.2, 0.0) 0.1 (0.0, 0.2) Mean relative error (%) −0.5 (−1.2, 0.1) −0.5 (−1.4, 0.5) −0.7 (−1.6, 0.2) 0.6 (−0.2, 1.5)
Data in parentheses are 95% confidence intervals.
Get Radiology Tree app to read full this article<
Get Radiology Tree app to read full this article<
Get Radiology Tree app to read full this article<
Get Radiology Tree app to read full this article<
Get Radiology Tree app to read full this article<
Get Radiology Tree app to read full this article<
Table 2
Intraobserver Variability Expressed as the Standard Deviation of the Two Measurements on Each Nodule, Both in Absolute Terms and Relative to the Actual Size of the Nodules, Averaged Over all Nodules in Each Size Group for Each Observer
Parameter Observer 1 Observer 2 Observer 3 Observer 4 4.0 mm Intraobserver variability (mm) 0.2 (0.1, 0.2) 0.4 (0.3, 0.5) 0.2 (0.2, 0.3) 0.3 (0.2, 0.4) Intraobserver variability (%) 3.6 (2.3, 5.0) 7.7 (5.4, 9.9) 5.3 (3.5, 7.1) 6.1 (4.4, 7.8) Intraclass correlation coefficient 0.92 (0.83, 0.96) 0.71 (0.32, 0.87) 0.83 (0.57, 0.93) 0.81 (0.62, 0.90) 8.0 mm Intraobserver variability (mm) 0.2 (0.1, 0.3) 0.3 (0.2, 0.3) 0.2 (0.2, 0.3) 0.3 (0.2, 0.4) Intraobserver variability (%) 2.0 (1.4, 2.7) 2.8 (2.1, 3.4) 2.4 (1.7, 3.1) 3.0 (2.3, 3.8) Intraclass correlation coefficient 0.94 (0.89, 0.97) 0.91 (0.84, 0.95) 0.95 (0.90, 0.97) 0.92 (0.86, 0.96) 12.0 mm Intraobserver variability (mm) 0.2 (0.1, 0.2) 0.3 (0.3, 0.4) 0.2 (0.2, 0.3) 0.4 (0.2, 0.5) Intraobserver variability (%) 1.1 (0.9, 1.4) 2.4 (1.9, 2.9) 1.5 (1.1, 1.8) 2.7 (1.7, 3.7) Intraclass correlation coefficient 0.99 (0.98, 0.99) 0.94 (0.89, 0.96) 0.98 (0.96, 0.99) 0.87 (0.78, 0.93)
Data in parentheses are 95% confidence intervals.
Table 3
Interobserver Variability Expressed as the Standard Deviation of the Measurements, Both in Absolute Terms and Relative to the Actual Size of the Nodules, by all Observers on Each Nodule, Averaged Over all Nodules in Each Size Group
Parameter 4 mm 8 mm 12 mm Interobserver variability (mm) 0.2 (0.2, 0.3) 0.3 (0.2, 0.4) 0.3 (0.2, 0.4) Interobserver variability (%) 5.3 (4.1, 6.5) 3.3 (2.4, 4.2) 2.1 (1.7, 2.5) Intraclass correlation coefficient 0.91 (0.82, 0.96) 0.93 (0.88, 0.96) 0.97 (0.96, 0.98)
Data in parentheses are 95% confidence intervals.
Table 4
Internodule Variability, Expressed as the Standard Deviation of the Measurement Error, Both in Absolute Terms and Relative to the Actual Size of the Nodule, for all Nodules in Each Size Group for Each Observer
Parameter Observer 1 Observer 2 Observer 3 Observer 4 4.0 mm Internodule variability (mm) 0.4 (0.3, 0.5) 0.4 (0.3, 0.6) 0.4 (0.3, 0.5) 0.5 (0.4, 0.6) Internodule variability (%) 9.0 (7.2, 11.9) 9.0 (7.2, 11.9) 7.9 (6.3, 10.5) 9.5 (7.8, 12.4) 8.0 mm Internodule variability (mm) 0.7 (0.6, 0.9) 0.4 (0.4, 0.6) 0.7 (0.6, 0.8) 0.6 (0.5, 0.7) Internodule variability (%) 7.2 (6.0, 9.0) 4.8 (4.0, 6.0) 7.2 (6.0, 9.1) 6.2 (5.2, 7.8) 12.0 mm Internodule variability (mm) 0.3 (0.3, 0.4) 0.5 (0.4, 0.6) 0.4 (0.4, 0.5) 0.4 (0.4, 0.5) Internodule variability (%) 2.3 (1.9, 2.9) 3.3 (2.7, 4.1) 3.1 (2.6, 3.9) 3.0 (2.5, 3.7)
Data in parentheses are 95% confidence intervals.
Get Radiology Tree app to read full this article<
Discussion
Get Radiology Tree app to read full this article<
Get Radiology Tree app to read full this article<
Get Radiology Tree app to read full this article<
Get Radiology Tree app to read full this article<
Get Radiology Tree app to read full this article<
Get Radiology Tree app to read full this article<
Get Radiology Tree app to read full this article<
Get Radiology Tree app to read full this article<
Get Radiology Tree app to read full this article<
Get Radiology Tree app to read full this article<
Get Radiology Tree app to read full this article<
Get Radiology Tree app to read full this article<
Get Radiology Tree app to read full this article<
References
1. Burt J.R., Iribarren C., Fair J.M., et. al.: Incidental findings on cardiac multidetector row computed tomography among healthy older adults: prevalence and clinical correlates. Arch Intern Med 2008; 168: pp. 756-761.
2. Hall W.B., Truitt S.G., Scheunemann L.P., et. al.: The prevalence of clinically relevant incidental findings on chest computed tomographic angiograms ordered to diagnose pulmonary embolism. Arch Intern Med 2009; 169: pp. 1961-1965.
3. Hasegawa M., Sone S., Takashima S., et. al.: Growth rate of small lung cancers detected on mass CT screening. Br J Radiol 2000; 73: pp. 1252-1259.
4. Henschke C.I., Yankelevitz D.F., Naidich D.P., et. al.: CT screening for lung cancer: suspiciousness of nodules according to size on baseline scans. Radiology 2004; 231: pp. 164-168.
5. MacMahon H., Austin J.H., Gamsu G., et. al.: Guidelines for management of small pulmonary nodules detected on CT scans: a statement from the Fleischner Society. Radiology 2005; 237: pp. 395-400.
6. Eisenhauer E.A., Therasse P., Bogaerts J., et. al.: New response evaluation criteria in solid tumours: revised RECIST guideline (version 1.1). Eur J Cancer 2009; 45: pp. 228-247.
7. Brenner D.J., Hall E.J.: Computed tomography—an increasing source of radiation exposure. N Engl J Med 2007; 357: pp. 2277-2284.
8. Dobbins J.T., McAdams H.P.: Chest tomosynthesis: technical principles and clinical update. Eur J Radiol 2009; 72: pp. 244-251.
9. Johnsson Å.A., Vikgren J., Svalkvist A., et. al.: Overview of two years of clinical experience of chest tomosynthesis at Sahlgrenska University Hospital. Radiat Prot Dosimetry 2010; 139: pp. 124-129.
10. Quaia E., Baratella E., Cioffi V., et. al.: The value of digital tomosynthesis in the diagnosis of suspected pulmonary lesions on chest radiography: analysis of diagnostic accuracy and confidence. Acad Radiol 2010; 17: pp. 1267-1274.
11. Johnsson Å.A., Vikgren J., Båth M.: Chest tomosynthesis: technical and clinical perspectives. Semin Respir Crit Care Med 2014; 35: pp. 17-26.
12. Sabol J.M.: A Monte Carlo estimation of effective dose in chest tomosynthesis. Med Phys 2009; 36: pp. 5480-5487.
13. Båth M., Svalkvist A., von Wrangel A., et. al.: Effective dose to patients from chest examinations with tomosynthesis. Radiat Prot Dosimetry 2010; 139: pp. 153-158.
14. Dobbins T.J., McAdams H.P., Song J.W., et. al.: Digital tomosynthesis of the chest for lung nodule detection: interim sensitivity results from an ongoing NIH-sponsored trial. Med Phys 2008; 35: pp. 2554-2557.
15. Vikgren J., Zachrisson S., Svalkvist A., et. al.: Comparison of chest tomosynthesis and chest radiography for detection of pulmonary nodules: human observer study of clinical cases. Radiology 2008; 249: pp. 1034-1041.
16. Zachrisson S., Vikgren J., Svalkvist A., et. al.: Effect of clinical experience of chest tomosynthesis on detection of pulmonary nodules. Acta Radiol 2009; 50: pp. 884-891.
17. Asplund S., Johnsson Å.A., Vikgren J., et. al.: Learning aspects and potential pitfalls regarding detection of pulmonary nodules in chest tomosynthesis and proposed related quality criteria. Acta Radiol 2011; 52: pp. 503-512.
18. Johnsson Å.A., Svalkvist A., Vikgren J., et. al.: A phantom study of nodule size evaluation with chest tomosynthesis and computed tomography. Radiat Prot Dosimetry 2010; 139: pp. 140-143.
19. Johnsson Å.A., Fagman E., Vikgren J., et. al.: Pulmonary nodule size evaluation with chest tomosynthesis. Radiology 2012; 265: pp. 273-282.
20. Svalkvist A., Johnsson Å.A., Vikgren J., et. al.: Evaluation of an improved method of simulating lung nodules in chest tomosynthesis. Acta Radiol 2012; 53: pp. 874-884.
21. Båth M., Söderman C., Svalkvist A.: A simple method to retrospectively estimate patient dose-area product for chest tomosynthesis examinations performed using VolumeRAD. Med Phys 2014; 41: pp. 101905.
22. Svalkvist A., Håkansson M., Ullman G., et. al.: Simulation of lung nodules in chest tomosynthesis. Radiat Prot Dosimetry 2010; 139: pp. 130-139.
23. Börjesson S., Håkansson M., Båth M., et. al.: A software tool for increased efficiency in observer performance studies in radiology. Radiat Prot Dosimetry 2005; 114: pp. 45-52.
24. Håkansson M., Svensson S., Zachrisson S., et. al.: ViewDEX: an efficient and easy-to-use software for observer performance studies. Radiat Prot Dosimetry 2010; 139: pp. 42-51.
25. Bolch B.W.: More on unbiased estimation of the standard deviation. Am Stat 1968; 22: pp. 27.
26. Harris K.M., Adams H., Lloyd D.C., et. al.: The effect on apparent size of simulated pulmonary nodules of using three standard CT window settings. Clin Radiol 1993; 47: pp. 241-244.
27. Asplund S.A., Johnsson Å.A., Vikgren J., et. al.: Effect of radiation dose level on the detectability of pulmonary nodules in chest tomosynthesis. Eur Radiol 2014; 24: pp. 1529-1536.