
Rationale and Objectives
Higher resolution medical imaging platforms are rapidly emerging, but there is a challenge in applying these tools in a clinically meaningful way. The purpose of the current study was to evaluate a novel three-dimensional (3D) software imaging environment, known as interactive science publishing (ISP), in appraising 3D computed tomography images and to compare this approach with traditional planar (2D) imaging in a series of lung cancer cases.
Materials and Methods
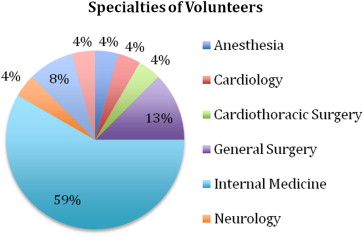
Twenty-four physician volunteers at different levels of training across multiple specialties were recruited to evaluate eight lung cancer–related clinical vignettes. The volunteers were asked to compare the performance of traditional 2D versus the ISP 3D imaging in assessing different visualization environments for diagnostic and measurement processes and to further evaluate the ISP tool in terms of general satisfaction, usability, and probable applicability.
Results
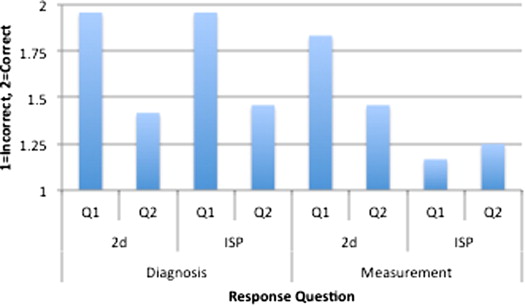
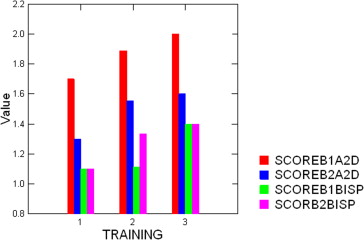
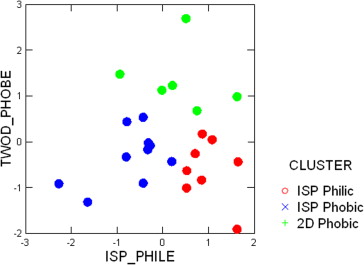
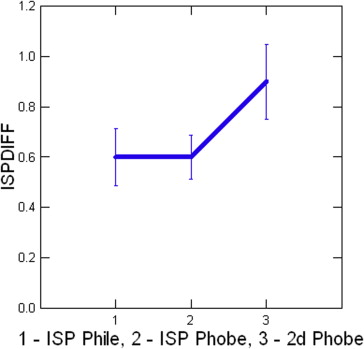
Volunteers were satisfied with both imaging methods; however, the 3D environment had significantly higher ratings. Measurement performance was comparable using both traditional 2D and 3D image evaluation. Physicians not trained in 2D measurement approaches versus those with such training demonstrated better performance with ISP and preferred working in the ISP environment.
Conclusions
Recent postgraduates with only modest self-administered training performed equally well on 3D and 2D cases. This suggests that the 3D environment has no reduction in accuracy over the conventional 2D approach, while providing the advantage of a digital environment for cross-disciplinary interaction for shared problem solving. Exploration of more effective, efficient, self-directed training could potentially result in further improvement in image evaluation proficiency and potentially decrease training costs.
Over the past decade, medical imaging has undergone exponential improvements; however, the ability to use the detailed, textured outputs of these tools requires an understanding of how to manipulate digital imaging data to ensure correct interpretation in guiding clinical management . This area of image processing is thought to be the province of radiologists, but ongoing trends suggest a greater inclusion of many medical disciplines in applying high-resolution imaging in clinical management. Yet the foundational knowledge of proper application of quantitative imaging tools in medical curriculum has not yet emerged as a major focus.
Although the technological evolution of medical imaging is moving rapidly, the integration of this new and vast source of digital data into meaningful clinical application is slow. This integration mismatch relates to a number of issues, including pressure to accelerate standard workflow and the inertial influence of shrinking reimbursement. However, the greatest current barrier to implementing image processing approaches may be that clinicians have not been educated about the potential of quantitative imaging. Thus, a knowledge gap exists in how best to apply robust imaging techniques to change the practice of medicine.
Get Radiology Tree app to read full this article<
Get Radiology Tree app to read full this article<
Get Radiology Tree app to read full this article<
Materials and methods
Get Radiology Tree app to read full this article<
Quantitative Evaluation Vignettes
Get Radiology Tree app to read full this article<
Process Evaluation
Get Radiology Tree app to read full this article<
Statistical Analysis
Get Radiology Tree app to read full this article<
Get Radiology Tree app to read full this article<
Results
Get Radiology Tree app to read full this article<
Get Radiology Tree app to read full this article<
Quantitative Evaluation of Clinical Vignettes
Get Radiology Tree app to read full this article<
Get Radiology Tree app to read full this article<
Get Radiology Tree app to read full this article<
Get Radiology Tree app to read full this article<
Get Radiology Tree app to read full this article<
Table 1
Applicant Questionnaire
Question Mean Standard Deviation 1. The Interactive Science Publishing (ISP) represents a major step forward in providing a setting to interact with visual clinical information. 3.67 0.8165 2. I am satisfied with ISP information system as a source of information, data, and analysis for my work or research. 3.71 0.7506 3. I am satisfied with traditional electronic journal style information as a source of information, data, and analysis for my clinical practice. 3.46 0.7790 4. I am satisfied with ISP information system as a source of information, data, and analysis for my research reading. 3.79 0.7211 5. I am satisfied with traditional electronic journal style information as a source of information, data, and analysis for my research reading. 3.58 0.8805 6. I am satisfied with the visualization tools for interacting with the clinical images provided by the ISP information system. 3.63 1.0135 7. I am satisfied with the visualization tools for interacting with clinical images provided by traditional electronic journals. 3.46 0.8836 8. If available I would make use of the ISP technology in preference to the traditional technology. 3.67 0.8681 9. I understand the application of the image processing tools available in the ISP to quantify aspects of the clinical image. 3.42 1.0598 10. I am satisfied with the computer interface provided to support the ISP. 3.79 0.8836 11. The directions and training on the interactive Science Publishing (ISP) are easy to understand. 3.75 1.0734 12. The interactive Science Publishing instrument is easy to use. 3.79 1.0206 13. Using the ISP instrument I am more confident of my clinical judgment. 3.17 0.8165 14. The ISP will prove useful in my patient care or research activities. 3.46 0.9771 15. The ISP will prove useful in my research projects. 3.25 0.7940
Get Radiology Tree app to read full this article<
Combined Analysis
Get Radiology Tree app to read full this article<
Get Radiology Tree app to read full this article<
Get Radiology Tree app to read full this article<
Get Radiology Tree app to read full this article<
Get Radiology Tree app to read full this article<
Get Radiology Tree app to read full this article<
Get Radiology Tree app to read full this article<
Get Radiology Tree app to read full this article<
Discussion
Get Radiology Tree app to read full this article<
Get Radiology Tree app to read full this article<
Get Radiology Tree app to read full this article<
Get Radiology Tree app to read full this article<
Get Radiology Tree app to read full this article<
Get Radiology Tree app to read full this article<
Get Radiology Tree app to read full this article<
Get Radiology Tree app to read full this article<
Get Radiology Tree app to read full this article<
Get Radiology Tree app to read full this article<
Acknowledgment
Get Radiology Tree app to read full this article<
References
1. Mulshine J.L., Avila R., Yankelevitz D., et. al.: Use of high resolution CT imaging data in lung cancer drug development: measuring progress. Oncology 2009; 23: pp. 434-438.
2. Buckler A.J., Mulshine J.L., Gottlieb R., et. al.: The use of volumetric CT as an imaging biomarker in lung cancer. Acad Radiol 2010; 17: pp. 100-106.
3. Eisenhauer E.A., Therasse P., Bogaerts J., et. al.: New response evaluation criteria in solid tumours: revised RECIST guideline (version 1.1). Eur J Cancer 2009; 45: pp. 228-247.
4. Mulshine J.L., Baer T.M., Avila R.S.: Introduction: imaging in diagnosis and treatment of lung cancer. Opt Express 2010; 18: pp. 15242-15243.
5. Aberle D.R., Adams A.M., Berg C.D., et. al.: Reduced lung-cancer mortality with low-dose computed tomographic screening. N Engl J Med 2011; 365: pp. 395-409.
6. Mulshine J.L., Jablons D.M.: Volume CT for diagnostics work-up in a randomized lung cancer screening trial: learning from Nelson. N Engl J Med 2009; 361: pp. 2221-2229.
7. Yankelevitz D.F., Reeves A.P., Kostis W.J., et. al.: Small pulmonary nodules: volumetrically determined growth rates based on CT evaluation. Radiology 2000; 217: pp. 251-256.
8. Gavrielides M.A., Kinnard L.M., Myers K.J., et. al.: Noncalcified lung nodules: volumetric assessment with thoracic CT. Radiology 2009; 251: pp. 26-37.
9. Zhao B., Oxnard G.R., Moskowitz C.S., et. al.: A pilot study of volume measurement as a method of tumor response evaluation to aid biomarker development. Clin Cancer Res 2010; 16: pp. 4647-4653.
10. Revel M., Lefort C., Bissery A., et. al.: Pulmonary nodules: preliminary experience with three-dimensional evaluation. Radiology 2004; 231: pp. 459-466.
11. Krishnan K., Ibanez L., Turner W.D., et. al.: An open-source toolkit for the volumetric measurement of CT lung lesions. Optics Express 2010; 18: pp. 15256-15266.
12. Boland R.J., Lyytinen K., Yoo Y.: Wakes of innovation in project networks: the case of digital 3-D representations in architecture, engineering, and construction. Organization Science 2007; 18: pp. 631-647.
13. Young A.M., Koester S.J.: 3D process technology considerations.Xie Y.Cong J.Sapatnekar S.Three-dimensional integrated circuit design, integrated circuits and systems.2010.Springer LLCNew York, NY:
14. Labelle H., Aubin C.E., Jackson R., et. al.: Seeing the spine in 3D: how will it change what we do?. J Pediatr Orthop 2011; 31: pp. S37-S45.
15. Miao Q., Yu J., Rahn J.R., et. al.: Dual-mode optical projection tomography microscope using gold nanorods and hematoxylin-stained cancer cells. Opt Lett 2010; 35: pp. 1037-1039.
16. Sharp P.A., Langer R.: Promoting convergence in biomedical science. Science 2011; 333: pp. 527.