
Rationale and Objectives
The aims of this study were to investigate image noise (standard deviation of computed tomographic value) and to assess variability in repeated coronary artery calcium (CAC) scoring on prospective electrocardiographically triggered 64-detctor computed tomography.
Materials and Methods
Patients ( n = 428) suspected of having coronary artery disease were scanned twice using three protocols: with tube current modified by body mass index (BMI; group A), by BMI and body height (group B), and by attenuation at the maximal heart diameter (group C). Image noise was plotted against BMI. Interscan variability of CAC scores was determined. The effective dose was estimated by computed tomographic dose index.
Results
The mean effective dose and image noise, respectively, were 0.9 ± 0.2 mSv (range, 0.6–1.5 mSv) and 19 ± 4 Hounsfield units (HU) (range, 10–32 HU) for group A; 0.8 ± 0.2 mSv (range, 0.5–1.4 mSv) and 18 ± 4 HU (range, 10–31 HU) for group B; and 0.8 ± 0.4 mSv (range, 0.3–2.2 mSv) and 20 ± 2 HU (range, 16–26 HU) for group C. Group C used a wide dose range and controlled noise within a small range. The positive slopes of image noise versus BMI, 0.81 HU/(kg/m 2 ) in group A and 0.62 HU/(kg/m 2 ) in group B, suggested insufficient control of the tube current. In contrast, the nearly flat slope in group C, 0.091 HU/(kg/m 2 ), indicated optimal control. The interscan variability for Agatston score, volume, and mass in patients with CAC ( n = 300) was 13% (median, 8%), 12% (median, 7%), and 11% (median, 6%), respectively.
Conclusions
CAC scoring on prospective electrocardiographically triggered 64-detector computed tomography using attenuation-based tube current control has the potential to favorably control image noise with low dose and low interscan variability.
The validity of serial coronary calcium measurements as a method to monitor the progression of atherosclerosis requires that the progression of coronary artery calcium (CAC) have biologic relevance to atherosclerosis activity, the progression of CAC can be detected relative to intertest variability, changes in CAC severity have prognostic relevance, and the modification of cardiovascular risk factors modulate the progression of CAC . Therefore, regarding the technical aspects of CAC scoring, low radiation exposure and low interscan variability are key requirements.
To reduce radiation exposure, a fixed and lower tube current–time product of 40 mAs or 55 mAs and body weight–adapted or body mass index (BMI)–adapted protocols have been introduced, but these do not account for the body habitus of patients, such as the size of heart or the presence of pericardial effusion. In a recent report of the International Consortium on Standardization in Cardiac Computed Tomography, a standard deviation (SD) level target of 20 Hounsfield units (HU) for small and medium-sized patients and an SD level target of 23 HU for large patients have been recommended . Mühlenbruch et al reported automated attenuation-based tube current adaptation whereby the tube current was chosen from a proprietary control curve calculated on the basis of the attenuation values derived from the scanogram. Their study showed that automated attenuation-based tube current adaptation can better control tube current than a fixed “standard” dose protocol, but their regression analysis revealed a statistically significant influence of patient BMI on image noise.
Get Radiology Tree app to read full this article<
Materials and methods
Patients
Get Radiology Tree app to read full this article<
Prospective Electrocardiographically Triggered Step-and-Shoot CT Protocol
Get Radiology Tree app to read full this article<
Group A: Tube Current Modified by BMI
Get Radiology Tree app to read full this article<
tube current=250×(BMI/25)mA=10×body weight(kg)/[body height(m)]2mA. tube current
=
250
×
(
BMI
/
25
)
mA
=
10
×
body weight
(
kg
)
/
[
body height
(
m
)
]
2
mA
.
This was based on the strategy that patients with standard BMIs of 25 kg/m 2 would receive tube current–time product of 58 mAs, which is almost the same level as the recommendation for CAC scoring using low-dose 4-slice CT imaging .
Get Radiology Tree app to read full this article<
Get Radiology Tree app to read full this article<
tube current(mA)×gantry rotation speed(seconds)×exposure time per rotation time=250mA×0.35seconds×(2/3)=58mAs. tube current
(
mA
)
×
gantry rotation speed
(
seconds
)
×
exposure time per rotation time
=
250
mA
×
0.35
seconds
×
(
2
/
3
)
=
58
mAs
.
Get Radiology Tree app to read full this article<
Group B: Tube Current Modified by BMI and Body Height
Get Radiology Tree app to read full this article<
tube current=250×(BMI/25)mA×(body height/1.7)mA=5.88×body weight(kg)/body height(m)mA. tube current
=
250
×
(
BMI
/
25
)
mA
×
(
body height
/
1.7
)
mA
=
5.88
×
body weight
(
kg
)
/
body height
(
m
)
mA
.
Get Radiology Tree app to read full this article<
Group C: Attenuation-Based Tube Current Adaptation at the Maximal Heart Diameter
Get Radiology Tree app to read full this article<
tube current=recommended tube current×(3/2)×(0.4/0.35)mA=recommended tube current×1.71mA. tube current
=
recommended tube current
×
(
3
/
2
)
×
(
0.4
/
0.35
)
mA
=
recommended tube current
×
1.71
mA
.
Get Radiology Tree app to read full this article<
Image Noise
Get Radiology Tree app to read full this article<
Get Radiology Tree app to read full this article<
Calcium Scoring
Get Radiology Tree app to read full this article<
Get Radiology Tree app to read full this article<
Interscan and Interobserver Variability
Get Radiology Tree app to read full this article<
interscan variability=[absolute(scan1−scan2)/(scan1+scan2)×0.5]×100, interscan variability
=
[
absolute
(
scan
1
−
scan
2
)
/
(
scan
1
+
scan
2
)
×
0.5
]
×
100
,
and
interobserver variability=[absolute(observer1−observer2)/(observer1+observer2)×0.5]×100, interobserver variability
=
[
absolute
(
observer
1
−
observer
2
)
/
(
observer
1
+
observer
2
)
×
0.5
]
×
100
,
where observer 1 and observer 2 are the CAC scores measured by the respective observers. Interscan variability, on a logarithmic scale, was compared among the three groups and CAC-scoring algorithms.
Get Radiology Tree app to read full this article<
Radiation Dose
Get Radiology Tree app to read full this article<
Statistical Analyses
Get Radiology Tree app to read full this article<
Results
Get Radiology Tree app to read full this article<
Table 1
Patient Demographics
Variable All Patients Group A Group B Group C_P_ No. of patients 428 145 145 138 .48 ‡ Women/women 167/261 52/93 60/85 55/83 .43 † Age (y) 65 ± 12 (28–89) 64 ± 12 (34–87) 65 ± 13 (28–89) 66 ± 11 (31–85) .52 ‡ Prevalence of CAC 300/428 (70%) 100/145 (67%) 100/145 (67%) 100/138 (72%) .27 † BMI (kg/m 2 ) 24 ± 13 (16–45) 24 ± 3 (18–34) 24 ± 4 (16–40) 24 ± 3 (16–32) .95 ‡ Symptoms 334/428 (78%) 115/145 (79%) 109/145 (75%) 110/138 (80%) .06 ‡ Risk factors 268/428 (63%) 80/145 (55%) 97/145 (67%) 91/138 (66%) .47 † HR (beats/min) ∗ 61 ± 11 (38–111) 62 ± 10 (40–87) 62 ± 11 (39–107) 60 ± 12 (38–111) .44 † HRV (beats/min) ∗ 5 ± 12 (0–102) 4 ± 10 (0–76) 6 ± 12 (0–75) 4 ± 14 (0–102) .48 ‡
BMI, body mass index; CAC, coronary artery calcium; HR, heart rate; HRV, heart rate variation.
Categorical variables are expressed as frequency (percentage) and quantitative variables as mean ± standard deviation (range).
Get Radiology Tree app to read full this article<
Get Radiology Tree app to read full this article<
Get Radiology Tree app to read full this article<
Get Radiology Tree app to read full this article<
Image Noise
Get Radiology Tree app to read full this article<
Table 2
Image Noise in the Ascending Aorta and Right Ventricle
Variable All Patients Group A Group B Group C No. of patients 428 145 145 138 SD (HU) Ascending aorta 17 ± 7 (11–30) 16 ± 3 (11–27) 17 ± 3 (11–30) 17 ± 2 (12–24) Right ventricle 19 ± 4 (10–32) 19 ± 4 (10–32) 18 ± 4 (10–31) 20 ± 2 (16–26) Mean + 2 SDs (HU) Ascending aorta 75 ± 9 (53–109) 75 ± 10 (53–99) 75 ± 10 (53–109) 76 ± 7 (57–100)
HU, Hounsfield units; SD, standard deviation.
Data are expressed as mean ± SD (range).
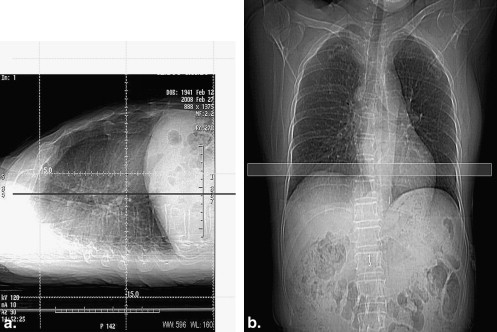
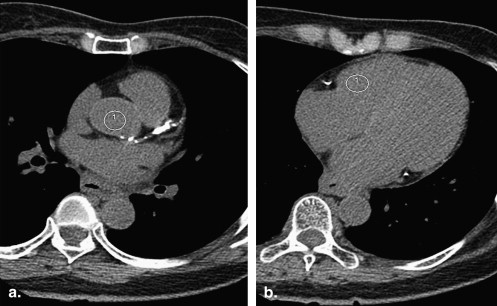
![Figure 3, The highest standard deviation images in the three groups. Images with the highest noise in the three groups are shown. (a) An image of a 57-year-old woman (body mass index [BMI], 34.1 kg/m 2 ; body height, 155 cm) below the diaphragm level (SD = 32 Hounsfield units [HU]). (b) An image of a 57-year-old man (BMI, 27.1 kg/m 2 ; body height, 165 cm) was sacrificed to streaking artifact from spinal spur (SD = 31 HU). (c) An image of an 80-year-old man (BMI, 26.8 kg/m 2 ; body height, 164 cm) below the diaphragm shows pleural and pericardial effusion (SD = 26 HU).](https://storage.googleapis.com/dl.dentistrykey.com/clinical/EvaluationofAttenuationBasedTubeCurrentControlinCoronaryArteryCalciumScoringonProspectiveECGtriggered64detectorCT/2_1s20S1076633209002621.jpg)
Get Radiology Tree app to read full this article<
Get Radiology Tree app to read full this article<
Get Radiology Tree app to read full this article<
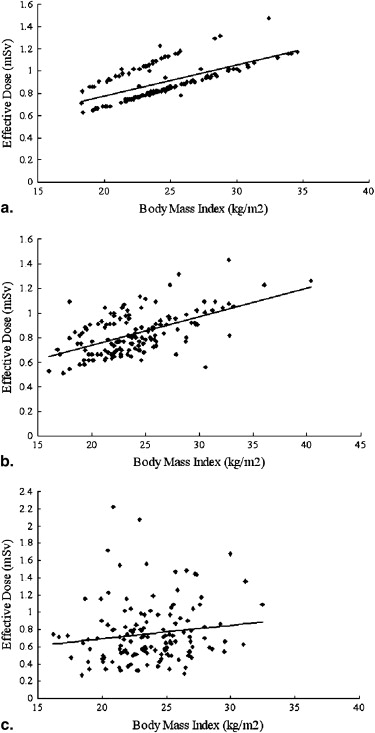
![Figure 4, The relationship between standard deviation (SD) and body mass index (BMI). Scatterplots show the ratio between BMI (kg/m 2 ) and SD (Hounsfield units [HU]). (a) Group A, in the aorta: SD = 0.51 (95% confidence interval [CI], 0.40–0.62) × BMI + 4 ( P < .01). (b) Group A, in the right ventricle: SD = 0.81 (95% CI, 0.64–0.97) × BMI − 1 ( P < .01). (c) Group B, in the aorta: SD = 0.43 (95% CI, 0.33–0.53) × BMI + 6 ( P < .01). (d) Group B, in the right ventricle: SD = 0.62 (95% CI, 0.48–0.76) × BMI + 4 ( P < .01). (e) Group C, in the aorta: SD = 0.041 (95% CI, −0.069 to 0.15) × BMI + 16 (P = .46). (f) Group C, in the right ventricle: SD = 0.091 (95% CI, −0.013 to 0.20) × BMI + 18 ( P = .09). The positive slopes of image noise versus BMI, 0.51 and 0.81 HU/(kg/m 2 ) in group A and 0.43 and 0.62 HU/(kg/m 2 ) in group B, suggest insufficient control of the tube current. In contrast, the nearly flat slopes of 0.041 and 0.091 HU/(kg/m 2 ) in group C indicate optimal control of tube current across patients.](https://storage.googleapis.com/dl.dentistrykey.com/clinical/EvaluationofAttenuationBasedTubeCurrentControlinCoronaryArteryCalciumScoringonProspectiveECGtriggered64detectorCT/3_1s20S1076633209002621.jpg)
Get Radiology Tree app to read full this article<
CAC Scores and Interscan and Interobserver Variability
Get Radiology Tree app to read full this article<
Table 3
Coronary Artery Calcium Scores and Interscan and Interobserver Variability
Variable All Patients Group A Group B Group C No. of patients 300 100 100 100 Agatston score Scan 1 Observer 1 175 (48, 648) 206 (46, 664) 167 (42, 464) 152 (48, 775) Observer 2 185 (48, 648) 206 (48, 668) 174 (42, 488) 157 (48, 789) Scan 2 Observer 1 179 (43, 610) 201 (46, 638) 171 (42, 444) 148 (39, 797) Observer 2 176 (45, 611) 204 (46, 638) 176 (42, 462) 148 (39, 803) Volume score Scan 1 Observer 1 150 (43, 515) 165 (38, 548) 138 (39, 367) 125 (44, 639) Observer 2 149 (43, 528) 166 (40, 552) 146 (37, 392) 129 (44, 622) Scan 2 Observer 1 144 (41, 502) 176 (39, 502) 144 (35, 356) 122 (41, 665) Observer 2 146 (41, 502) 176 (40, 502) 146 (36, 366) 121 (41, 668) Calcium mass Scan 1 Observer 1 33 (8, 127) 37 (8, 130) 30 (7, 93) 28 (8, 139) Observer 2 33 (8, 130) 37 (8, 132) 30 (7, 93) 28 (8, 139) Scan 2 Observer 1 32 (8, 123) 37 (8, 131) 30 (7, 89) 25 (7, 153) Observer 2 32 (8, 123) 37 (8, 131) 30 (6, 91) 26 (7, 149) Interscan variability (%) Agatston Observer 1 13, 8 (3, 17) 13, 7 (2, 15) 12, 6 (2, 15) 14, 10 (4, 18) Observer 2 13, 8 (3, 17) 13, 7 (3, 16) 13, 6 (2, 16) 14, 10 (3, 20) Volume Observer 1 12, 7 (3, 16) 12, 6 (3, 16) 11, 6 (2, 15) 11, 8 (3, 15) Observer 2 11, 6 (3, 16) 11, 6 (2, 15) 10, 6 (2, 15) 12, 8 (3, 17) Mass Observer 1 11, 6 (2, 14) 10, 4 (2, 14) 10, 5 (2, 11) 12, 8 (2, 14) Observer 2 11, 6 (2, 14) 10, 4 (2, 14) 12, 5 (2, 11) 11, 8 (2, 14) Interobserver variability (%) Agatston Scan 1 4, 1 (0, 3) 3, 1 (0, 4) 5, 0 (0, 3) 3, 0 (0, 2) Scan 2 3, 0 (0, 3) 5, 0 (0, 3) 4, 0 (0, 2) 2, 1 (0, 1) Volume Scan 1 2, 0 (0, 2) 3, 0 (0, 3) 3, 0 (0, 1) 1, 0 (0, 0) Scan 2 2, 0 (0, 2) 3, 0 (0, 2) 4, 0 (0, 2) 1, 0 (0, 3) Mass Scan 1 3, 1 (0, 1) 3, 0 (0, 2) 4, 0 (0, 2) 1, 0 (0, 1) Scan 2 3, 0 (0, 1) 3, 0 (0, 2) 4, 0 (0, 1) 2, 0 (0, 1)
Coronary artery calcium is expressed as median (25th, 75th percentiles). Variability is expressed as mean, median (25th, 75th percentiles).
Get Radiology Tree app to read full this article<
Get Radiology Tree app to read full this article<
Get Radiology Tree app to read full this article<
Radiation Dose
Get Radiology Tree app to read full this article<
Table 4
Tube Current, Tube Current–Time Product, and Radiation Dose
Variable All Patients Group A Group B Group C_P_ Tube current (mA) 227 ± 65 (75–610) 245 ± 36 (180–350) 227 ± 43 (150–370) 209 ± 94 (75–610) <.01 ∗ Tube current–time product (mAs) 53 ± 15 (18–142) 57 ± 8 (42–56) 53 ± 10 (35–86) 49 ± 25 (18–142) <.01 ∗ Dose0length product (mGy · cm) 49 ± 15 (16–131) 53 ± 8 (37–87) 49 ± 10 (30–84) 44 ± 21 (16–131) <.01 ∗ Estimate effective dose (mSv) 0.8 ± 0.3 (0.3–2.2) 0.9 ± 0.2 (0.6–1.5) 0.8 ± 0.2 (0.5–1.4) 0.8 ± 0.4 (0.3–2.2) <.01 ∗
Data are expressed as mean ± standard deviation (range).
Get Radiology Tree app to read full this article<
Get Radiology Tree app to read full this article<
Discussion
Get Radiology Tree app to read full this article<
Image Noise
Get Radiology Tree app to read full this article<
Interscan and Interobserver Variability in CAC Scoring
Get Radiology Tree app to read full this article<
Radiation Dose
Get Radiology Tree app to read full this article<
Get Radiology Tree app to read full this article<
Get Radiology Tree app to read full this article<
Get Radiology Tree app to read full this article<
Get Radiology Tree app to read full this article<
References
1. Greenland P., Bonow R.O., Brundage B.H., et. al.: ACCF/AHA 2007 clinical expert consensus document on coronary artery calcium scoring by computed tomography in global cardiovascular risk assessment and in evaluation of patients with chest pain. J Am Coll Cardiol 2007; 49: pp. 378-402.
2. Takahashi N., Bae K.T.: Quantification of coronary artery calcium with multi-detector row CT: assessing interscan variability with different tube currents-pilot study. Radiology 2003; 228: pp. 101-106.
3. Shemesh J., Evron R., Koren-Morag N., et. al.: Coronary artery calcium measurement with multi-detector row CT and low radiation dose: comparison between 55 and 165 mAs. Radiology 2005; 236: pp. 810-814.
4. Mahnken A.H., Wildberger J.E., Simon J., et. al.: Detection of coronary calcifications: feasibility of dose reduction with a body weight-adapted examination protocol. AJR Am J Roentgenol 2003; 181: pp. 533-538.
5. Jung B., Mahnken A.H., Stargardt A., et. al.: Individually weight-adapted examination protocol in retrospectively ECG-gated MSCT of the heart. Eur Radiol 2003; 13: pp. 2560-2566.
6. Horiguchi J., Yamamoto H., Hirai N., et. al.: Variability of repeated coronary artery calcium measurements on low-dose ECG-gated 16-MDCT. AJR Am J Roentgenol 2006; 187: pp. W1-W6.
7. Sevrukov A., Pratap A., Doss C., Jelnin V., Hoff J.A., Kondos G.T.: Electron beam tomography imaging of coronary calcium: the effect of body mass index on radiologic noise. J Comput Assist Tomogr 2002; 26: pp. 592-597.
8. Horiguchi J., Matsuura N., Yamamoto H., et. al.: Coronary artery calcium scoring on low-dose prospective electrocardiograph-triggered 64-slice CT. Acad Radiol 2009; 16: pp. 187-193.
9. McCollough C.H., Ulzheimer S., Halliburton S.S., et. al.: Coronary artery calcium: a multiinstitutional, multimanufacturer international standard for quantification at cardiac CT. Radiology 2007; 243: pp. 527-538.
10. Mühlenbruch G., Hohl C., Das M., et. al.: Evaluation of automated attenuation-based tube current adaptation for coronary calcium scoring in MDCT in a cohort of 262 patients. Eur Radiol 2007; 17: pp. 1850-1857.
11. Horiguchi J., Shen Y., Hirai N., et. al.: Timing on 16-slice scanner and implications for 64-slice cardiac CT: do you start scanning immediately after breath-hold?. Acad Radiol 2006; 13: pp. 173-176.
12. Matsuura N., Horiguchi J., Yamamoto H., et. al.: Optimal cardiac phase for coronary artery calcium scoring on single-source 0.35 sec-rotation-speed 64-MDCT scanner—least interscan variability and least motion artifacts. AJR Am J Roentgenol 2008; 190: pp. 1561-1568.
13. Agatston A.S., Janowitz W.R., Hildner F.J., Zusmer N.R., Viamonte M., Detrano R.: Quantification of coronary calcium using ultrafast computed tomography. J Am Coll Cardiol 1990; 15: pp. 827-832.
14. Yoon H.C., Greaser L.E., Mather R., Sinha S., McNitt-Gray M.F., Goldin J.G.: Coronary artery calcium: alternate methods for accurate and reproducible quantitation. Acad Radiol 1997; 4: pp. 666-673.
15. Halliburton S.S., Stillman A.E., Lieber M., Kasper J.M., Kuzmiak S.A., White R.D.: Potential clinical impact of variability in the measurement of coronary artery calcification with sequential MDCT. AJR Am J Roentgenol 2005; 184: pp. 643-648.
16. Menzel H., Schibilla H., Teunen D.: European guidelines for quality criteria for computed tomography.2000.European CommissionBrussels, Belgium
17. Achenbach S., Ropers D., Mohlenkamp S., et. al.: Variability of repeated coronary artery calcium measurements by electron beam tomography. Am J Cardiol 2001; 87: pp. 210-213.
18. Bielak L.F., Kaufmann R.B., Moll P.P., MacCollough C.H., Schwartz R.S., Sheedy P.F.: Small lesions in the heart identified at electron beam CT: calcification or noise?. Radiology 1994; 192: pp. 631-636.
19. Callister T.Q., Cooil B., Raya S.P., et. al.: Coronary artery disease: improved reproducibility of calcium scoring with an electron-beam CT volumetric method. Radiology 1998; 208: pp. 807-814.
20. Wang S.J., Detrano B.C., Secci A., et. al.: Detection of coronary calcification with electron-beam computed tomography: evaluation of interexamination reproducibility and comparison of three image-acquisition protocols. Am Heart J 1996; 132: pp. 550-558.
21. Ohnesorge B., Flohr T., Fischbach R., et. al.: Reproducibility of coronary calcium quantification in repeat examinations with retrospectively ECG-gated multisection spiral CT. Eur Radiol 2002; 12: pp. 1532-1540.
22. Horiguchi J., Yamamoto H., Akiyama Y., et. al.: Variability of repeated coronary artery calcium measurements by 16-MDCT with retrospective reconstruction. AJR Am J Roentgenol 2005; 184: pp. 1917-1923.
23. Horiguchi J., Matsuura N., Yamamoto H., et. al.: Variability of repeated coronary artery calcium measurements by 1.25-mm- and 2.5-mm-thickness images on prospective electrocardiograph-triggered 64-slice CT. Eur Radiol 2008; 18: pp. 209-216.
24. Morin R.L., Gerber T.C., McCollough C.H.: Radiation dose in computed tomography of the heart. Circulation 2003; 107: pp. 917-922.
25. Thomas C.K., Mühlenbruch G., Wildberger J.E., et. al.: Coronary artery calcium scoring with multislice computed tomography. in vitro assessment of a low tube voltage protocol. Invest Radiol 2006; 41: pp. 668-673.
26. Jakobs T.F., Wintersperger B.J., Herzog P., et. al.: Ultra-low-dose coronary artery calcium screening using multislice CT with retrospective ECG gating. Eur Radiol 2003; 13: pp. 1923-1930.
27. Vliegenthart R., Song B., Hofman A., Witteman J.C.M., Oudkerk M.: Coronary calcification at electron-beam CT: effect of section thickness on calcium scoring in vitro and in vivo Radiology 2003; 229: pp. 520-525.