
Rationale and Objectives
The objective of this study was to assess whether changes to radiographic parameters before and after treatment with antiangiogenic drugs would improve performance in predicting tumor response with non–contrast-enhanced computed tomography (NCECT) compared to Response Evaluation Criteria in Solid Tumors (RECIST).
Material and Methods
The exploration sample group and the validation sample group consisted of 58 and 25 patients, respectively, who had pulmonary metastatic renal cell carcinoma and were receiving antiangiogenic drugs. All patients underwent NCECT scans at baseline and at first evaluation (after two cycles of treatment) with the same scan protocol. Tumor diameter, attenuation value, entropy, and uniformity of the exploration sample group were examined by receiver operating characteristic (ROC) analysis and stepwise discriminant analysis. The threshold value derived from ROC analysis and discriminant function of the exploration sample group were also used for the validation sample group and were compared to RECIST using Kaplan–Meier survival curves.
Results
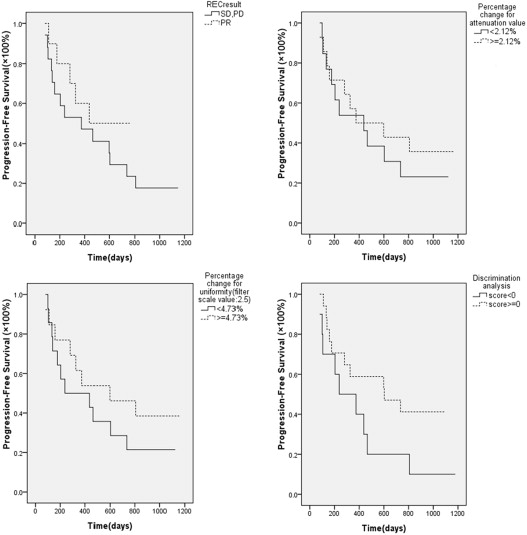
According to the model obtained from the exploration group, Kaplan–Meier curves for patients without disease progression were significantly different for the discriminant analysis of the validation sample group ( P = .04) and better than individually using RECIST ( P = .08), percentage change for attenuation value ( P = .49), entropy ( P = .47, .89, .72, .73, and .58), and uniformity ( P = .53, .72, .51, .39, and .16; without filtration, at scale values of 1.0, 1.5, 2.0, and 2.5, respectively).
Conclusions
Combined with changes to imaging parameters, including size, attenuation value, and uniformity between pre- and post-treatment, discrimination analysis can help predict biologic response to antiangiogenic drugs and provide a more accurate response assessment than RECIST criteria.
Renal cell carcinoma (RCC) is one of the most common cancers within the group of urogenital neoplasms . Approximately 30% of all other patients will develop metastases at a later stage of their disease. RCC is a tumor with high vascularization, and antiangiogenic drugs, including sorafenib, sunitinib, and axitinib, have demonstrated significant efficacy against metastatic RCC (mRCC) in clinical trials . Accurate evaluation is important when assessing response to therapy. Response Evaluation Criteria in Solid Tumours (RECIST), which is based on evaluation of tumor size, is the most wildly used classified method . However, recent studies have shown the inadequacy of RECIST for assessing therapeutic response in patients with mRCC who have received antiangiogenic-targeted therapy . Therefore, biomarkers other than size are needed for a better assessment of therapeutic response.
The application of imaging parameters including computed tomography (CT) texture for monitoring antiangiogenic efficacy has been reported in a recent study and been shown to be capable of depicting and monitoring tumor angiogenesis in patients, for which intravenous iodinated contrast is appropriate. However, renal impairment may preclude the use of intravenous iodinated contrast material in patients with renal disease . To the best of our knowledge, the use of imaging parameters including attenuation value, entropy, and uniformity of tumor for monitoring antiangiogenic efficacy in mRCC patients using non–contrast-enhanced CT (NCECT) has not been thoroughly explored. The objective of this study was to assess whether these imaging parameters will improve assessment of tumor response with NCECT instead of RECIST.
Material and methods
Get Radiology Tree app to read full this article<
Get Radiology Tree app to read full this article<
Get Radiology Tree app to read full this article<
CT Imaging
Get Radiology Tree app to read full this article<
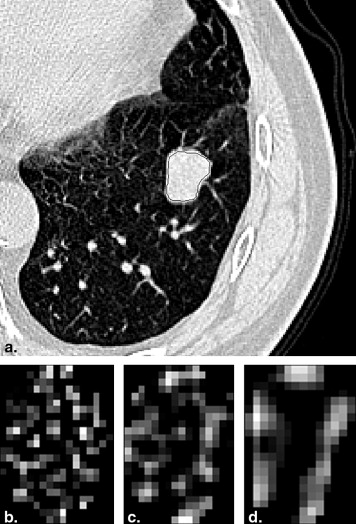
Image Analysis
Get Radiology Tree app to read full this article<
entropy=∑ni=1(−pi)[log(pi)]anduniformity=∑ni=1[log(pi)]2 entropy
=
∑
i
=
1
n
(
−
p
i
)
[
log
(
p
i
)
]
and
uniformity
=
∑
i
=
1
n
[
log
(
p
i
)
]
2
where i is the pixel value in the ROI ( i = 1 to n, where n is the highest pixel value) and p__i is the probability of the occurrence of that pixel value. Higher entropy and lower uniformity represent increased heterogeneity . The scale was selected by tuning the filter parameters between 1.0 and 2.5, where 1.0 indicates fine texture (features 4 pixels in width), 1.5 and 2.0 indicate medium textures (features 6 and 10 pixels in width, respectively), and 2.5 indicates coarse texture (features 12 pixels in width).
Get Radiology Tree app to read full this article<
Statistical Evaluation
Get Radiology Tree app to read full this article<
Results
Get Radiology Tree app to read full this article<
Table 1
Patient Demographics and Clinical Data
Characteristic Exploration Sample Validation Sample Number of patients 58 25 Gender Male 32 11 Female 26 14 Age Mean (range) 62 (42–78) 60 (44–71) Antiangiogenic-targeted therapy (number of patients) Sunitinib 41 12 Sorafenib 17 13
Table 2
Parameter Value and Percentage Change for Parameter of Patients at Baseline and After Two Treatment Cycles
Parameter Exploration Sample Validation Sample PFS <1 year PFS ≧1 year PFS <1 year PFS ≧ 1 year Size Bsl/AT (mm) 61.63 ± 5.73/69.58 ± 7.26 57.63 ± 9.87/58.22 ± 7.45 54.63 ± 2.74/59.83 ± 3.91 56.63 ± 5.75/55.45 ± 3.27 Change (%) 21.63 ± 38.11 1.31 ± 32.63 13.18 ± 33.67 −1.17 ± 22.63 AV Bsl/AT (HU) 21.63 ± 1.47/22.49 ± 2.11 17.61 ± 0.95/17.77 ± 2.14 23.64 ± 1.09/25.03 ± 2.12 22.63 ± 2.68/22.81 ± 3.31 Change (%) 4.72 ± 19.55 1.39 ± 21.32 6.14 ± 18.19 2.41 ± 25.64 Entropy, filter scale value N Bsl/AT 5.26 ± 0.17/5.13 ± 0.31 5.96 ± 0.54/5.97 ± 0.99 6.16 ± 0.47/5.97 ± 0.61 5.85 ± 0.29/5.85 ± 0.45 Change (%) −2.47 ± 7.54 0.15 ± 4.35 −3.14 ± 5.47 −0.41 ± 6.61 1.0 Bsl/AT 5.14 ± 0.54/4.88 ± 0.59 5.24 ± 0.58/5.04 ± 0.34 6.37 ± 0.49/6.15 ± 0.42 5.52 ± 0.45/5.32 ± 0.51 Change (%) −5.16 ± 13.16 −3.42 ± 11.49 −3.52 ± 11.93 −3.43 ± 12.75 1.5 Bsl/AT 4.45 ± 0.42/4.15 ± 0.56 3.98 ± 0.61/3.51 ± 0.52 5.47 ± 0.48/5.08 ± 0.59 3.72 ± 0.63/3.45 ± 0.62 Change (%) −8.78 ± 19.91 −11.27 ± 22.15 −6.01 ± 19.14 −6.86 ± 21.26 2.0 Bsl/AT 3.33 ± 0.69/2.81 ± 0.51 3.26 ± 0.48/2.84 ± 0.59 3.88 ± 0.45/3.53 ± 0.53 3.28 ± 0.77/2.99 ± 0.83 Change (%) −12.72 ± 29.46 −13.81 ± 31.08 −8.29 ± 28.47 −7.99 ± 29.62 2.5 Bsl/AT 2.39 ± 0.61/2.29 ± 0.70 2.58 ± 0.54/2.36 ± 0.41 3.14 ± 0.55/2.96 ± 0.63 2.67 ± 0.74/2.47 ± 0.86 Change (%) −4.02 ± 33.41 −8.72 ± 30.93 −7.27 ± 27.64 −8.12 ± 30.09 Uniformity, filter scale value N Bsl/AT 0.006 ± 0.001/0.007 ± 0.002 0.008 ± 0.001/0.010 ± 0.001 0.003 ± 0.001/0.004 ± 0.001 0.007 ± 0.001/0.008 ± 0.002 Change (%) 19.06 ± 26.47 17.68 ± 25.29 17.49 ± 28.25 15.41 ± 25.78 1.0 Bsl/AT 0.007 ± 0.002/0.008 ± 0.002 0.006 ± 0.001/0.007 ± 0.001 0.002 ± 0.000/0.004 ± 0.001 0.005 ± 0.001/0.006 ± 0.001 Change (%) 11.07 ± 22.94 13.75 ± 23.23 16.14 ± 18.26 17.41 ± 19.64 1.5 Bsl/AT 0.014 ± 0.003/0.016 ± 0.002 0.016 ± 0.002/0.018 ± 0.003 0.009 ± 0.001/0.011 ± 0.002 0.016 ± 0.001/0.017 ± 0.003 Change (%) 9.37 ± 21.09 9.74 ± 20.21 8.99 ± 17.62 9.16 ± 15.64 2.0 Bsl/AT 0.035 ± 0.014/0.037 ± 0.013 0.045 ± 0.009/0.049 ± 0.011 0.032 ± 0.005/0.033 ± 0.005 0.058 ± 0.007/0.061 ± 0.011 Change (%) 6.24 ± 19.11 9.85 ± 16.82 4.75 ± 11.74 5.37 ± 11.56 2.5 Bsl/AT 0.088 ± 0.007/0.090 ± 0.016 0.103 ± 0.008/0.114 ± 0.013 0.063 ± 0.007/0.064 ± 0.009 0.069 ± 0.021/0.077 ± 0.018 Change (%) 1.41 ± 17.26 8.72 ± 12.99 2.36 ± 11.33 5.95 ± 9.46
AT, after two treatment cycle; AV, attenuation value; Bsl, baseline; HU, Hounsfield units; N, without filtration.
Get Radiology Tree app to read full this article<
Get Radiology Tree app to read full this article<
Discriminantscore=1.6×x+1.4×y−0.8×z+0.199 Discriminant
score
=
1.6
×
x
+
1.4
×
y
−
0.8
×
z
+
0.199
where x is the change of size, y is the change of attenuation value, and z is the change of uniformity with a filter scale value of 2.5. When the discriminant score is ≧0, it predicts that the patient will have a good response to therapy, whereas scores <0 predict a poor response.
Table 3
Evaluation of Response to Therapy
Method Exploration Sample Validation Sample ROC Threshold_P_ Value_P_ Value RECIST Not applicable .17 .21 AV Bsl/AT (HU) ≦18.14/≦19.27 .32/.29 .87/.83 Change (%) ≦2.12 .42 .49 Entropy, filter scale value N Bsl/AT ≧5.32/≧5.24 .27/.25 .43/.64 Change (%) ≧−1.16 .48 .47 1.0 Bsl/AT ≧5.19/≧4.93 .33/.39 .67/.63 Change (%) ≧−3.99 .52 .89 1.5 Bsl/AT ≦4.11/≦3.89 .65/.49 .87/.85 Change (%) ≦−9.77 .42 .72 2.0 Bsl/AT ≦3.29/≧2.83 .72/.88 .80/.93 Change (%) ≧−1.16 .74 .73 2.5 Bsl/AT ≧2.43/≧2.31 .27/.61 .57/.74 Change (%) ≦−5.63 .35 .58 Uniformity, filter scale value N Bsl/AT ≧0.007/≧0.009 .82/.59 .72/.92 Change (%) ≦18.11 .27 .53 1.0 Bsl/AT ≦0.007/≦0.008 .68/.74 .90/.97 Change (%) ≧13.12 .23 .72 1.5 Bsl/AT ≧0.016/≧0.017 .45/.42 .89/.85 Change (%) ≧9.62 .38 .51 2.0 Bsl/AT ≧0.041/≧0.043 .11/.07 .61/.79 Change (%) ≧6.98 .19 .39 2.5 Bsl/AT ≧0.095/≧0.102 .21/.176 .74/.81 Change (%) ≧4.73 .13 .16 Discriminant score Not applicable .02 .04
AT, after two treatment cycle; AV, attenuation value; Bsl, baseline; HU, Hounsfield units; RECIST, Response Evaluation Criteria in Solid Tumors; N, without filtration.
P values were obtained with Kaplan–Meier analysis.
Get Radiology Tree app to read full this article<
Get Radiology Tree app to read full this article<
Get Radiology Tree app to read full this article<
Discussion
Get Radiology Tree app to read full this article<
Get Radiology Tree app to read full this article<
Get Radiology Tree app to read full this article<
Get Radiology Tree app to read full this article<
Get Radiology Tree app to read full this article<
Get Radiology Tree app to read full this article<
Get Radiology Tree app to read full this article<
References
1. Jemal A., Murray T., Samuels A., et. al.: Cancer statistics. CA Cancer J Clin 2003; 53: pp. 5-26.
2. Escudier B., Eisen T., Stadler W.M., et. al.: Sorafenib in advanced clear-cell renal-cell carcinoma. N Engl J Med 2007; 356: pp. 125-134.
3. Motzer R.J., Hutson T.E., Tomczak P., et. al.: Sunitinib versus interferon alfa in metastatic renal-cell carcinoma. N Engl J Med 2007; 356: pp. 115-124.
4. Rini B.I., Wilding G., Hudes G., et. al.: Phase II study of axitinib in sorafenib-refractory metastatic renal cell carcinoma. J Clin Oncol 2009; 27: pp. 4462-4468.
5. Rixe O., Bukowski R.M., Michaelson M.D., et. al.: Axitinib treatment in patients with cytokine-refractory metastatic renal-cell cancer: a phase II study. Lancet Oncol 2007; 8: pp. 975-984.
6. Eisenhauer E.A., Therasse P., Bogaerts J., et. al.: New response evaluation criteria in solid tumours: revised RECIST guideline (version 1.1). Eur J Cancer 2009; 45: pp. 228-247.
7. Ruan M., Shen Y., Chen L., et. al.: RECIST 1.1 and serum thyroglobulin measurements in the evaluation of responses to sorafenib in patients with radioactive iodine-refractory differentiated thyroid carcinoma. Oncol Lett 2013; 6: pp. 480-486.
8. Smith A.D., Lieber M.L., Shah S.N.: Assessing tumor response and detecting recurrence in metastatic renal cell carcinoma on targeted therapy: importance of size and attenuation on contrast-enhanced CT. AJR 2010; 194: pp. 157-165.
9. Smith A.D., Shah S.N., Rini B.I., et. al.: Morphology, Attenuation, Size, and Structure (MASS) criteria: assessing response and predicting clinical outcome in metastatic renal cell carcinoma on antiangiogenic targeted therapy. AJR Am J Roentgenol 2010; 194: pp. 1470-1478.
10. Therasse P., Arbuck S.G., Eisenhauer E.A., et. al.: New guidelines to evaluate the response to treatment in solid tumors. European Organization for Research and Treatment of Cancer, National Cancer Institute of the United States, National Cancer Institute of Canada. J Natl Cancer Inst 2000; 92: pp. 205-216.
11. Ganeshan B., Miles K.A., Young R.C., et. al.: In search of biologic correlates for liver texture on portal phase CT. Acad Radiol 2007; 14: pp. 1058-1068.
12. Ganeshan B., Miles K.A., Young R.C., et. al.: Hepatic entropy and uniformity: additional parameters that can potentially increase the effectiveness of contrast enhancement during abdominal CT. Clin Radiol 2007; 62: pp. 761-768.
13. Fossa S.D.: Interferon in metastatic renal cell carcinoma. Semin Oncol 2000; 27: pp. 187-193.
14. Karumanchi S.A., Merchan J., Sukhatme V.P.: Renal cancer: molecular mechanisms and newer therapeutic options. Curr Opin Nephrol Hypertens 2002; 11: pp. 37-42.
15. Hiles J.J., Kolesar J.M.: Role of sunitinib and sorafenib in the treatment of metastatic renal cell carcinoma. Am J Health Syst Pharm 2008; 65: pp. 123-131.
16. van der Veldt A.A, Meijerink M.R., van den Eertwegh A.J., et. al.: Targeted therapies in renal cell cancer: recent developments in imaging. Target Oncol 2010; 5: pp. 95-112.
17. Uhrig M., Sedlmair M., Schlemmer H.P., et. al.: Monitoring targeted therapy using dual-energy CT: semi-automatic RECIST plus supplementary functional information by quantifying iodine uptake of melanoma metastases. Cancer Imaging 2013; 13: pp. 306-313.
18. Baccala A., Hedgepeth R., Kaouk J., et. al.: Pathologic evidence of necrosis in recurrent renal mass following treatment with sunitinib. Int J Urol 2007; 14: pp. 1095-1097.
19. Flaherty K.T.: Sorafenib in renal cell carcinoma. Clin Cancer Res 2007; 13: pp. 747-752.
20. Van der Veldt A.A., Meijerink M.R., van den Eertwegh A.J., et. al.: Choi response criteria for early prediction of clinical outcome in patients with metastatic renal cell cancer treated with sunitinib. Br J Cancer 2010; 102: pp. 803-809.
21. Nathan P.D., Vinayan A., Stott D., et. al.: CT response assessment combining reduction in both size and arterial phase density correlates with time to progression in metastatic renal cancer patients treated with targeted therapies. Cancer Biol Ther 2010; 9: pp. 15-19.
22. Goh V., Ganeshan B., Nathan P., et. al.: Assessment of response to tyrosine kinase inhibitors in metastatic renal cell cancer: CT texture as a predictive biomarker. Radiology 2011; 261: pp. 165-171.