
Rationale and Objectives
To convert and optimize our previously developed computerized analysis methods for use with images from full-field digital mammography (FFDM) for breast mass classification to aid in the diagnosis of breast cancer.
Materials and Methods
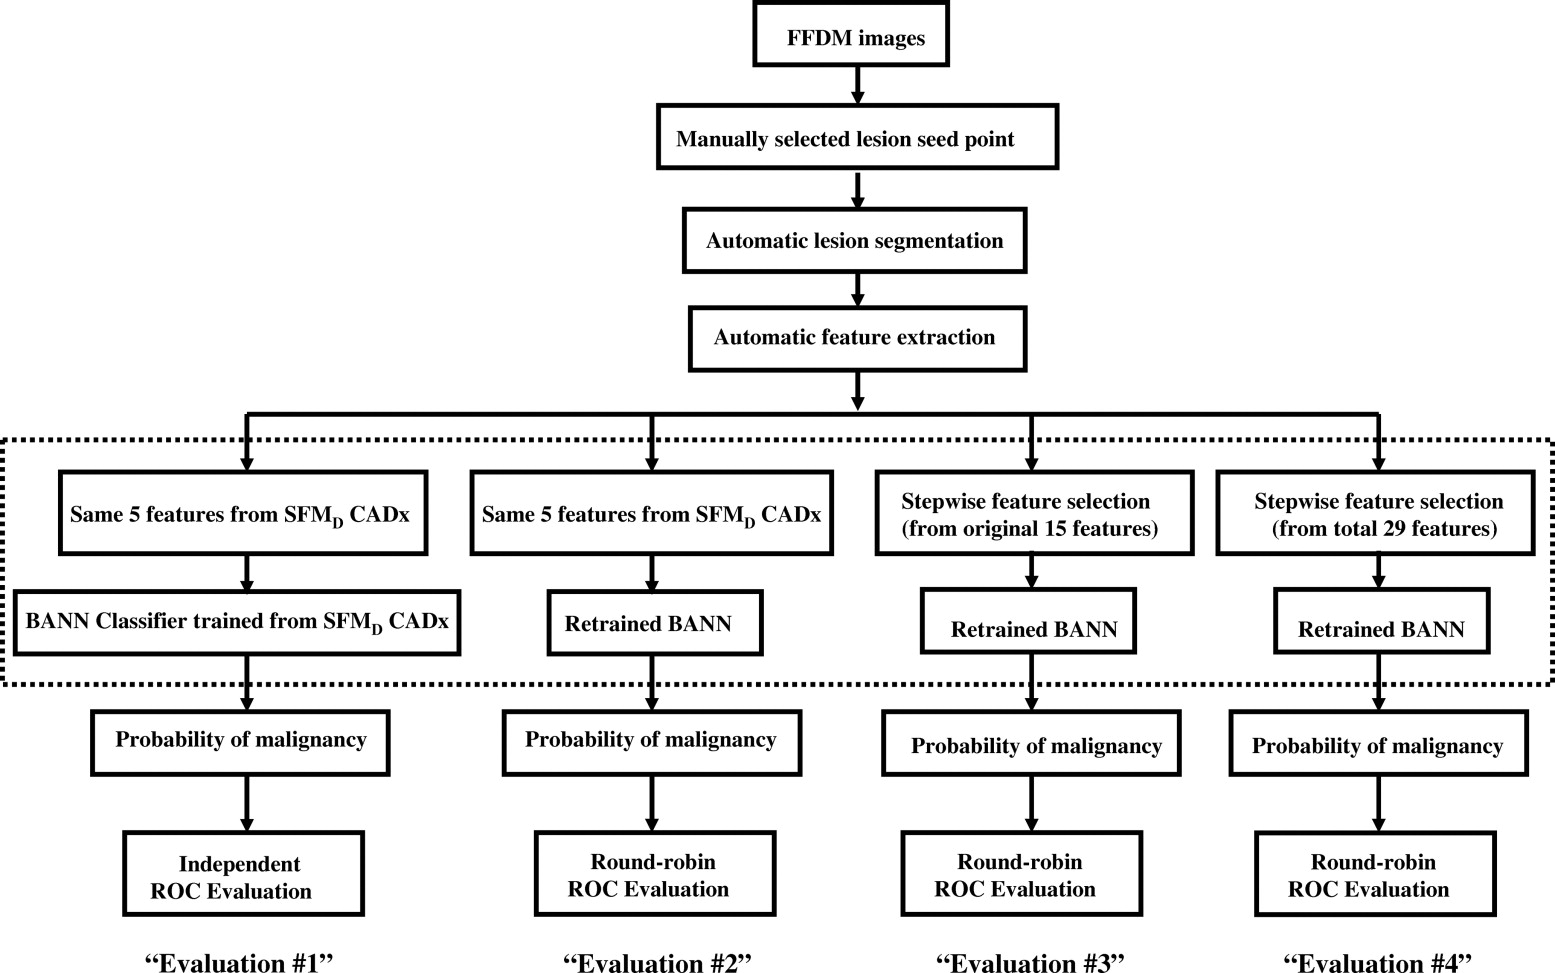
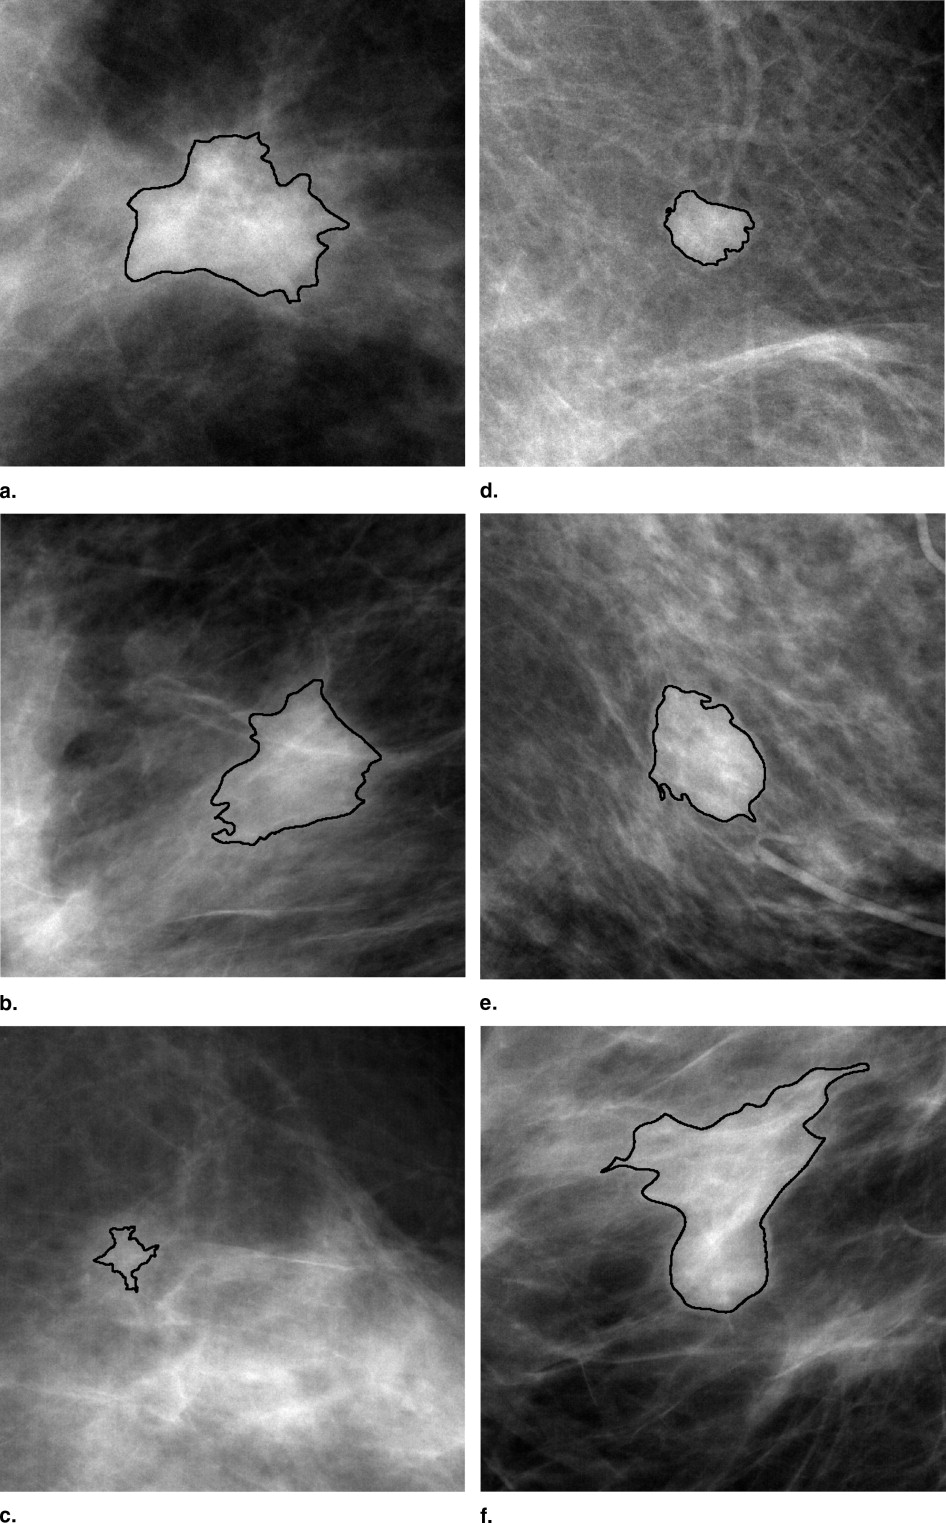
An institutional review board approved protocol was obtained, with waiver of consent for retrospective use of mammograms and pathology data. Seven hundred thirty-nine FFDM images, which contained 287 biopsy-proven breast mass lesions, of which 148 lesions were malignant and 139 lesions were benign, were retrospectively collected. Lesion margins were delineated by an expert breast radiologist and were used as the truth for lesion-segmentation evaluation. Our computerized image analysis method consisted of several steps: 1) identified lesions were automatically extracted from the parenchymal background using computerized segmentation methods; 2) a set of image characteristics (mathematic descriptors) were automatically extracted from image data of the lesions and surrounding tissues; and 3) selected features were merged into an estimate of the probability of malignancy using a Bayesian artificial neural network classifier. Performance of the analyses was evaluated at various stages of the conversion using receiver-operating characteristic analysis.
Results
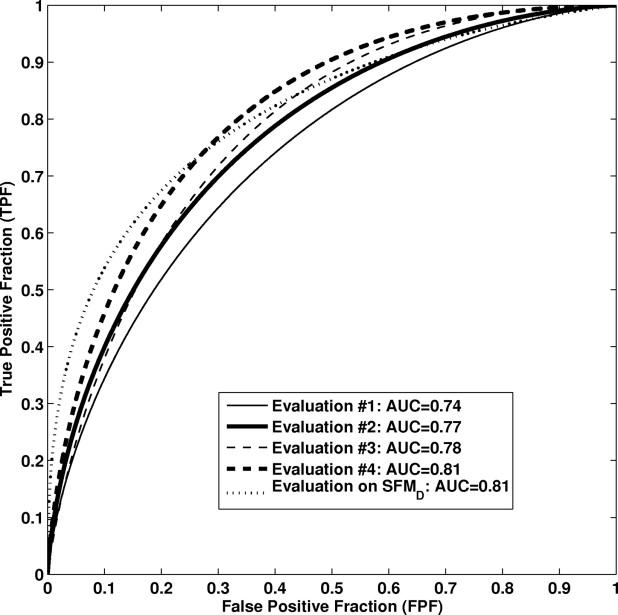
An area under the curve value of 0.81 was obtained in the task of distinguishing between malignant and benign mass lesions in a round-robin by case evaluation on the entire FFDM dataset. We failed to show a statistically significant difference ( P = .83) compared to results from our previous study in which the computerized classification was performed on digitized screen-film mammograms.
Conclusions
Our computerized analysis methods developed on digitized screen-film mammography can be converted for use with FFDM. Results show that the computerized analysis methods for the diagnosis of breast mass lesions on FFDM are promising, and can potentially be used to aid clinicians in the diagnostic interpretation of FFDM.
Breast cancer is the most frequently diagnosed cancer in women in the United States ( ). An estimated 178,480 new cases of invasive breast cancer and 62,030 new cases of in situ breast cancer are expected to occur among women during 2007. An estimated 40,460 breast cancer deaths are expected in 2007 ( ). Screening mammography has been the most effective tool for early cancer detection over the past several decades ( ), and it has been shown to reduce the cancer mortality by as much as 40% ( ). In addition, computer-aided detection methods have been shown to improve the detection of more cancers in mammography screening ( ).
After a lesion is detected, diagnostic imaging workup is performed to determine if a biopsy is warranted. Computer-aided diagnosis (CADx) has been proposed to aid the radiologist during diagnostic mammographic interpretation ( ). Most of the computerized analysis methods have been developed using databases of digitized screen-film mammograms (SFM D ) ( ). In recent years, full-field digital mammography (FFDM) has been approved by the Food and Drug Administration for clinical use. There were 13,559 mammography units, in which 13.8% were FFDM units, as of October 1, 2006, in the United States ( ). Because of the digital nature of FFDM, it offers many advantages, such as image storage, image transmission and retrieval, and digital image processing. With the easy access to digital images, computerized image analyses can be directly applied to FFDM without the need for film digitization, as is needed with screen-film mammography.
Get Radiology Tree app to read full this article<
Materials and methods
Database
Get Radiology Tree app to read full this article<
Get Radiology Tree app to read full this article<
Get Radiology Tree app to read full this article<
Computerized Classification Methods
Get Radiology Tree app to read full this article<
Get Radiology Tree app to read full this article<
Get Radiology Tree app to read full this article<
Get Radiology Tree app to read full this article<
Get Radiology Tree app to read full this article<
Performance Evaluation and Statistical Analysis
Get Radiology Tree app to read full this article<
Results
Get Radiology Tree app to read full this article<
Get Radiology Tree app to read full this article<
Table 1
Performances for the Computed-aided Diagnosis Method at Various Stages of Conversion in the Task of Distinguishing between Malignant and Benign Lesions
Classifiers Training Cases Feature Selection Classifier Weights Testing Cases Testing Methods AUC ± SE 95% CI Evaluation #1 SFM D SFM D SFM D FFDM Independent 0.74 ± 0.03 [0.69, 0.80] Evaluation #2 FFDM SFM D FFDM FFDM Round-robin by case 0.77 ± 0.03 [0.72, 0.82] Evaluation #3 FFDM FFDM (15 features) FFDM FFDM Round-robin by case 0.78 ± 0.03 [0.73, 0.83] Evaluation #4 FFDM FFDM (29 features) FFDM FFDM Round-robin by case 0.81 ± 0.03 [0.76, 0.86] Prior evaluation for comparison (20) SFM D SFM D SFM D SFM D Independent 0.81 ± 0.05 [0.69, 0.88]
AUC: area under the curve; FFDM: full-field digital mammography; SE: standard error; SFM D : digitized screen-film mammograms.
Here, “by case” round-robin analysis was performed on the FFDM dataset ( n = 287 breast mass lesions).
Get Radiology Tree app to read full this article<
Get Radiology Tree app to read full this article<
Get Radiology Tree app to read full this article<
Get Radiology Tree app to read full this article<
Get Radiology Tree app to read full this article<
Get Radiology Tree app to read full this article<
Table 2
Statistical Analysis Results for Differences in the Performance among Different Neural Network Classifiers that were used in SFM D and FFDM Studies
Evaluation #1 (FFDM) Evaluation #2 (FFDM) Evaluation #3 (FFDM) Evaluation #4 (FFDM) Prior Evaluation (20) (SFM D ) Evaluation #1 (FFDM) — 0.20 0.17 0.016 (α = 0.005) 0.32 Evaluation #2 (FFDM) — — 0.70 0.09 0.66 Evaluation #3 (FFDM) — — — 0.16 0.77 Evaluation #4 (FFDM) — — — — 0.83 Prior evaluation⁎ (SFM D ) — — — — —
FFDM: full-field digital mammography; SFM D : digitized screen-film mammograms.
From ROCKIT, P values were calculated for differences in the classification performance for a pair of neural network classifiers. The significance level α for the individual test was calculated using Holm’s procedure (overall α T = 0.05) for multiple tests of significance ( ).
Get Radiology Tree app to read full this article<
Get Radiology Tree app to read full this article<
Get Radiology Tree app to read full this article<
Get Radiology Tree app to read full this article<
Get Radiology Tree app to read full this article<
Discussion
Get Radiology Tree app to read full this article<
Get Radiology Tree app to read full this article<
Get Radiology Tree app to read full this article<
Get Radiology Tree app to read full this article<
Get Radiology Tree app to read full this article<
Get Radiology Tree app to read full this article<
Get Radiology Tree app to read full this article<
References
1. Jemal A., Siegel R., Ward E., et. al.: Cancer statistics, 2007. CA Cancer J Clin 2007; 57: pp. 43-66.
2. Chlebowski R.T.: Breast cancer risk reduction strategies for women at increased risk. Ann Rev Med 2002; 53: pp. 519-540.
3. Boyd N.F., Lockwood G.A., Martin L.J., et. al.: Mammographic densities and breast cancer risk. Breast Dis 1998; 10: pp. 113-126.
4. Kerlikowske K., Grady D., Rubin S.M., et. al.: Efficacy of screening mammography: a meta-analysis. JAMA 1995; 273: pp. 149-154.
5. Hendrick R.E., Smith R.A., Rutledge J.H., et. al.: Benefit of screening mammography in women aged 40–49: a new meta-analysis of randomized controlled trials. J Natl Cancer Inst Monogr 1997; 22: pp. 87-92.
6. Ciatto S., Rosselli D.T.M., Burke P., et. al.: Comparison of standard and double reading and computer-aided detection (CAD) of interval cancers at prior negative screening mammograms: blind review. Br J Cancer 2003; 89: pp. 1645-1649.
7. Nishikawa R.M.: Current status and future directions of computer-aided diagnosis in mammography. Comput Med Imaging Graph 2007; 31: pp. 224-235.
8. Giger M.L.: Computerized analysis of images in the detection and diagnosis of breast cancer. Semin Ultrasound CT MRI 2004; 25: pp. 411-418.
9. Huo Z., Giger M.L., Vyborny C.J., et. al.: Analysis of speculation in the computerized classification of mammographic masses. Med Phys 1995; 22: pp. 1569-1579.
10. Hadjiiski L., Sahiner B., Helvie M.A., et. al.: Breast masses: computer-aided diagnosis with serial mammograms. Radiology 2006; 240: pp. 343-356.
11. Lo J.Y., Baker J.A., Kornguth P.J., et. al.: Computer-aided diagnosis of breast cancer: artificial neural network approach for optimized merging of mammographic features. Acad Radiol 1995; 2: pp. 841-850.
12. Zheng B., Chang Y.H., Gur D.: Adaptive computer-aided diagnosis scheme of digitized mammograms. Acad Radiol 1996; 3: pp. 806-814.
13. Veldkamp W.J.H., Karssemeijer N., Otten J.D.M., et. al.: Automated classification of clustered microcalcifications into malignant and benign types. Med Phys 2000; 27: pp. 2600-2608.
14. MQSA and Accreditation for Full-Field Digital Mammography, American College of Radiology: http://www.acr.org/accreditation/mammography/rsna07presentation.aspx Accessed June 4, 2008
15. Giger M.L., Huo Z., Kupinski M.A., et. al.: Computer-aided diagnosis in mammography.Sonka M.Fitzpatrick M.J.Handbook of medical imaging.2000.SPIEBellingham, WA:pp. 915-1004.
16. Huo Z., Giger M.L., Vyborny C.J., et. al.: Automated computerized classification of malignant and benign masses on digitized mammograms. Acad Radiol 1998; 5: pp. 155-168.
17. Huo Z., Giger M.L., Metz C.E.: Effect of dominant features on neural network performance in the classification of mammographic lesions. Phys Med Biol 1999; 44: pp. 2579-2595.
18. Huo Z., Giger M.L., Vyborny C.J., et. al.: Computerized classification of benign and malignant masses on digitized mammograms: a study of robustness. Acad Radiol 2000; 7: pp. 1077-1084.
19. Huo Z., Giger M.L., Vyborny C.J.: Computerized analysis of multiple-mammographic views: potential usefulness of special view mammograms in computer-aided diagnosis. IEEE Trans Med Imaging 2001; 20: pp. 1285-1292.
20. Horsch K., Giger M.L., Vyborny C.J., et. al.: Classification of breast lesions with multimodality computer-aided diagnosis: observer study results on an independent clinical data set. Radiology 2006; 240: pp. 357-368.
21. Kupinski M.A., Giger M.L.: Automated seeded lesion segmentation on digital mammograms. IEEE Trans Med Imaging 1998; 17: pp. 510-517.
22. Chen W., Giger M.L., Li H., et. al.: Volumetric texture analysis of breast lesions on contrast-enhanced magnetic resonance images. Magn Res Med 2007; 58: pp. 562-571.
23. Bishop C.: Neural network for pattern recognition.1995.Oxford University PressOxford
24. Huberty C.J.: Applied discriminant analysis.1994.WileyNew York
25. Lachenbruch P.L.: Discriminant analysis.1975.HafnerLondon, UK
26. Metz C.E.: ROC methodology in radiographic imaging. Invest Radiol 1986; 21: pp. 720-733.
27. Metz C.E.: Some practical issues of experimental design and data analysis in radiological ROC studies. Invest Radiol 1989; 24: pp. 234-245.
28. Metz C.E., Herman B.A., Shen J.: Maximum-likelihood estimation of receiver operating characteristic (ROC) curves from continuously distributed data. Stat Med 1998; 17: pp. 1033-1053.
29. Pesce L.L., Metz C.E.: Reliable and computationally efficient maximum-likelihood estimation of “proper” binormal ROC curves. Acad Radiol 2007; 14: pp. 814-829.
30. Lachenbruch P.A., Mickey M.R.: Estimation of error rates in discriminant analysis. Technometrics 1968; 10: pp. 1-11.
31. ROC software: University of Chicago website. http://www-radiology.uchicago.edu/krl/roc_soft6.htm Accessed February 23, 2007
32. Li H., Giger M.L., Yuan Y., et. al.: Comparison of computerized image analyses for digitized screen-film mammograms and full-field digital mammography images. Digital Mammography IWDM 2006; pp. 569-575.
33. Li L., Clark R.A., Thomas J.A.: Computer-aided diagnosis of masses with full-field digital mammography. Acad Radiol 2002; 9: pp. 4-12.
34. Ge J., Sahiner B., Hadjiiski L.M., et. al.: Computer aided detection of clusters of microcalcifications on full field digital mammograms. Med Phys 2006; 33: pp. 2975-2988.
35. Rana R.S., Jiang Y., Schmidt R.A., et. al.: Independent evaluation of computer classification of malignant and benign calcifications in full-field digital mammograms. Acad Radiol 2007; 14: pp. 363-370.
36. Sun X., Qian W., Song X., et. al.: Computer-aided detection (CAD) of breast cancer on full field digital and screening film mammograms. Proc SPIE 2003; 5032: pp. 930-939.
37. Wei J., Hadjiiski L.M., Sahiner B., et. al.: Computer-aided detection system for breast masses: comparison of performances on full-field digital mammograms and digitized screen-film mammograms. Acad Radiol 2007; 14: pp. 659-669.
38. Pisano E., Gatsonis C., Hendrick E., et. al.: Diagnostic performance of digital versus film mammography for breast-cancer screening. N Engl J Med 2005; 353: pp. 1773-1783.
39. Cole E., Pisano E.D., Brown M., et. al.: Diagnostic accuracy of Fischer SenoScan digital mammography versus screen-film mammography in a diagnostic mammography population. Acad Radiol 2004; 11: pp. 879-886.
40. Seo K., Pisano E.D., Kuzmiak C.M., et. al.: The positive predictive value for diagnosis of breast cancer: full-field digital mammography versus film-screen mammography in the diagnostic mammographic population. Acad Radiol 2006; 13: pp. 1229-1235.
41. Lewin J.M., D’Orsi C.J., Hendrick R.E., et. al.: Clinical comparison of full-field digital mammography and screen-film mammography for detection of breast cancer. AJR Am J Roentgenol 2002; 179: pp. 671-677.
42. Holm S.: A simple sequentially rejective multiple test procedure. Scand J Stat 1979; 6: pp. 65-70.