
Rationale and Objectives
We sought to initially evaluate the feasibility of R2′ on a 3-T magnetic resonance (MR) scanner for assessment of renal oxygenation changes following administration of furosemide in rats.
Materials and Methods
Eight intact male Wistar rats were involved in experimental group. The experiment was performed at a 3-T MR scanner using a multiple gradient-echo (mGRE) sequence for R2* map and a multiecho fast spin-echo (FSE) sequence for R2 map. R2′ values of cortex and medulla were calculated using the equation R2* = R2 + R2′ . The values of R2 and R2* were measured and R2′ was calculated before and after administration of furosemide, and the changes (delta values) were calculated.
Results
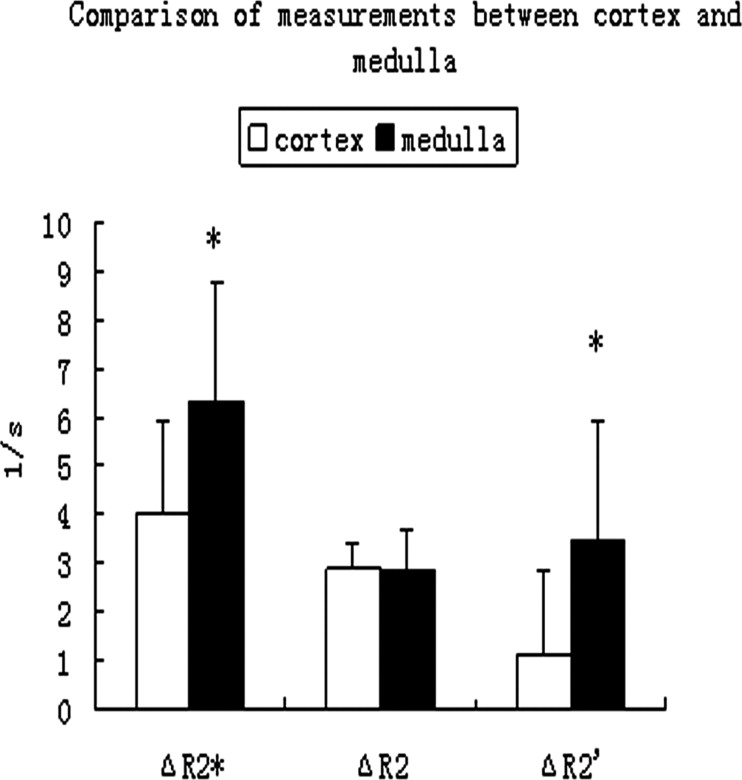
Both R2* and R2 values decreased significantly after administration of furosemide ( P < .001) in both the cortex and medulla. ΔR2* in the medulla was significantly higher than in the cortex ( P < .05). ΔR2 was not significantly different between the cortex and medulla ( P > .05). The baseline R2′ value was 12.13 ± 0.59 1/s in the cortex and 19.52 ± 3.44 1/s in the medulla. R2′ value decreased significantly in the medulla after administration of furosemide ( P < .05), but there was no significant difference in the cortex before and after administration of furosemide ( P > .05).
Conclusion
R2′ may be more appropriate than R2* to indicate the change of oxygenation after administration of furosemide in intact rats at 3-T MR. Further studies are needed for both intact animals and experimental models in comparison with non-MR imaging methods to validate this initial observation.
During the past few years, there has been great interest in the possibility of using magnetic resonance (MR) images to provide an indicator of oxygenation in the kidneys. Blood oxygen level−dependent (BOLD) magnetic resonance imaging (MRI) is a noninvasive method to assess tissue oxygenation, using deoxyhemoglobin as an endogenous contrast agent ( ).
Deoxyhemoglobin is a paramagnetic molecule that generates magnetic moments by its unpaired iron electrons ( ). Increased deoxyhemoglobin speeds up magnetic spin dephasing of blood water protons and decreases signal intensity on T2* (apparent spin-spin relaxation time)-weighted MR images ( ). At 1.5-T MR, the measured parameter of renal BOLD MRI, rate of spin dephasing R2* (1/T2*), is closely related to the tissue content of deoxyhemoglobin, which indicates the oxygen tension (PO 2 ). The PO 2 of capillary blood is believed to be in equilibrium with the surrounding tissue; changes estimated by BOLD MRI may be interpreted as changes in tissue PO 2 ( ). Increased R2* levels imply decreased PO 2 in tissues ( ).
Get Radiology Tree app to read full this article<
Get Radiology Tree app to read full this article<
Get Radiology Tree app to read full this article<
Get Radiology Tree app to read full this article<
Get Radiology Tree app to read full this article<
Materials and methods
Animals
Get Radiology Tree app to read full this article<
MR Technique
Get Radiology Tree app to read full this article<
Get Radiology Tree app to read full this article<
Get Radiology Tree app to read full this article<
R2*=R2+R2′ R
2
*
=
R
2
+
R
2
′
where R2*, R2, and R2′ were measured in 1/s.
Get Radiology Tree app to read full this article<
Get Radiology Tree app to read full this article<
Statistical Methods
Get Radiology Tree app to read full this article<
Results
Baseline Values in Medulla and Cortex
Get Radiology Tree app to read full this article<
Table 1
The R2*, R2, and R2′ Values in the Experimental Group
Pre-F Post-F_P_ Value R2* Cortex 26.13 ± 0.71 22.07 ± 2.04 < .001 Medulla 34.79 ± 3.51 28.45 ± 3.48 < .001P value < .001 R2 Cortex 14.00 ± 0.60 11.09 ± 0.65 < .001 Medulla 15.27 ± 0.43 12.41 ± 0.97 < .001P value < .001 R2′ Cortex 12.13 ± 0.59 10.98 ± 1.57 .095 Medulla 19.52 ± 3.44 16.04 ± 3.44 .005P value .001
In the experiment group, the three parameters showed significant values in the medulla compared to in the cortex ( P > .05). R2* and R2 showed significant decreases after administration of furosemide ( P < .001) in the cortex before and after the administration of furosemide. R2′ showed no significant difference ( P > .05). In contrast, all the three parameters showed significant decreases after administration of furosemide ( P < .001 for R2* and R2; P < .05 for R2′) in the medulla. The data in the table are presented as mean ± standard deviation (liters per second).
Pre-F, before the administration of furosemide; Post-F, after the administration of furosemide.
Table 2
The R2*, R2, and R2′ Values in Control Group
Pre-NS Post-NS_P_ Value R2* Cortex 25.00 ± 2.03 25.22 ± 1.13 .836 Medulla 32.58 ± 1.46 32.20 ± 0.91 .667P value .004 R2 Cortex 14.12 ± 0.42 14.00 ± 0.48 .067 Medulla 15.20 ± 0.71 15.20 ± 0.70 .874P value .045 R2′ Cortex 10.88 ± 2.40 11.22 ± 1.60 .748 Medulla 17.37 ± 2.13 17.00 ± 1.17 .671P value .005
In the control group, the three parameters also showed significant values in the medulla compared to the cortex ( P > .05). All the three parameters showed no significant difference before and after administration of NS in both the cortex and medulla. The data in table are presented as mean ± standard deviation (liters per second).
Pre-NS, before the administration of normal sodium; Post-NS, after the administration of normal sodium.
Get Radiology Tree app to read full this article<
Influence of Furosemide
Get Radiology Tree app to read full this article<
Get Radiology Tree app to read full this article<
Get Radiology Tree app to read full this article<
Get Radiology Tree app to read full this article<
Discussion
Get Radiology Tree app to read full this article<
Get Radiology Tree app to read full this article<
Get Radiology Tree app to read full this article<
Get Radiology Tree app to read full this article<
Get Radiology Tree app to read full this article<
Get Radiology Tree app to read full this article<
Get Radiology Tree app to read full this article<
Get Radiology Tree app to read full this article<
References
1. Prasad P.V., Edelman R.R., Epstein F.H.: Noninvasive evaluation of intrarenal oxygenation with BOLD MRI. Circulation 1996; 94: pp. 3271-3275.
2. Prasad P.V., Chen Q., Goldfarb J.W., Epstein F.H., Edelman R.R.: Breathhold R2* mapping with a multiple gradient-recalled echo sequence: Application to the evaluation of intrarenal oxygenation. J Magn Reson Imaging 1997; 7: pp. 1163-1165.
3. Prasad P.V., Epstein F.H.: Changes in renal medullary PO2 during water diuresis as evaluated by blood oxygenation level-dependent magnetic resonance imaging: Effects of aging and cyclooxygenase inhibition. Kidney Int 1999; 55: pp. 294-298.
4. Djamali A., Sadowski E.A., Samaniego-Picota M., et. al.: Noninvasive assessment of early kidney allograft dysfunction by blood oxygen level-dependent magnetic resonance imaging. Transplantation 2006; 82: pp. 621-628.
5. Kone B.C.: A ‘BOLD’ new approach to renal oxygen economy. Circulation 1996; 94: pp. 3067-3068.
6. Pauling L., Coryell C.D.: The magnetic properties and structure of hemoglobin, oxyhemoglobin and carbonmonoxyhemoglobin. Proc Natl Acad Sci USA 1936; 22: pp. 210-216.
7. Thulborn K.R., Waterton J.C., Matthews P.M., Radda G.K.: Oxygenation dependence of the transverse relaxation time of water protons in whole blood at high field. Biochim Biophys Acta 1982; 714: pp. 265-270.
8. Dunn J.F., Swartz H.M.: Blood oxygenation. Adv Exp Med Biol 1997; 428: pp. 645-650.
9. Nagrani N.K., Mattson D.L., Jesmanowicz A., Greene A.S., Cowley A.V., Hyde J.S.: In vivo high resolution echo-planar imaging of rat kidney. [abstract] Soc Magn Reson Med 1994; pp. 1019.
10. Brezis M.L., Heyman S.N., Epstein F.H.: Determinants of intrarenal oxygenation, 1: Effects of diuretics. Am J Physiol 1994; 267: pp. F1059-F1062.
11. Li L.P., Storey P., Pierchala L., Li W., Polzin J., Prasad P.: Evaluation of the reproducibility of intrarenal R2* and Delta R2* measurements following administration of furosemide and during water load. J Magn Reson Imaging 2004; 19: pp. 610-616.
12. Epstein F.H., Prasad P.: Effects of furosemide on medullary oxygenation in younger and older subjects. Kidney Int 2000; 57: pp. 2080-2083.
13. Epstein F.H., Veves A., Prasad P.V.: Effect of diabetes on renal medullary oxygenation during water diuresis. Diabetes Care 2002; 25: pp. 575-578.
14. Ries M., Basseau F., Tyndal B., et. al.: Renal diffusion and BOLD MRI in experimental diabetic nephropathy. J Magn Reson Imaging 2003; 17: pp. 104-113.
15. Li L.P., Storey P., Kim D., et. al.: Kidneys in hypertensive rats show reduced response to nitric oxide synthase inhibition as evaluated by BOLD MRI. J Magn Reson Imaging 2003; 17: pp. 671-675.
16. Li L.P., Li B.S., Storey P., Fogelson L., Li W., Prasad P.: Effect of free radical scavenger (Tempol) on intrarenal oxygenation in hypertensive rats as evaluated by BOLD MRI. J Magn Reson Imaging 2005; 21: pp. 245-248.
17. Thoeny H.C., Zumstein D., Simon-Zoula S., et. al.: Functional evaluation of transplanted kidneys with diffusion-weighted and BOLD MR imaging: initial experience. Radiology 2006; 241: pp. 812-821.
18. Sadowski E.A., Fain S.B., Alford S.K., et. al.: Assessment of acute renal transplant rejection with blood oxygen level-dependent MR imaging: Initial experience. Radiology 2005; 236: pp. 911-919.
19. Alford S.K., Sadowski E.A., Unal O., et. al.: Detection of acute renal ischemia in swine using blood oxygen level-dependent magnetic resonance imaging. J Magn Reson Imaging 2005; 22: pp. 347-353.
20. Juillard L., Lerman L.O., Kruger D.G., et. al.: Blood oxygen level-dependent measurement of acute intra-renal ischemia. Kidney Int 2004; 65: pp. 944-950.
21. Pedersen M., Dissing T.H., Morkenborg J., et. al.: Validation of quantitative BOLD MRI measurements in kidney: Application to unilateral ureteral obstruction. Kidney Int 2005; 67: pp. 2305-2312.
22. Li L.P., Vu A.T., Li B.S., Dunkle E., Prasad P.V.: Evaluation of intrarenal oxygenation by BOLD MRI at 3.0 T. J Magn Reson Imaging 2004; 20: pp. 901-914.
23. Li L.P., Ji L., Lindsay S., Prasad P.V.: Evaluation of intrarenal oxygenation in mice by BOLD MRI on a 3.0T human whole-body scanner. J Magn Reson Imaging 2007; 25: pp. 635-638.
24. Hendrick R.E.: Image contrast and noise.Stark D.D.Bradley W.G.Magnetic Resonance Imaging.1999.MosbyNew York:pp. 57-58.
25. Bandettini P.A., Wong A., Jesmanowicz A., Hinks R.S., Hyde J.S.: Spin-echo and gradient-echo EPI of human brain activation using BOLD contrast: A comparative study at 1.5T. NMR Biomed 1994; 7: pp. 3-11.
26. Song R., Song H.K.: Echo-spacing optimization for the simultaneous measurement of reversible (R2′) and irreversible (R2) transverse relaxation rates. Magn Reson Imaging 2007; 25: pp. 63-68.
27. Kundel H.L., Schlakman B., Joseph P.M., Fishman J.E., Summers R.: Water content and NMR relaxation time gradients in the rabbit kidney. Invest Radiol 1985; 21: pp. 12-17.
28. Boxt L.M., Hsu D., Katz J., et. al.: Estimation of myocardial water content using transverse relaxation time from dual spin-echo magnetic resonance imaging. Magn Reson Imaging 1993; 11: pp. 375-383.
29. Miszkiel K.A., Paley M.N., Wilkinson I.D., et. al.: The measurement of R2, R2* and R2′ in HIV-infected patients using the prime sequence as a measure of brain iron deposition. Magn Reson Imaging 1997; 15: pp. 1113-1119.
30. Ordidge R.J., Gorell J.M., Deniau J.C., Knight R.A., Helpern J.A.: Assessment of relative brain iron concentrations using T2-weighted and T2*-weighted MRI at 3 Tesla. Magn Reson Med 1994; 32: pp. 335-341.
31. Pedersen M., Vajda Z., Stodkilde-Jorgensen H., Nielsen S., Frokiaer J.: Furosemide increases water content in renal tissue. Am J Physiol Renal Physiol 2007; 292: pp. F1645-F1651.
32. Gelman N., Gorell J.M., Barker P.B., et. al.: MR imaging of human brain at 3.0T: Preliminary report on transverse relaxation rates and relation to estimated iron content. Radiology 1999; 210: pp. 759-767.
33. de Graaf R.A., Brown P.B., McIntyre S., Nixon T.W., Behar K.L., Rothman D.L.: High magnetic field water and metabolite proton T1 and T2 relaxation in rat brain in vivo. Magn Reson Med 2006; 56: pp. 386-394.
34. Tumkur S., Vu A., Li L., et. al.: Evaluation of intrarenal oxygenation at 3.0 T using 3-dimensional multiple gradient-recalled echo sequence. Invest Radiol 2006; 41: pp. 181-184.