
Rationale and Objectives
Although multiple detector computed tomography (MDCT) and hyperpolarized gas magnetic resonance imaging (HP MRI) have demonstrated ability to detect structural and ventilation abnormalities in asthma, few studies have sought to exploit or cross-validate the regional information provided by these techniques. The purpose of this work is to assess regional disease in asthma by evaluating the association of sites of ventilation defect on HP MRI with other regional markers of airway disease, including air trapping on MDCT and inflammatory markers on bronchoscopy.
Materials and Methods
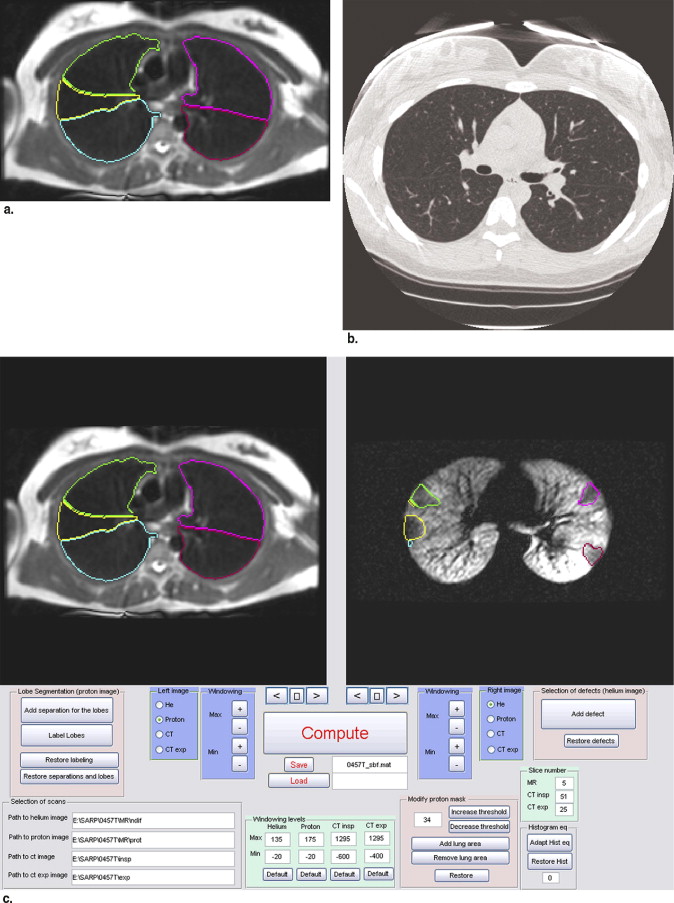
Both HP MRI using helium-3 and MDCT were acquired in the same patients. Supervised segmentation of the lung lobes on MRI and MDCT facilitated regional comparisons of ventilation abnormalities in the lung parenchyma. The percentage of spatial overlap was evaluated between regions of ventilation defect on HP MRI and hyperlucency on MDCT to determine associations between obstruction and likely regions of gas trapping. Similarly, lung lobes with high defect volume were compared to lobes with low defect volume for differences in inflammatory cell number and percentage using bronchoscopic assessment.
Results
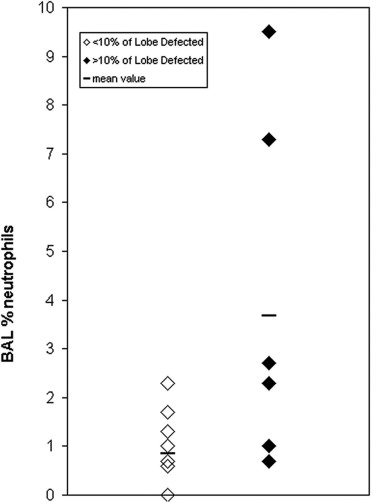
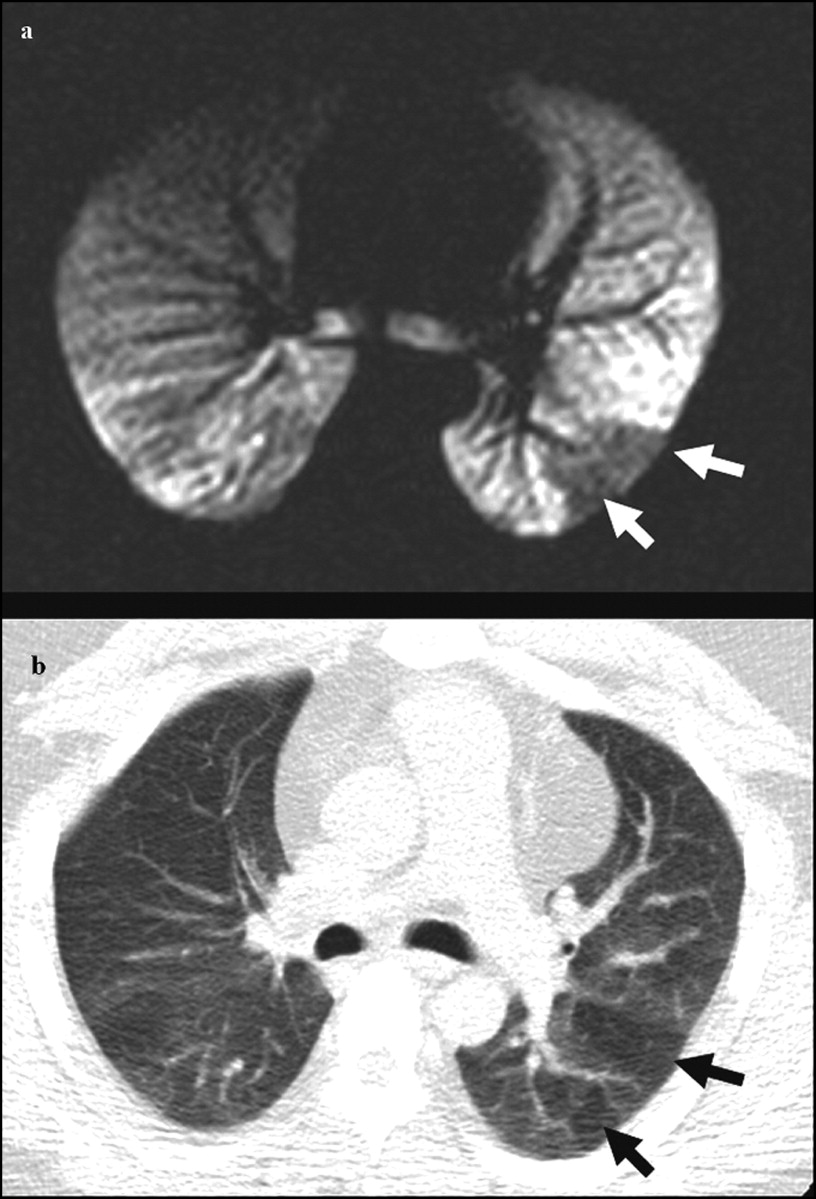
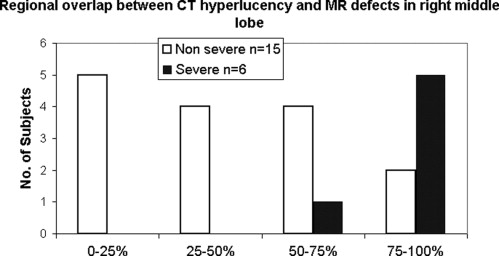
There was significant overlap between sites of ventilation defect on HP MRI and hyperlucency on MDCT suggesting that sites of airway obstruction and air trapping are associated in asthma. The percent ( r = 0.68; P = .0039) and absolute ( r = 0.61; P = .0125) number of neutrophils on bronchoalveolar lavage for the sampled lung lobe also directly correlated with increased defect volume.
Conclusions
These results show promise for using image guidance to assess specific regions of ventilation defect or air trapping in heterogeneous obstructive lung diseases such as asthma.
Asthma affects millions of people worldwide and trends indicate increasing incidence, especially in children ( ). Subjects with asthma experience periodic wheezing and shortness of breath that manifests on pulmonary function tests as reduced forced expiratory lung volume in 1 second (FEV 1 ) and increased lung residual volume normalized to the total lung capacity (RV/TLC) compared with normal subjects. Bronchodilation with beta agonists such as albuterol can partially reverse this obstructive physiology by relaxing airway smooth muscle, but evidence from airway biopsies suggests that obstruction is also accompanied by chronic inflammation and airway remodeling ( ).
Functional imaging in the lungs has great potential for mechanistic studies of lung disease, particularly for identifying regional patterns of obstruction that test physiologic hypotheses ( ). Regional mosaics of reduced parenchymal density, apparently from air trapping, are associated with asthma on computed tomography (CT) ( ). More recently, CT, and especially multidetector CT (MDCT), have been used to quantitatively measure lung parenchymal density and correlate these measures to obstructive physiology ( ).
Get Radiology Tree app to read full this article<
Get Radiology Tree app to read full this article<
Materials and methods
Get Radiology Tree app to read full this article<
Get Radiology Tree app to read full this article<
Pulmonary Function and Bronchoscopy
Get Radiology Tree app to read full this article<
Get Radiology Tree app to read full this article<
Image Acquisition
Get Radiology Tree app to read full this article<
Get Radiology Tree app to read full this article<
Table 1
Multidetector Computed Tomography Scan Parameters
Parameter 16 Detector 64 Detector Collimation 1.25 mm 1.25 mm Pitch 1.675 0.984 Source current/voltage 50 mA/120 kVp 50 mA/120 kVp Gantry speed 0.5 second/rotation Matrix 512 × 512 Lung volume Functional residual capacity (expiratory) and total lung capacity (inspiratory) Reconstruction kernel “Standard” and “lung” Reconstructed slice thickness 0.625 mm (quantitative) and 5 mm (qualitative)
Get Radiology Tree app to read full this article<
Get Radiology Tree app to read full this article<
Get Radiology Tree app to read full this article<
Get Radiology Tree app to read full this article<
Table 2
Magnetic Resonance Imaging Scan Parameters
Parameter T1-Weighted Fast Spin Echo Hyperpolarized 3 He Magnetic Resonance Imaging Repetition time/echo time ∞/8 milliseconds 8.4/3.1 milliseconds Flip angle 90° 7° Bandwidth 31.25 kHz 31.25 kHz Acquisition matrix 128 × 64 128 × 128 Imaging time 7–8 seconds 18–24 seconds Axial plane field of view 32–38 × 24–29 cm 2 Slice field of view 13–19 × 1.5 cm slices
Get Radiology Tree app to read full this article<
Image Measurement
Get Radiology Tree app to read full this article<
Get Radiology Tree app to read full this article<
Get Radiology Tree app to read full this article<
Get Radiology Tree app to read full this article<
Statistical Analyses
Get Radiology Tree app to read full this article<
Results
Get Radiology Tree app to read full this article<
Table 3
Statistical Summary (Mean ± Standard Deviation) of Image Metrics and Pulmonary Function with Asthma Severity for Subjects Included in the Regional Analysis
Parameter Severe (n = 6) Nonsevere (n = 15) Overall (n = 21) Defect score 16.7 ± 12.3 11.0 ± 9.5 12.6 ± 10.4 Percent defect volume (%) 7.6 ± 4.2 5.4 ± 4.5 6.0 ± 4.4 Expiratory densitometry: Percent below −850 HU 4.7 ± 2.1 8.0 ± 7.3 7.0 ± 6.4 Percent below −910 HU 0.9 ± 1.0 1.5 ± 1.7 1.3 ± 1.6 Percent below −950 HU 0.3 ± 0.5 0.4 ± 0.7 0.4 ± 0.6 FEV 1 (% predicted) 82.7 ± 11.1 91.5 ± 15.1 89.0 ± 14.3 FEF 25–75 (% predicted) 71.7 ± 36.3 69.4 ± 23.4 70.0 ± 26.8 FEV 1 /FVC (% predicted) 94.4 ± 13.6 89.2 ± 8.6 90.7 ± 10.2 RV/TLC 0.323 ± 0.098 0.308 ± 0.052 0.312 ± 0.066 BAL % Neutrophils 0.86 ± 0.86 2.48 ± 2.93 2.01 ± 2.58 % Eosinophils 0.74 ± 0.73 0.63 ± 0.67 0.66 ± 0.67 % Macrophage 91.3 ± 2.9 85.5 ± 11.2 87.2 ± 9.8
HU: Hounsfield unit; FEV 1 : forced expiratory volume in 1 second; FEF 25–75 : forced expiratory flow rate at 25–75% FVC; FVC: forced vital capacity; RV: residual volume; TLC: total lung capacity; BAL: bronchoalveolar lavage.
Table 4
Spearman Correlations Between Image, Pulmonary Lung Function, and BAL Measures
Parameter Correlate FEV 1 % Predicted FEV 1 /FVC % Predicted FEF 25–75 % Predicted RV/TLC % Predicted BAL % Neutrophils BAL Total Neutrophils (10 6 cells) Defect score (n = 21) −0.76 P = .0002 −0.24 P = .31 −0.54 P = .03 0.58 P = .02 0.23 P = .17 0.06 P = .82 Expiratory densitometry (n = 45) Percent below −850 HU −0.37 P = .04 −0.52 P = .02 −0.55 P = .002 0.53 P = .003 0.16 P = .54 0.18 P = .51 % Defect volume Whole lung (n = 21) −0.57 P = .007 −0.23 P = .31 −0.43 P = .08 0.37 P = .15 0.41 P = .11 0.30 P = .27 @BAL site (n = 17) — — — — 0.68 P = .0039 0.61 P = .0125
HU: Hounsfield unit; FEV 1 : forced expiratory volume in 1 second; FEF 25–75 : forced expiratory flow rate at 25–75% FVC; FVC: forced vital capacity; RV: residual volume; TLC: total lung capacity; BAL: bronchoalveolar lavage.
Get Radiology Tree app to read full this article<
MDCT Measures
Get Radiology Tree app to read full this article<
MRI Measures
Get Radiology Tree app to read full this article<
Get Radiology Tree app to read full this article<
Get Radiology Tree app to read full this article<
MDCT and MRI Comparison
Get Radiology Tree app to read full this article<
Get Radiology Tree app to read full this article<
Discussion
Get Radiology Tree app to read full this article<
Get Radiology Tree app to read full this article<
Get Radiology Tree app to read full this article<
Get Radiology Tree app to read full this article<
Get Radiology Tree app to read full this article<
References
1. Hartert T.V., Peebles R.S.: Epidemiology of asthma: the year in review. Curr Opin Pulm Med 2000; 6: pp. 4-9.
2. Sears M.R., Greene J.M., Willan A.R., et. al.: A longitudinal, population-based, cohort study of childhood asthma followed to adulthood. N Engl J Med 2003; 349: pp. 1414-1422.
3. Postma D.S., Timens W.: Remodeling in asthma and chronic obstructive pulmonary disease. Proc Am Thorac Soc 2006; 3: pp. 434-439.
4. Permutt S.: Current status of functional pulmonary imaging. Acad Radiol 2005; 12: pp. 1359-1361.
5. Haczku A., Emami K., Fischer M.C., et. al.: Hyperpolarized 3He MRI in asthma measurements of regional ventilation following allergic sensitization and challenge in mice—preliminary results. Acad Radiol 2005; 12: pp. 1362-1370.
6. Holmes J.H., Sorkness R.L., Meibom S.K., et. al.: Noninvasive mapping of regional response to segmental allergen challenge using magnetic resonance imaging and [F-18]fluorodeoxyglucose positron emission tomography. Magn Reson Med 2005; 53: pp. 1243-1250.
7. Holmes J.H., Korosec F.R., Du J., et. al.: Imaging of lung ventilation and respiratory dynamics in a single ventilation cycle using hyperpolarized He-3 MRI. J Magn Reson Imaging 2007; 26: pp. 630-636.
8. Newman K.B., Lynch D.A., Newman L.S., et. al.: Quantitative computed tomography detects air trapping due to asthma. Chest 1994; 106: pp. 105-109.
9. Gono H., Fujimoto K., Kawakami S., et. al.: Evaluation of airway wall thickness and air trapping by HRCT in asymptomatic asthma. Eur Respir J 2003; 22: pp. 965-971.
10. Ueda T., Niimi A., Matsumoto H., et. al.: Role of small airways in asthma: investigation using high-resolution computed tomography. J Allergy Clin Immunol 2006; 118: pp. 1019-1025.
11. King G.G., Eberl S., Salome C.M., et. al.: Differences in airway closure between normal and asthmatic subjects measured with single-photon emission computed tomography and Technegas. Am J Respir Crit Care Med 1998; 158: pp. 1900-1906.
12. Harris R.S., Winkler T., Tgavalekos N., et. al.: Regional pulmonary perfusion, inflation, and ventilation defects in bronchoconstricted patients with asthma. Am J Respir Crit Care Med 2006; 174: pp. 245-253.
13. Samee S., Altes T., Powers P., et. al.: Imaging the lungs in asthmatic patients by using hyperpolarized helium-3 magnetic resonance: assessment of response to methacholine and exercise challenge. J Allergy Clin Immunol 2003; 111: pp. 1205-1211.
14. de Lange E.E., Altes T.A., Patrie J.T., et. al.: Evaluation of asthma with hyperpolarized helium-3 MRI: correlation with clinical severity and spirometry. Chest 2006; 130: pp. 1055-1062.
15. Hoffman E.A., van Beek E.: Hyperpolarized media MR imaging—expanding the boundaries?. Acad Radiol 2006; 13: pp. 929-931.
16. de Lange E.E., Altes T.A., Patrie J.T., et. al.: The variability of regional airflow obstruction within the lungs of patients with asthma: assessment with hyperpolarized helium-3 magnetic resonance imaging. J Allergy Clin Immunol 2007; 119: pp. 1072-1078.
17. Woodhouse N., Wild J.M., Paley M.N., et. al.: Combined helium-3/proton magnetic resonance imaging measurement of ventilated lung volumes in smokers compared to never-smokers. J Magn Reson Imaging 2005; 21: pp. 365-369.
18. NIH-NHLBI. Expert panel report: guidelines for the diagnosis and management of asthma. EPR-Update 2002 of NIH Publication 97-4051. Volume 2002: NIH/NHLBI; 2002.
19. Moore W.C., Bleecker E.R., Curran-Everett D., et. al.: Characterization of the severe asthma phenotype by the National Heart, Lung, and Blood Institute’s Severe Asthma Research Program. J Allergy Clin Immunol 2007; 119: pp. 405-413.
20. Miller M.R., Hankinson J., Brusasco V., et. al.: Standardisation of spirometry. Eur Respir J 2005; 26: pp. 319-338.
21. Wanger J., Clausen J.L., Coates A., et. al.: Standardisation of the measurement of lung volumes. Eur Respir J 2005; 26: pp. 511-522.
22. Hankinson J.L., Odencrantz J.R., Fedan K.B.: Spirometric reference values from a sample of the general U.S. population. Am J Respir Crit Care Med 1999; 159: pp. 179-187.
23. Stocks J., Quanjer P.H.: Reference values for residual volume, functional residual capacity and total lung capacity. ATS Workshop on Lung Volume Measurements. Official Statement of The European Respiratory Society. Eur Respir J 1995; 8: pp. 492-506.
24. Lung function testing: selection of reference values and interpretative strategies. Am Rev Respir Dis 1991; 144: pp. 1202-1218.
25. Miller G.W., Altes T.A., Brookeman J.R., et. al.: Hyperpolarized 3He lung ventilation imaging with B1-inhomogeneity correction in a single breath-hold scan. Magma 2004; 16: pp. 218-226.
26. Salerno M., Altes T., Brookeman J., et. al.: Dynamic spiral MRI of pulmonary gas flow using hyperpolarized 3 He: preliminary studies in healthy and diseased lungs. Magn Reson Med 2001; 46: pp. 667-677.
27. Wild J., Paley M., Kasuboski L., et. al.: Dynamic radial projection MRI of inhaled hyperpolarized 3 He gas. Magn Reson Med 2003; 49: pp. 991-997.
28. Holmes J, O’Halloran R, Brodsky E, et al. 3D Hyperpolarized He-3 MRI of ventilation using a multi-echo projection acquisition. Magn Reson Med. In press.