
Rationale and Objectives
The objectives of this study were to investigate the changes in compartment-specific subchondral bone marrow lipids of femoral–tibial bone in acute anterior cruciate ligament (ACL)-injured patients compared to that of healthy volunteers and patients with osteoarthritis (OA) (Kellgren–Lawrence [KL] grade 2–3).
Materials and Methods
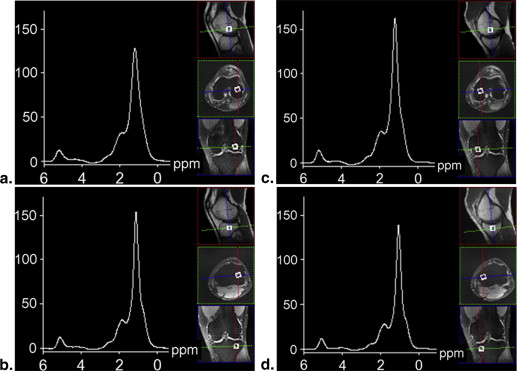
A total of 55 subjects were recruited in the study and subdivided into three subgroups: 17 healthy controls (4 females, 13 males; mean age = 41 ± 16, age range 24–78 years), 17 patients with acute ACL injury (3 females, 14 males; mean age = 30 ± 11, age range 18–61 years), and 21 patients with KL2–3 OA (12 females, 9 males; mean age = 65 ± 12, age range 44–89 years). Routine clinical proton density–weighted fast spin echo images in sagittal (without fat saturation), axial, and coronal (fat saturation) planes were acquired on a 3 T clinical scanner for cartilage morphology using Whole-Organ Magnetic Resonance Imaging Score grading. A voxel of 10 × 10 × 10 mm 3 was positioned in the medial and lateral compartments of the tibia and femur for proton magnetic resonance spectroscopy measurements using the single voxel stimulated echo acquisition mode pulse sequence. All proton magnetic resonance data were processed with Java-based magnetic resonance user interface. Wilcoxon rank sum test and mixed model two-way analysis of variance were performed to determine significant differences between different compartments and examine the effect of ACL injury, OA grade and compartment, and their interactions.
Results
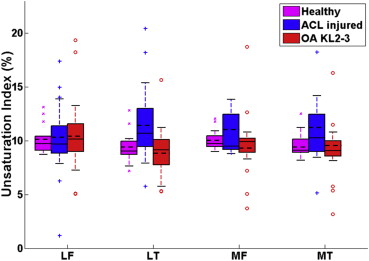
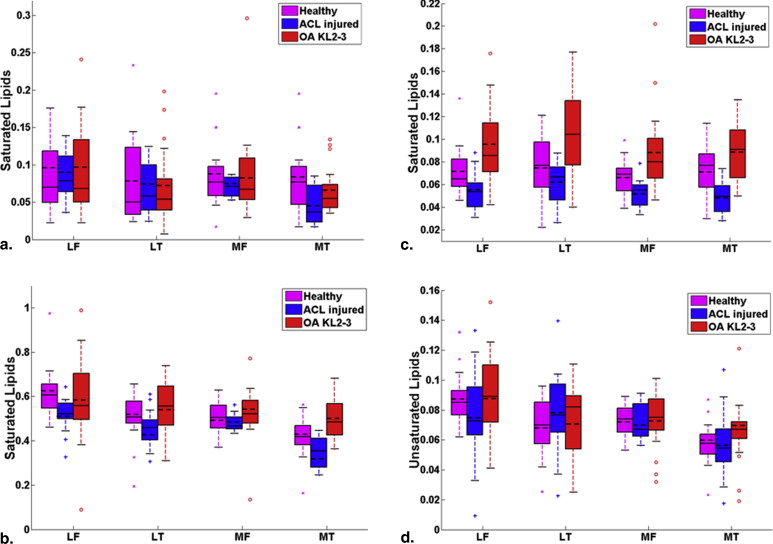
The index of unsaturation in lateral tibial compartment in ACL-injured patients was significantly higher ( P < .05) than all compartments except lateral femoral in patients with KL2–3 OA. Significantly lower values ( P < .05) were also identified in saturated lipids at 2.03 ppm in all compartments in ACL-injured patients than those of all compartments in patients with KL2–3 OA.
Conclusions
The preliminary results suggest that the indices of unsaturation in the lateral tibial compartment and the peaks of saturated lipids at 1.3 and 2.03 ppm in medial tibial compartment may be clinically useful to characterize subchondral bone marrow among healthy controls, acute ACL-injured patients, and patients with OA.
Single voxel spectroscopy is a simple commonly used technique for in vivo examination of metabolites within a small volume of tissue. This technique provides a powerful noninvasive and nondestructive chemical assessment tool for studying vertebral body bone marrow , evaluating the metabolites and biochemical profiles in gliomas and other human brain tumors , and investigating the lipid metabolism of human skeletal muscles .
Anterior cruciate ligament (ACL) injury is associated with increased risk for the development of posttraumatic knee osteoarthritis (OA) 10–20 years after the injury . Before the onset of structural changes, the cartilage tissue is subject to molecular modifications within the cartilage matrix . OA is the main cause of mobility-related disability in elderly persons . Although cartilage loss is the leading pathologic feature of OA, abnormal bone has been documented as another possible etiology . Felson et al. have revealed that bone marrow edema-like (BMEL) lesions are a potential risk factor for structural deterioration in knee OA, and BMEL lesions strongly correlate with the presence of pain in patients with OA. On the other hand, significantly elevated water and unsaturated lipids, and decreased saturated lipids are seen in BMEL lesions that are subjacent to areas of cartilage degeneration in OA . Other literature has indicated that some weight-bearing joints such as the knee and hip suffering from OA resulted from increased joint mechanical loading, and some possible risk factors such as obesity and knee pain because of previous injury may play an important role in the process of OA .
Get Radiology Tree app to read full this article<
Materials and methods
Water Phantom for Normalization
Get Radiology Tree app to read full this article<
Human Subjects
Get Radiology Tree app to read full this article<
Table 1
Characteristics of Human Subjects (Healthy, ACL-injured, and KL2–3 OA)
Subject Group and Characteristic Healthy Controls ACL-injured Patients Patients with OA (KL2–3) All subjects No. of subjects 17 17 21 Age (years) ∗ 41 ± 16 30 ± 11 65 ± 12 BMI (kg/m 2 ) 25.0 ± 2.7 26.1 ± 4.2 25.0 ± 3.4 Total WORMS † 2.6 ± 6.9 1.7 ± 1.4 13.5 ± 11.5 Female subjects No. of subjects 4 3 12 Age (years) 38 ± 15 33 ± 8 63 ± 13 Age range (years) 24–59 24–38 44–89 Male subjects No. of subjects 13 14 9 Age (years) 41 ± 17 29 ± 12 68 ± 11 Age range (years) 25–78 18–61 46–80
ACL, anterior cruciate ligament; BMI, body mass index; KL2–3, Kellgren–Lawrence grade 2–3; OA, osteoarthritis; WORMS, Whole-Organ Magnetic Resonance Imaging Score.
Get Radiology Tree app to read full this article<
Get Radiology Tree app to read full this article<
Get Radiology Tree app to read full this article<
Get Radiology Tree app to read full this article<
Imaging Hardware
Get Radiology Tree app to read full this article<
MRI and MRS
Get Radiology Tree app to read full this article<
Get Radiology Tree app to read full this article<
Data Analysis and Spectral Fitting
Get Radiology Tree app to read full this article<
Get Radiology Tree app to read full this article<
Get Radiology Tree app to read full this article<
I(0.9ppm)I(phantom),I(1.3ppm)I(phantom),I(2.03ppm)I(phantom),I(5.31ppm)I(phantom). I
(
0.9
ppm
)
I
(
phantom
)
,
I
(
1.3
ppm
)
I
(
phantom
)
,
I
(
2.03
ppm
)
I
(
phantom
)
,
I
(
5.31
ppm
)
I
(
phantom
)
.
Get Radiology Tree app to read full this article<
Get Radiology Tree app to read full this article<
U=I(5.31ppm)I(5.31ppm)+I(1.3ppm)+I(2.03ppm)+I(0.9ppm). U
=
I
(
5.31
ppm
)
I
(
5.31
ppm
)
+
I
(
1.3
ppm
)
+
I
(
2.03
ppm
)
+
I
(
0.9
ppm
)
.
Get Radiology Tree app to read full this article<
Get Radiology Tree app to read full this article<
Get Radiology Tree app to read full this article<
Get Radiology Tree app to read full this article<
Results
Get Radiology Tree app to read full this article<
Get Radiology Tree app to read full this article<
Table 2
The mean ± SD of Each Study Endpoint within Each Subject Group
Compartment Measure Healthy ACL-injured OA KL2–3P Values Mean ± SD Mean ± SD Mean ± SD ANOVA ANCOVA LF Sat 0.9 ppm 0.099 ± 0.083 0.086 ± 0.030 0.092 ± 0.057 .7994 .8414 Sat 1.3 ppm 0.617 ± 0.116 0.518 ± 0.074 0.589 ± 0.192 .0116 .0539 Sat 2.03 ppm 0.071 ± 0.022 0.054 ± 0.016 0.095 ± 0.031<.0001 .0659 Unsat 5.31 ppm 0.088 ± 0.017 0.075 ± 0.031 0.088 ± 0.028 .2820 .3844 UI ∗ 0.101 ± 0.013 0.101 ± 0.036 0.105 ± 0.035 .9027 .9796 LT Sat 0.9 ppm 0.076 ± 0.058 0.071 ± 0.034 0.071 ± 0.049 .9495 .6127 Sat 1.3 ppm 0.508 ± 0.112 0.453 ± 0.083 0.554 ± 0.121 .0192 .0961 Sat 2.03 ppm 0.077 ± 0.027 0.061 ± 0.018 0.104 ± 0.037<.0001 .3376 Unsat 5.31 ppm 0.068 ± 0.019 0.078 ± 0.027 0.073 ± 0.025 .4864 .5132 UI ∗ 0.093 ± 0.013 0.117 ± 0.037 0.090 ± 0.024 .0322 .0757 MF Sat 0.9 ppm 0.083 ± 0.042 0.072 ± 0.012 0.085 ± 0.056 .5922 .2533 Sat 1.3 ppm 0.504 ± 0.071 0.480 ± 0.037 0.525 ± 0.116 .2935 .1708 Sat 2.03 ppm 0.066 ± 0.016 0.053 ± 0.011 0.089 ± 0.036<.0001.0004 Unsat 5.31 ppm 0.073 ± 0.011 0.071 ± 0.011 0.074 ± 0.019 .8677 .3500 UI ∗ 0.100 ± 0.009 0.106 ± 0.019 0.097 ± 0.028 .3645 .2651 MT Sat 0.9 ppm 0.080 ± 0.044 0.046 ± 0.024 0.063 ± 0.030 .0146 .0317 Sat 1.3 ppm 0.420 ± 0.091 0.350 ± 0.068 0.495 ± 0.091<.0001.0004 Sat 2.03 ppm 0.073 ± 0.021 0.049 ± 0.014 0.089 ± 0.025<.0001.0021 Unsat 5.31 ppm 0.058 ± 0.014 0.057 ± 0.022 0.068 ± 0.026 .2895 .3001 UI ∗ 0.095 ± 0.011 0.112 ± 0.038 0.095 ± 0.035 .2387 .2744
ACL, anterior cruciate ligament; ANOVA, analysis of variance; ANCOVA, analysis of covariance; KL2–3, Kellgren–Lawrence grade 2–3; LF, lateral femoral; LT, lateral tibial; MF, medial femoral; MT, medial tibial; OA, osteoarthritis; Sat, saturated; SD, standard deviation; Unsat, unsaturated; UI, index of unsaturation.
Each P value is from the composite test of group differences as determined by ANOVA or ANCOVA. P values are shown in bold italic font when significant at the Bonferroni-corrected level of 0.0056.
Get Radiology Tree app to read full this article<
Table 3
Tukey-corrected P Values from ANOVA and ANCOVA to Pairwise Compare Subject Groups in Terms of Each Endpoint without and with Adjustment for Age, Gender, and BMI, Respectively
Compartment Measure Healthy versus ACL-injured Healthy versus OA KL2–3 ACL-injured versus OA KL2–3 ANOVA ANCOVA ANOVA ANCOVA ANOVA ANCOVA MF Sat 2.03 ppm ∗ .0115.0133.0207.0235.0005.0004 MT Sat 1.3 ppm.0167.0388.0444.0372.0004<.0001 Sat 2.03 ppm.0060.0010 .4323 .0812.0070<.0001
ACL, anterior cruciate ligament; ANOVA, analysis of variance; ANCOVA, analysis of covariance; KL2–3, Kellgren–Lawrence grade 2–3; MF, medial femoral; MT, medial tibial; OA, osteoarthritis; Sat, saturated.
Results are provided only for endpoints showing a significant composite test for group differences from both ANOVA and ANCOVA.
Get Radiology Tree app to read full this article<
Get Radiology Tree app to read full this article<
Get Radiology Tree app to read full this article<
Get Radiology Tree app to read full this article<
Assessment of Index of Unsaturation
Get Radiology Tree app to read full this article<
Get Radiology Tree app to read full this article<
Get Radiology Tree app to read full this article<
Assessment of Saturated and Unsaturated Lipids
Get Radiology Tree app to read full this article<
Get Radiology Tree app to read full this article<
Get Radiology Tree app to read full this article<
Get Radiology Tree app to read full this article<
Get Radiology Tree app to read full this article<
Get Radiology Tree app to read full this article<
Discussion
Get Radiology Tree app to read full this article<
Get Radiology Tree app to read full this article<
Get Radiology Tree app to read full this article<
Get Radiology Tree app to read full this article<
Get Radiology Tree app to read full this article<
Conclusions
Get Radiology Tree app to read full this article<
Acknowledgments
Get Radiology Tree app to read full this article<
References
1. Li X., Ma B.C., Bolbos R.I., et. al.: Quantitative assessment of bone marrow edema-like lesion and overlying cartilage in knees with osteoarthritis and anterior cruciate ligament tear using MR imaging and spectroscopic imaging at 3 Tesla. J Magn Reson Imaging 2008; 28: pp. 453-461.
2. Yeung D.K., Griffith J.F., Antonio G.E., et. al.: Osteoporosis is associated with increased marrow fat content and decreased marrow fat unsaturation: a proton MR spectroscopy study. J Magn Reson Imaging 2005; 22: pp. 279-285.
3. Barker P.B., Hearshen D.O., Boska M.D.: Single-voxel proton MRS of the human brain at 1.5T and 3.0T. Magn Reson Med 2001; 45: pp. 765-769.
4. Krssak M., Mlynarik V., Meyerspeer M., et. al.: 1H NMR relaxation times of skeletal muscle metabolites at 3 T. Magn Reson Mater Phy 2004; 16: pp. 155-159.
5. Machann J., Stefan N., Schick F.: (1)H MR spectroscopy of skeletal muscle, liver and bone marrow. Eur J Radiol 2008; 67: pp. 275-284.
6. Boesch C., Slotboom J., Hoppeler H., et. al.: In vivo determination of intra-myocellular lipids in human muscle by means of localized 1H-MR-spectroscopy. Magn Reson Med 1997; 37: pp. 484-493.
7. Schick F., Eismann B., Jung W.I., et. al.: Comparison of localized proton NMR signals of skeletal muscle and fat tissue in vivo : two lipid compartments in muscle tissue. Magn Reson Med 1993; 29: pp. 158-167.
8. Wang L., Salibi N., Wu Y., et. al.: Relaxation times of skeletal muscle metabolites at 7T. J Magn Reson Imaging 2009; 29: pp. 1457-1464.
9. Li X., Kuo D., Theologis A., et. al.: Cartilage in anterior cruciate ligament–reconstructed knees: MR imaging T1 ρ and T2—initial experience with 1-year follow-up. Radiology 2011; 258: pp. 505-514.
10. Neuman P., Tjörnstrand J., Svensson J., et. al.: Longitudinal assessment of femoral knee cartilage quality using contrast enhanced MRI (dGEMRIC) in patients with anterior cruciate ligament injury—comparison with asymptomatic volunteers. Osteoarthritis Cartilage 2011; 19: pp. 977-983.
11. Felson D.T., McLaughlin S., Goggins J., et. al.: Bone marrow edema and its relation to progression of knee osteoarthritis. Ann Intern Med 2003; 139: pp. 330-336.
12. Sowers M.R., Karvonen-Gutierrez C.A.: The evolving role of obesity in knee osteoarthritis. Curr Opin Rheumatol 2010; 22: pp. 533-537.
13. Hu P.F., Bao J.P., Wu L.D.: The emerging role of adipokines in osteoarthritis: a narrative review. Mol Biol Rep 2011; 38: pp. 873-878.
14. Dumond H., Presle N., Terlain B., et. al.: Evidence for a key role of leptin in osteoarthritis. Arthritis Rheum 2003; 48: pp. 3118-3129.
15. Wang L., Salibi N., Chang G., et. al.: Assessment of subchondral bone marrow lipids in healthy controls and mild osteoarthritis patients at 3T. NMR Biomed 2012; 25: pp. 545-555.
16. Michaelis T., Merboldt K.D., Bruhn H., et. al.: Absolute concentrations of metabolites in the adult human brain in vivo : quantification of localized proton MR spectra. Radiology 1993; 187: pp. 219-227.
17. Soher B.J., van Zijl P.C., Duyn J.H., et. al.: Quantitative proton MR spectroscopic imaging of the human brain. Magn Reson Med 1996; 35: pp. 356-363.
18. Kellgren J.H., Lawrence J.S.: Radiological assessment of osteo-arthrosis. Ann Rheum Dis 1957; 16: pp. 494-502.
19. Friedrich K.M., Shepard T., de Oliveira V.S., et. al.: T2 measurements of cartilage in osteoarthritis patients with meniscal tears. Am J Roentgenol 2009; 193: pp. W411-W415.
20. Peterfy C.G., Guermazi A., Zaim S., et. al.: Whole-Organ Magnetic Resonance Imaging Score (WORMS) of the knee in osteoarthritis. Osteoarthr Cartilage 2004; 12: pp. 177-190.
21. http://www.mrui.uab.es/mrui/mrui_homePage.shtml .
22. Vanhamme L., van den Boogaart A., Van Huffel S.: Improved method for accurate and efficient quantification of MRS data with use of prior knowledge. J Magn Reson 1997; 129: pp. 35-43.
23. Hamilton G., Middleton M.S., Bydder M., et. al.: Effect of PRESS and STEAM sequences on magnetic resonance spectroscopic liver fat quantification. J Magn Reson Imaging 2009; 30: pp. 145-152.
24. Machann J., Thamer C., Schnoedt B., et. al.: Hepatic lipid accumulation in healthy subjects: a comparative study using spectral fat-selective MRI and volume-localized 1H-MR spectroscopy. Magn Reson Med 2006; 55: pp. 913-917.
25. Thomas M.A., Hattori N., Umeda M., et. al.: Evaluation of two-dimensional L-COSY and JPRESS using a 3 T MRI scanner: from phantoms to human brain in vivo. NMR Biomed 2003; 16: pp. 245-251.
26. Roos H., Adalberth T., Dahlberg L., et. al.: Osteoarthritis of the knee after injury to the anterior cruciate ligament or meniscus: the influence of time and age. Osteoarthritis Cartilage 1995; 3: pp. 261-267.
27. Bredella M.A., Torriani M., Ghomi R.H., et. al.: Vertebral bone marrow fat is positively associated with visceral fat and inversely associated with IGF-1 in obese women. Obesity 2011; 19: pp. 49-53.
28. Aspden R., Scheven B., Hutchison J.: Osteoarthritis as a systemic disorder including stromal cell differentiation and lipid metabolism. Lancet 2001; 357: pp. 1118-1120.
29. Sanders T.G., Medynski M.A., Feller J.F., et. al.: Bone contusion patterns of the knee at MR imaging: footprint of the mechanism of injury. RadioGraphics 2000; 20: pp. S135-S151.
30. Chang G., Pakin S.K., Schweitzer M.E., et. al.: Adaptations in trabecular bone microarchitecture in Olympic athletes determined by 7T MRI. J Magn Reson Imaging 2008; 27: pp. 1089-1095.