
Rationale and Objectives
This study aimed to evaluate the potential role of computed tomography texture analysis (CTTA) of arterial and portal-venous enhancement phase image data for prediction and accurate assessment of response of hepatocellular carcinoma undergoing drug-eluting bead transarterial chemoembolization (TACE) by comparison to liver perfusion CT (PCT).
Materials and Methods
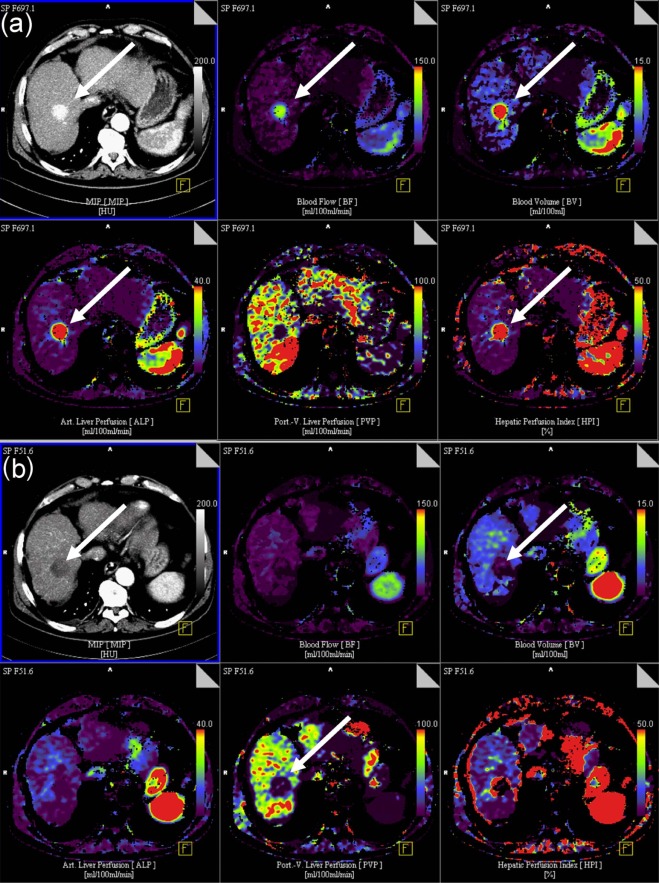
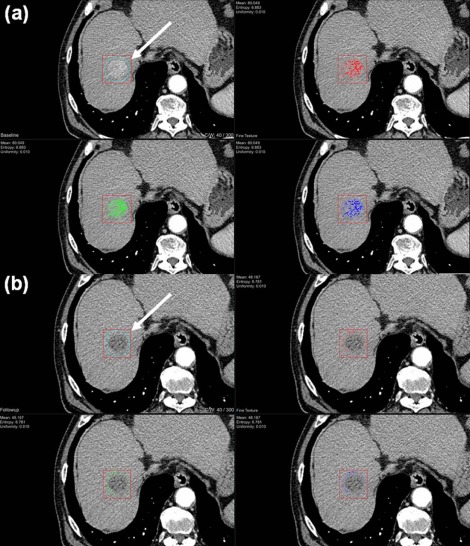
Twenty-eight patients (27 male; mean age 67.2 ± 10.4) with 56 hepatocellular carcinoma-typical liver lesions were included. Arterial and portal-venous phase CT data obtained before and after TACE with a mean time of 39.93 ± 62.21 days between examinations were analyzed. TACE was performed within 48 hours after first contrast-enhanced CT. CTTA software was a prototype. CTTA analysis was performed blinded (for results) by two observers separately. Combined results of modified Response Evaluation Criteria In Solid Tumors (mRECIST) and PCT of the liver were used as the standard of reference. Time to progression was additionally assessed for all patients. CTTA parameters included heterogeneity, intensity, average, deviation, skewness, and entropy of co-occurrence. Each parameter was compared to those of PCT (blood flow [BF], blood volume, arterial liver perfusion [ALP], portal-venous perfusion, and hepatic perfusion index) measured before and after TACE.
Results
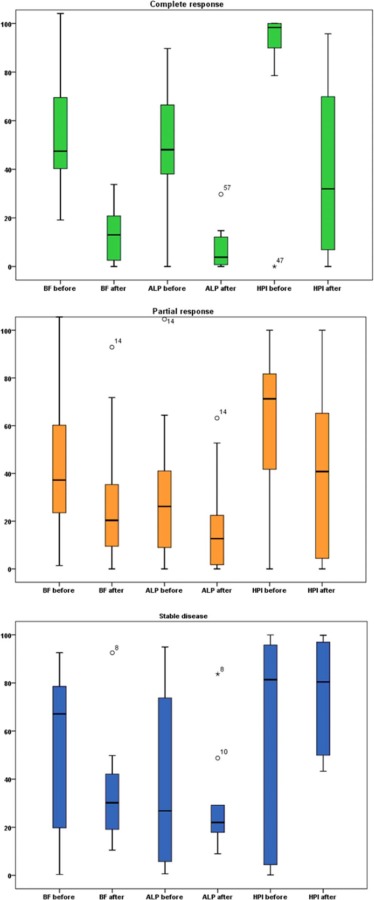
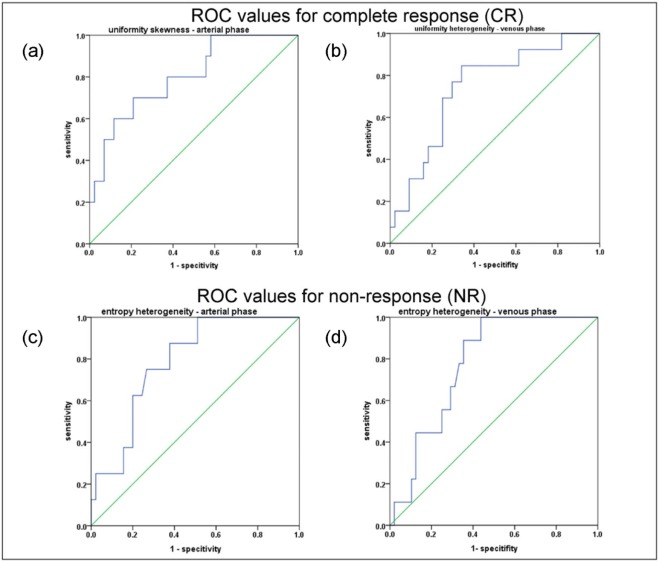
mRECIST + PCT yielded 28.6% complete response (CR), 42.8% partial response, and 28.6% stable disease. Significant correlations were registered in the arterial phase in CR between changes in mean heterogeneity and BF ( P = .004, r = −0.815), blood volume ( P = .002, r = −0.851), and ALP ( P = .002, r = −0.851), respectively. In the partial response group, changes in mean heterogeneity correlated with changes in ALP ( P = .003) and to a lesser degree with hepatic perfusion index ( P = .027) in the arterial phase. In the stable disease group, BF correlated with entropy of nonuniformity ( P = .010). In the portal-venous phase , no statistically significant correlations were registered in all groups. Receiver operating characteristic analysis of CTTA parameters yielded predictive cutoff values for CR in the arterial contrast-enhanced CT phase for uniformity of skewness (sensitivity: 90.0%; specificity: 45.8%), and in the portal-venous phase for uniformity of heterogeneity (sensitivity: 92.3%; specificity: 81.8%).
Conclusions
Significant correlations exist between CTTA parameters and those derived from PCT both in the pre- and the post-TACE settings, and some of them have predictive value for TACE midterm outcome.
Introduction
Hepatocellular carcinoma (HCC) is one of the leading causes of death in industrialized countries . For patients with stage B of the Barcelona classification of liver cancer, drug-eluting bead transarterial chemoembolization (DEB-TACE) as a first-line treatment is more beneficial over conservative therapy regimes . Specifically, drug-eluting beads are used to occlude the blood flow (BF) to tumor tissue and deliver a locally sustained drug dose .
Response to TACE can be variable, and therefore, prediction of response is desirable . Multiphase contrast-enhanced computed tomography (CECT) is frequently used for response monitoring and surveillance; however, variable tumor vascularity of HCCs can limit the accuracy of response assessment following TACE. Wash-in and wash-out enhancement patterns as well as faint tumor enhancement may be difficult to delineate, and the optimal delay following intravenous contrast administration may be difficult to predict .
Get Radiology Tree app to read full this article<
Get Radiology Tree app to read full this article<
Materials and Methods
Study Design
Get Radiology Tree app to read full this article<
Patient Characteristics
Get Radiology Tree app to read full this article<
Table 1
Patient Characteristics
Median age (range) at time point of first TACE 67.2 ± 10.4 y (48-80 y) Sex, male/female 27/1 Median age at first diagnosis of HCC 65.6 ± 10.7 y Underlying liver diseases_n_ Alcohol-induced cirrhosis 7 Hepatitis C 7 Hepatitis B 5 Cryptogenic cirrhosis 9 Hemochromatosis 1
HCC, hepatocellular carcinoma; TACE, transarterial chemoembolization.
Get Radiology Tree app to read full this article<
Get Radiology Tree app to read full this article<
CT Technique
Get Radiology Tree app to read full this article<
Chemoembolization Technique
Get Radiology Tree app to read full this article<
Imaging Analysis
Get Radiology Tree app to read full this article<
Get Radiology Tree app to read full this article<
Texture Analysis
Get Radiology Tree app to read full this article<
Statistics
Get Radiology Tree app to read full this article<
Results
Patient Characteristics
Get Radiology Tree app to read full this article<
Get Radiology Tree app to read full this article<
Time to Progression
Get Radiology Tree app to read full this article<
Response Classification According to mRECIST + PCT
Get Radiology Tree app to read full this article<
Get Radiology Tree app to read full this article<
Get Radiology Tree app to read full this article<
Table 2
Changes in PCT Parameters Before and After TACE Therapy
Before TACE After TACE_P_ Stable Disease ( n = 9) Partial Response ( n = 34) Complete Response ( n = 13) Stable Disease ( n = 9) Partial Response ( n = 34) Complete Response ( n = 13) Blood flow (BF)
mL/100 mL/min 25.29
11.39 40.12 ± 14.90 54.10 ± 89.84 32.09
21.98 28.59 ± 14.63 12.79 ± 6.13 .109 .018 .002 \* Blood volume (BV)
mL/100 mL 6.91
3.28 10.24 ± 3.11 11.11 ± 1.81 8.53
2.67 6.73 ± 3.11 3.49 ± 1.22 .079 .013 .002 \* ALP
mL/100 mL/min 39.16
14.46 29.94 ± 14.76 47.55 ± 5.91 25.14
9.90 16.15 ± 10.54 7.07 ± 3.12 .301 .001 \* .002 \* PVP
mL/100 mL/min 46.97
51.21 25.55 ± 23.11 21.60 ± 10.60 33.59
30.42 33.39 ± 25.89 17.00 ± 10.50 .255 .025 .099 HPI
% 41.50
21.23 63.93 ± 27.93 81.55 ± 6.30 58.58
23.22 45.82 ± 28.81 39.54 ± 20.12 <.001 \* <.001 \* .003 \*
ALP, arterial liver perfusion; BF, blood flow; BV, blood volume; HPI, hepatic perfusion index; PCT, perfusion computed tomography; PVP, portal-venous perfusion; TACE, transarterial chemoembolization.
Get Radiology Tree app to read full this article<
Get Radiology Tree app to read full this article<
Response Categories According to CT Texture Analysis (CTTA)
Get Radiology Tree app to read full this article<
Get Radiology Tree app to read full this article<
Get Radiology Tree app to read full this article<
Table 3
Changes in CTTA After TACE in the Arterial-Phase Using a Fine Filter
Complete Response Before TACE After TACE_P__P__P_ Mean Entropy Uniformity Mean Entropy Uniformity Heterogeneity −0.0714 6.9693 0.0094 0.2555 6.9867 0.0092.017\*.445.508_ Intensity 81.7702 6.7715 0.0108 58.7724 6.7897 0.0103_.008\*.767.767 Average 81.2979 5.3542 0.0306 60.2476 5.5317 0.0278.008\*.139.374_ Deviation 23.9829 3.7938 0.0861 23.1695 3.8177 0.0845_.285.721.959_ Skewness 0.0004 3.7464 0.2169 −0.0004 4.1808 0.1525_.508.114.114_ Entropy (co-occurrence matrix) 0.9249 6.2843 0.0277 0.7539 6.2959 0.0333_.139.799__.799
Partial Response Before TACE After TACE_P__P__P_ Mean Entropy Uniformity Mean Entropy Uniformity Heterogeneity −1.3838 7.1744 0.0080 −0.6728 7.1496 0.0082.432.870.935 Intensity 71.5400 6.7747 0.0105 67.6832 6.7994 0.0102.007\*.670.844_ Average 69.7253 5.2310 0.0341 66.3639 5.0800 0.0376_.009\*.057.120 Deviation 26.1459 3.7326 0.0881 26.1588 3.7854 0.0860.647.523.368 Skewness 0.0017 4.6860 0.1169 −0.0009 4.5422 0.1187.140.756.952 Entropy (co-occurrence matrix) 0.9228 6.9699 0.0129 1.0052 7.0840 0.0101.534.974.819
Stable Disease Before TACE After TACE_P__P__P_ Mean Entropy Uniformity Mean Entropy Uniformity Heterogeneity −1.3838 7.1744 0.0080 −0.6728 7.1496 0.0082.889.484.401 Intensity 71.5400 6.7747 0.0105 67.6832 6.7994 0.0102.327.575.263 Average 69.7253 5.2310 0.0341 66.3639 5.0800 0.0376.327.093.093 Deviation 26.1459 3.7326 0.0881 26.1588 3.7854 0.0860.999.484.327 Skewness 0.0017 4.6860 0.1169 0.0009 4.5422 0.1187.484.208.779 Entropy (co-occurrence matrix) 0.92283 6.9699 0.0129 1.0052 7.0840 0.0101.123.889.779
CTTA, computed tomography texture analysis; TACE, transarterial chemoembolization.
Get Radiology Tree app to read full this article<
Get Radiology Tree app to read full this article<
Get Radiology Tree app to read full this article<
Table 4
Changes in CTTA After TACE in the Portal-Venous Phase Using a Fine Filter
Complete Response Before TACE After TACE_P__P__P_ Mean Entropy Uniformity Mean Entropy Uniformity Heterogeneity 0.04810 6.8835 0.0101 0.6032 6.7937 0.0111.009\*.196.221_ Intensity 88.7398 6.8727 0.0100 75.0981 6.9550 0.0093_.009\*.133.116 Average 88.3672 5.4736 0.0283 75.6661 5.7666 0.2445.009\*.039.101_ Deviation 25.5472 3.8782 0.0808 25.7618 3.9814 0.0764_.807.279.345_ Skewness −0.0005 3.9444 0.1891 −0.0013 3.9123 0.1798_.600.552.507_ Entropy (co-occurrence matrix) 01.0108 6.6000 0.0184 0.7126 6.5603 0.0300_.005\*.701.807
Partial Response Before TACE After TACE_P__P__P_ Mean Entropy Uniformity Mean Entropy Uniformity Heterogeneity 0.3883 7.1385 0.0082 0.2210 7.1474 0.0081.922.413.280 Intensity 76.3329 6.8556 0.0098 73.6118 6.8440 0.0098.185.159.196 Deviation 76.6448 5.1236 0.0347 73.6214 5.0375 0.0374.201.004\*.003\* Average 26.0871 3.7424 0.0871 25.9767 3.7217 0.0884.196.028.013 Skewness −0.0079 4.2328 0.1554 −0.0015 4.5215 0.1249.719.092.252 Entropy (co-occurrence matrix) 0.9062 6.8258 0.0160 0.8034 6.7890 0.0221.909.806.731
Stable Disease Before TACE After TACE_P__P__P_ Heterogeneity 0.3883 7.1385 0.0082 02210 7.147 0.0081.260.767.767 Intensity 76.3329 6.8556 0.0098 73.6118 6.8440 0.0098.260.767.859 Average 76.6448 5.1236 0.0347 73.6214 5.0375 0.0374.173.110.051 Deviation 26.0871 3.7424 0.0871 25.9767 3.7217 0.0884.859.678.767 Skewness −0.0079 4.2328 0.1554 −0.0015 4.5215 0.1249.139.051.214 Entropy (co-occurrence matrix) 0.9062 6.8258 0.0160 0.8034 6.7890 0.0221.314.441.678
CTTA, computed tomography texture analysis; TACE, transarterial chemoembolization.
Get Radiology Tree app to read full this article<
Get Radiology Tree app to read full this article<
The Course of Alpha Fetoprotein
Get Radiology Tree app to read full this article<
Correlations Between PCT and CTTA Parameters
Get Radiology Tree app to read full this article<
Get Radiology Tree app to read full this article<
Get Radiology Tree app to read full this article<
Prediction of HCC Response to DEB-TACE Based on CTTA Features
Get Radiology Tree app to read full this article<
Get Radiology Tree app to read full this article<
Get Radiology Tree app to read full this article<
Get Radiology Tree app to read full this article<
Table 5
Cutoff Values in CTTA (Before TACE) in Patients with Stable Disease (SD) After Therapy
ROC Values for Complete Response (CR) Texture analysis parameter
arterial phase Value Sensitivity 1-specitifity AUC_P_ 95% interval Uniformity skewness 0.1244 90.0% 45.8% 0.800 .003 \* 0.651–0.949 Texture analysis parameter
venous phase Value Sensitivity 1-specitifity AUC_P_ Uniformity heterogeneity 0.0083 92.3% 38.6% 0.741 .009 \* 0.600–0.895
ROC Values for Stable Disease (SD) Texture analysis parameter
arterial phase Value Sensitivity 1-specitifity AUC_P_ 95% interval Entropy heterogeneity 7.07 87.5% 62.2% 0.785 .011 \* 0.644–0.925 Texture analysis parameter
venous phase Value Sensitivity 1-specitifity AUC_P_ Entropy heterogeneity 7.0645 88.9 64.6 0.774 .010 \* 0.648–0.900
ROC Values for Complete Response (CR) Based on VPCT Texture analysis parameter
VPCT Value Sensitivity 1-specitifity AUC_P_ HPI 78.26 84.6 % 61.4% 0.734 .011 \* 0.555–0.914
AUC, area under the curve; CTTA, computed tomography texture analysis; HPI, hepatic perfusion index; VPCT, volume perfusion computed tomography; TACE, transarterial chemoembolization.
Get Radiology Tree app to read full this article<
Get Radiology Tree app to read full this article<
Prediction of Response to DEB-TACE Based on PCT Parameters
Get Radiology Tree app to read full this article<
Discussion
Get Radiology Tree app to read full this article<
Get Radiology Tree app to read full this article<
Get Radiology Tree app to read full this article<
Get Radiology Tree app to read full this article<
Get Radiology Tree app to read full this article<
Get Radiology Tree app to read full this article<
Get Radiology Tree app to read full this article<
Get Radiology Tree app to read full this article<
Get Radiology Tree app to read full this article<
Get Radiology Tree app to read full this article<
Get Radiology Tree app to read full this article<
Supplementary Data
Get Radiology Tree app to read full this article<
Table S1
Get Radiology Tree app to read full this article<
Get Radiology Tree app to read full this article<
Get Radiology Tree app to read full this article<
Table S2
Get Radiology Tree app to read full this article<
Get Radiology Tree app to read full this article<
Get Radiology Tree app to read full this article<
Table S3
Get Radiology Tree app to read full this article<
Get Radiology Tree app to read full this article<
References
1. Kaufmann S., Horger T., Oelker A., et. al.: Volume perfusion computed tomography (VPCT)-based evaluation of response to TACE using two different sized drug eluting beads in patients with nonresectable hepatocellular carcinoma: impact on tumor and liver parenchymal vascularisation. Eur J Radiol 2015; 84: pp. 2548-2554.
2. Ikeda K., Kumada H., Saitoh S., et. al.: Effect of repeated transcatheter arterial embolization on the survival time in patients with hepatocellular carcinoma. An analysis by the Cox proportional hazard model. Cancer 1991; 68: pp. 2150-2154.
3. Llovet J.M., Bru C., Bruix J.: Prognosis of hepatocellular carcinoma: the BCLC staging classification. Semin Liver Dis 1999; 19: pp. 329-338.
4. Llovet J.M., Real M.I., Montana X., et. al.: Arterial embolisation or chemoembolisation versus symptomatic treatment in patients with unresectable hepatocellular carcinoma: a randomised controlled trial. Lancet 2002; 359: pp. 1734-1739.
5. Syha R., Grozinger G., Grosse U., et. al.: C-arm computed tomography parenchymal blood volume measurement in evaluation of hepatocellular carcinoma before transarterial chemoembolization with drug eluting beads. Cancer Imaging 2015; 15: pp. 22.
6. Hinrichs J.B., Shin H.O., Kaercher D., et. al.: Parametric response mapping of contrast-enhanced biphasic CT for evaluating tumour viability of hepatocellular carcinoma after TACE. Eur Radiol 2016; 26: pp. 3447-3455.
7. Liu Q., Li A., Sun S., et. al.: The true role of mRECIST guideline: does it really estimate viable tumor or merely improve accuracy in hepatocellular carcinoma response evaluation?. J BUON 2014; 19: pp. 398-405.
8. Ganeshan B., Miles K.A., Young R.C., et. al.: Texture analysis in non-contrast enhanced CT: impact of malignancy on texture in apparently disease-free areas of the liver. Eur J Radiol 2009; 70: pp. 101-110.
9. Ganeshan B., Miles K.A., Young R.C., et. al.: Hepatic enhancement in colorectal cancer: texture analysis correlates with hepatic hemodynamics and patient survival. Acad Radiol 2007; 14: pp. 1520-1530.
10. Tourassi G.D.: Journey toward computer-aided diagnosis: role of image texture analysis. Radiology 1999; 213: pp. 317-320.
11. Ganeshan B., Miles K.A.: Quantifying tumour heterogeneity with CT. Cancer Imaging 2013; 13: pp. 140-149.
12. Ganeshan B., Burnand K., Young R., et. al.: Dynamic contrast-enhanced texture analysis of the liver: initial assessment in colorectal cancer. Invest Radiol 2011; 46: pp. 160-168.
13. Bezy-Wendling J., Kretowski M., Rolland Y., et. al.: Toward a better understanding of texture in vascular CT scan simulated images. IEEE Trans Biomed Eng 2001; 48: pp. 120-124.
14. Lencioni R., Llovet J.M.: Modified RECIST (mRECIST) assessment for hepatocellular carcinoma. Semin Liver Dis 2010; 30: pp. 52-60.
15. Lee D.H., Lee J.M., Klotz E., et. al.: Multiphasic dynamic computed tomography evaluation of liver tissue perfusion characteristics using the dual maximum slope model in patients with cirrhosis and hepatocellular carcinoma: a feasibility study. Invest Radiol 2016; 51: pp. 430-434.
16. Okada M., Kim T., Murakami T.: Hepatocellular nodules in liver cirrhosis: state of the art CT evaluation (perfusion CT/volume helical shuttle scan/dual-energy CT, etc.). Abdom Imaging 2011; 36: pp. 273-281.
17. Ng F., Ganeshan B., Kozarski R., et. al.: Assessment of primary colorectal cancer heterogeneity by using whole-tumor texture analysis: contrast-enhanced CT texture as a biomarker of 5-year survival. Radiology 2013; 266: pp. 177-184.
18. Skogen K., Ganeshan B., Good C., et. al.: Measurements of heterogeneity in gliomas on computed tomography relationship to tumour grade. J Neurooncol 2013; 111: pp. 213-219.
19. Nicolini A., Martinetti L., Crespi S., et. al.: Transarterial chemoembolization with epirubicin-eluting beads versus transarterial embolization before liver transplantation for hepatocellular carcinoma. J Vasc Interv Radiol 2010; 21: pp. 327-332.
20. Brown D.B., Cardella J.F., Sacks D., et. al.: Quality improvement guidelines for transhepatic arterial chemoembolization, embolization, and chemotherapeutic infusion for hepatic malignancy. J Vasc Interv Radiol 2009; 20: pp. S219-S226. S226.e1–10
21. Choi J., Shim J.H., Shin Y.M., et. al.: Clinical significance of the best response during repeated transarterial chemoembolization in the treatment of hepatocellular carcinoma. J Hepatol 2014; 60: pp. 1212-1218.
22. Nam H.C., Jang B., Song M.J.: Transarterial chemoembolization with drug-eluting beads in hepatocellular carcinoma. World J Gastroenterol 2016; 22: pp. 8853-8861.