
Rationale and Objectives
To investigate the effect of a newly developed computer-aided diagnosis (CAD) system on reader interpretation of breast lesions in automated three-dimensional (3D) breast ultrasound.
Materials and Methods
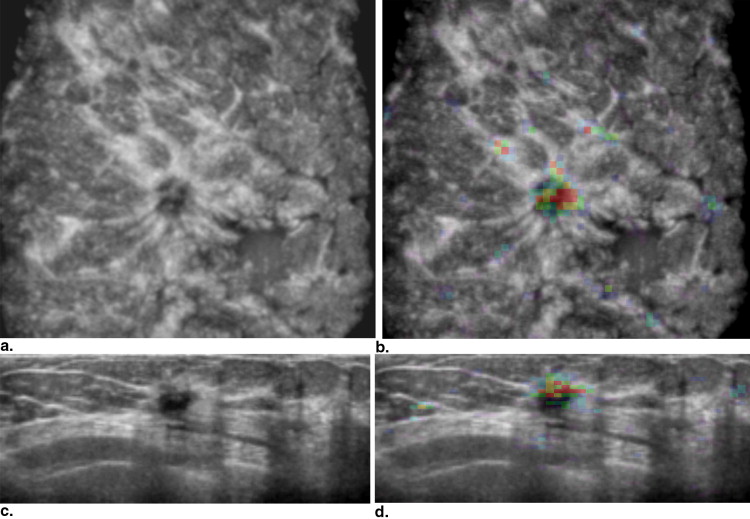
A CAD system was developed to differentiate malignant lesions from benign lesions including automated lesion segmentation in three dimensions; extraction of lesion features such as spiculation, margin contrast, and posterior acoustic behavior; and a classification stage. Eighty-eight patients with breast lesions were included for an observer study: 47 lesions were malignant and 41 were benign. Eleven readers (seven radiologists and four residents) read the cases with and without CAD. We compared the performance of readers with and without CAD using receiver operating characteristic (ROC) analysis.
Results
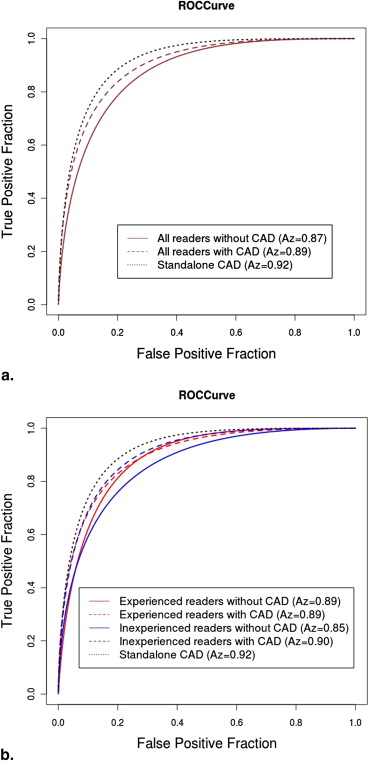
The CAD system had an area under the ROC curve (AUC) of 0.92 for discriminating benign and malignant lesions, whereas the unaided reader AUC ranged from 0.77 to 0.92. Mean performance of inexperienced readers improved when CAD was used (AUC = 0.85 versus 0.90; P = .007), whereas mean performance of experienced readers did not change with CAD (AUC = 0.89).
Conclusions
By using the CAD system for classification of lesions in automated 3D breast ultrasound, which on its own performed as good as the best readers, the performance of inexperienced readers improved while that of experienced readers remained unaffected.
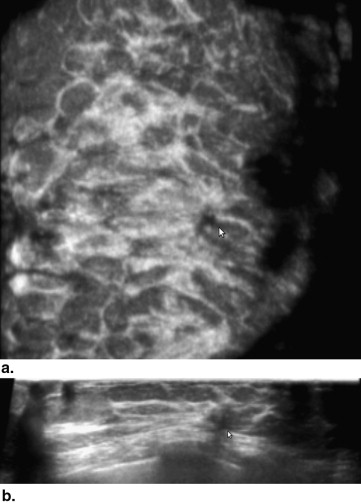
Mammography is the primary modality for breast cancer diagnosis and screening. However, the sensitivity for breast cancer in dense breasts is lower than that for fatty breasts . This reduced sensitivity is due to the fibroglandular and stromal tissues (dense tissues) having the same X-ray attenuation properties as tumors and thus both showing equally bright on mammographic images. This causes tumors to remain masked for radiologists and thus breast cancer to remain undetected. As approximately 35% to 40% of the screening population has dense breasts, the huge impact of this limitation of current-day breast cancer screening is evident. Currently in the United States, in five states (Connecticut, Texas, Virginia, New York, and California), a breast density notification law is implemented, increasing the demand for alternative screening technologies. To improve cancer detection in dense breasts, ultrasound can be used as an adjunct modality . Schaefer et al showed that compared with using mammography alone, by combining mammography and ultrasound, 15.9% extra breast cancers were revealed in dense breasts . However, conducting an exam with handheld ultrasound is cumbersome, user dependent, and time-consuming, and it has limitations of visualizing breasts in three-dimensional (3D) view. These disadvantages were alleviated with the introduction of automated 3D breast ultrasound (ABUS). ABUS provides a 3D view of the breast and allows reconstruction of coronal planes in which spiculation patterns associated with invasive breast cancers are often observed . These characteristic patterns cannot be observed well or are completely absent in two-dimensional (2D) ultrasound. Image acquisition of ABUS can be performed by nonradiologists in a standardized protocol, allowing batch reading by radiologists, as is common practice in screening. A potentially negative effect, however, may be an increase in the number of false-positive findings, either due to benign lesions or due to artifacts. Therefore, it is important to develop techniques to help radiologists to minimize the number of unnecessary recalls, by aiding them to distinguish between benign and malignant lesions.
Computer systems can aid radiologists in both the detection and diagnosis. A computer-aided detection system has the potential to help readers to quickly locate potential lesions and reduce the amount of missed lesions. A computer-aided diagnosis (CAD) system can help readers to assess the probability that a certain lesion is malignant, which in turn might reduce the amount of recalls and biopsies for benign lesions. A complete system should incorporates both functions, but they are developed independently. This report focuses on the classification task.
Get Radiology Tree app to read full this article<
Get Radiology Tree app to read full this article<
Materials and methods
Data Set
Get Radiology Tree app to read full this article<
Get Radiology Tree app to read full this article<
Get Radiology Tree app to read full this article<
Table 1
Number of Lesions of Different Histology Types in the Complete Data Set and Observer Study Data Set, Which Is a Subset of the Complete Data Set
Histology Information Complete Data Set Observer Study Data Set Malignant lesions Infiltrative ductal carcinoma 60 38 Ductal carcinoma in situ 3 1 Infiltrative lobular carcinoma 7 6 Other 15 2 Total 85 47 Benign lesions Cyst 47 9 Fibroadenoma 24 14 Fibrocystic change 24 11 Other 21 7 Total 116 41
Get Radiology Tree app to read full this article<
CAD System
Get Radiology Tree app to read full this article<
Get Radiology Tree app to read full this article<
Get Radiology Tree app to read full this article<
Get Radiology Tree app to read full this article<
Get Radiology Tree app to read full this article<
Get Radiology Tree app to read full this article<
Table 2
List of Features Used in Computer-Assisted Diagnosis
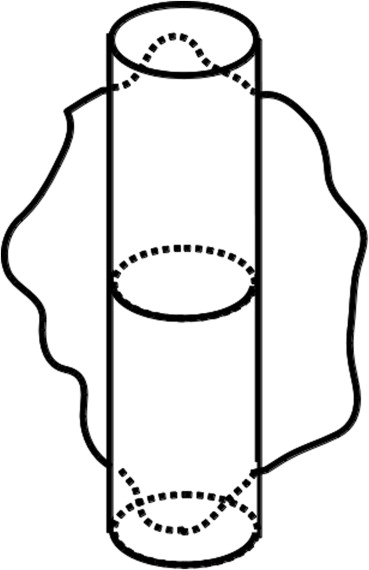
Average spiculation value of the lesion Volumetric height-to-width ratio Margin contrast Posterior acoustic behavior Entropy of intensities Dice’s coefficient Echogenicity Average spiculation value in a cylinder Average spiculation value of a upper segment in a cylinder Maximum average spiculation value among coronal slices in a cylinder Intensity variance inside the lesion Volume difference between lesion segmentation and the registered result (DF) Intensity variance of inner border of the lesion Lesion volume
Get Radiology Tree app to read full this article<
Get Radiology Tree app to read full this article<
Reader Study Design
Get Radiology Tree app to read full this article<
Get Radiology Tree app to read full this article<
Get Radiology Tree app to read full this article<
Get Radiology Tree app to read full this article<
Get Radiology Tree app to read full this article<
Data Analysis
Get Radiology Tree app to read full this article<
Get Radiology Tree app to read full this article<
Results
Get Radiology Tree app to read full this article<
Table 3
Area under the Receiver Operating Characteristic Curve Values of Performances of Readers without and with Computer-Assisted Diagnosis (CAD)
Reader Without CAD With CAD Experienced reader ( P = .55) Radiologist 1 0.91 0.90 Radiologist 4 0.87 0.86 Radiologist 6 0.92 0.91 Resident 1 0.87 0.92 Resident 3 0.86 0.90 Average 0.89 0.89 Inexperienced reader ( P = .007) Radiologist 2 0.92 0.93 Radiologist 3 0.83 0.86 Radiologist 5 0.86 0.88 Radiologist 7 0.86 0.90 Resident 2 0.77 0.81 Resident 4 0.89 0.95 Average 0.85 0.90 Reader average 0.87 0.89
Get Radiology Tree app to read full this article<
Get Radiology Tree app to read full this article<
Get Radiology Tree app to read full this article<
Discussion
Get Radiology Tree app to read full this article<
Get Radiology Tree app to read full this article<
Get Radiology Tree app to read full this article<
Get Radiology Tree app to read full this article<
Get Radiology Tree app to read full this article<
Get Radiology Tree app to read full this article<
Get Radiology Tree app to read full this article<
Acknowledgments
Get Radiology Tree app to read full this article<
Get Radiology Tree app to read full this article<
References
1. Pisano E.D., Hendrick R.E., Yaffe M.J., et. al.: Diagnostic accuracy of digital versus film mammography: exploratory analysis of selected population subgroups in DMIST. Radiology 2008; 246: pp. 376-383.
2. Kelly K.M., Dean J., Comulada W.S., et. al.: Breast cancer detection using automated whole breast ultrasound and mammography in radiographically dense breasts. Eur Radiol 2010; 20: pp. 734-742.
3. Berg W.A., Blume J.D., Cormack J.B., et. al.: Combined screening with ultrasound and mammography vs mammography alone in women at elevated risk of breast cancer. JAMA 2008; 299: pp. 2151-2163.
4. Schaefer F.K., Waldmann A., Katalinic A., et. al.: Influence of additional breast ultrasound on cancer detection in a cohort study for quality assurance in breast diagnosis—analysis of 102,577 diagnostic procedures. Eur J Radiol 2010; 20: pp. 1085-1092.
5. Rotten D., Levaillant J.M., Zerat L.: Analysis of normal breast tissue and of solid breast masses using three-dimensional ultrasound mammography. Ultrasound Obstet Gynecol 1999; 14: pp. 114-124.
6. Watermann D.O., Földi M., Hanjalic-Beck A., et. al.: Three-dimensional ultrasound for the assessment of breast lesions. Ultrasound Obstet Gynecol 2005; 25: pp. 592-598.
7. Taylor P., Potts H.W.W.: Computer aids and human second reading as interventions in screening mammography: two systematic reviews to compare effects on cancer detection and recall rate. Eur J Cancer 2008; 44: pp. 798-807.
8. Horsch K., Giger M.L., Vyborny C.J., et. al.: Performance of computer-aided diagnosis in the interpretation of lesions on breast sonography. Acad Radiol 2004; 11: pp. 272-280.
9. Chang R.-F., Wu W.-J., Moon W.K., et. al.: Automatic ultrasound segmentation and morphology based diagnosis of solid breast tumors. Breast Cancer Res Treat 2005; 89: pp. 179-185.
10. Drukker K., Sennett C.A., Giger M.L.: Automated method for improving system performance of computer-aided diagnosis in breast ultrasound. IEEE Trans Med Imaging 2009; 28: pp. 122-128.
11. Moon W.K., Shen Y.-W., Huang C.-S., et. al.: Computer-aided diagnosis for the classification of breast masses in automated whole breast ultrasound images. Ultrasound Med Biol 2011; 37: pp. 539-548.
12. Tan T., Platel B., Huisman H., et. al.: Computer aided lesion diagnosis in automated 3D breast ultrasound using coronal spiculation. IEEE Trans Med Imaging 2012; 31: pp. 1034-1042.
13. Wang J., Engelmann R., Li Q.: Segmentation of pulmonary nodules in three-dimensional CT images by use of a spiral-scanning technique. Med Phys 2007; 34: pp. 4678-4689.
14. Timp S., Karssemeijer N.: A new 2D segmentation method based on dynamic programming applied to computer aided detection in mammography. Med Phys 2004; 31: pp. 958-971.
15. Karssemeijer N., te Brake G.M.: Detection of stellate distortions in mammograms. IEEE Trans Med Imaging 1996; 15: pp. 611-619.
16. Metz C.E., Herman B.A., Shen J.H.: Maximum likelihood estimation of receiver operating characteristic (ROC) curves from continuously-distributed data. Stat Med 1998; 17: pp. 1033-1053.
17. Dorfman D.D., Berbaum K.S., Metz C.E.: Receiver operating characteristic rating analysis: generalization to the population of readers and patients with the jackknife method. Invest Radiol 1992; 27: pp. 723-731.
18. Hillis S.L., Berbaum K.S., Metz C.E.: Recent developments in the Dorfman-Berbaum-Metz procedure for multireader ROC study analysis. Acad Radiol 2008; 15: pp. 647-661.
19. Sahiner B., Chan H.-P., Roubidoux M.A., et. al.: Malignant and benign breast masses on 3D US volumetric images: effect of computer-aided diagnosis on radiologist accuracy. Radiology 2007; 242: pp. 716-724.