
Rationale and Objectives
This study aims to quantitatively compare T2* measurements of the talar cartilage between chronic lateral ankle instability (LAI) patients with lateral ligament injury and healthy volunteers, and to assess the association of T2* value with American Orthopedic Foot and Ankle Society (AOFAS) score.
Materials and Methods
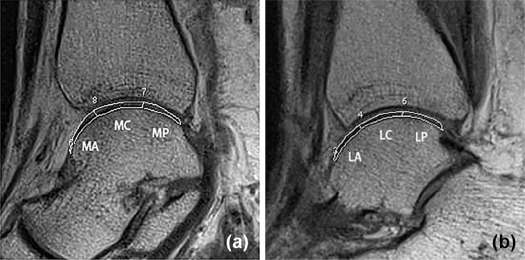
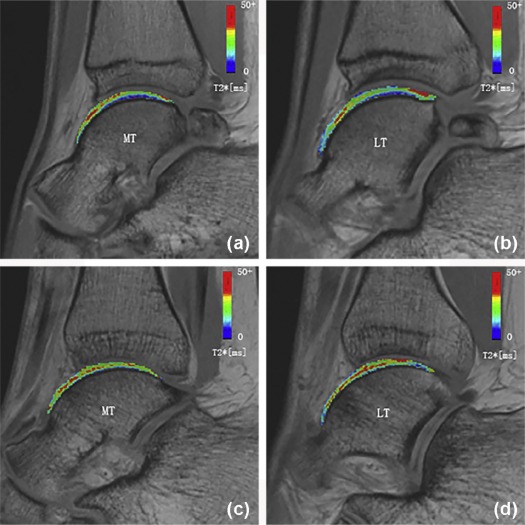
Nineteen consecutive patients with chronic LAI (LAI group) and 19 healthy individuals (control group) were enrolled. Biochemical magnetic resonance examination of the ankle was performed in all participants using three-dimensional gradient-echo T2* mapping. Total talar cartilage was divided into six subcompartments, including medial anterior (MA), central medial, medial posterior, lateral anterior, central lateral (LC), and lateral posterior regions. T2* values of respective cartilage areas were measured and compared between the two groups using Student t test. AOFAS scoring was performed for clinical evaluation. Then, the association of T2* value with AOFAS score was evaluated by Pearson correlation.
Results
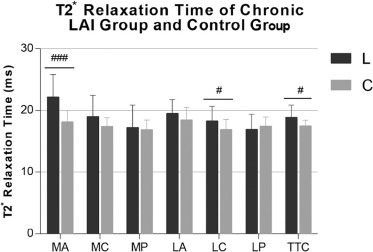
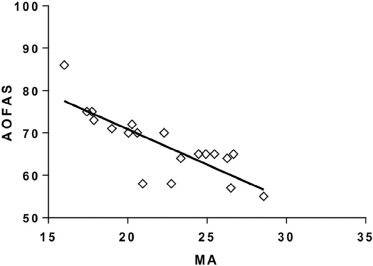
The T2* values of total talar cartilage, as well as MA and LC cartilage compartments, in the chronic LAI group were significantly higher than control values ( P < .001, P = .039, and P = .014, respectively). Furthermore, the T2* value of MA in the chronic LAI group was negatively correlated with AOFAS score ( r = −0.8089, P < .001).
Conclusions
Chronic LAI with lateral ligament injury may have a causal connection with early cartilage degeneration in the ankle joint, especially in MA and LC cartilage compartments, as assessed by quantitative T2* measurements. The clinical score correlates highly with T2* value of the MA cartilage compartment, indicating that MA may be the principal cartilage area conferring clinical symptoms.
Introduction
Ankle sprain is one of the most common musculoskeletal injuries in sporting activities, accounting for 20% of all individuals with joint injury . It often affects active and working individuals between 15 and 45 years old . Three-quarters of sprains involve the lateral ligament complex of the ankle, constituting 75% of all ankle injuries . A previous study with about 6.5 years of follow-up after ankle sprain found that 5% and 4% of patients have to change or abandon their sports because of continuous symptoms in the injured ankle . Although nonoperative treatments are effective for acute lateral ankle sprains, 10%–30% of patients with repeated ankle sprains may develop chronic lateral ankle instability (LAI) . LAI alters tibiotalar kinematics, causing chondral degeneration and subsequently osteoarthritis (OA) . The rate of OA development in patients with chronic LAI is as high as 78% beyond 10 years .
Previous studies indicated that the course of OA may be slowed down or even reversed if treated at very early stages . Much effort has therefore been directed toward exploring noninvasive ways for early diagnosis and treatment. Over the past decades, magnetic resonance imaging (MRI) has been widely used to assess cartilage degeneration and seems to be a sensitive alternative . However, conventional MRI is limited in identifying biochemical changes in the early stage of cartilage degeneration, for example, massive loss of proteoglycans, collagen disorganization, and increase in water content and mobility of free water molecules in the cartilage extracellular matrix . Because of recent advances in new promising “biochemical” magnetic resonance (MR) techniques, quantitative MR modalities, such as T2 mapping, T2* mapping, T1rho mapping, and delayed gadolinium-enhanced MRI of cartilage, allow for quantitative detection of cartilage lesions at a subclinical stage when changes are potentially still reversible . The advantages of biochemical imaging over conventional MRI could be maximized in T2/T2* mapping. Although T2 mapping is well established for diagnosing cartilage degeneration and regeneration , talar cartilage imaging also faces challenges, since the talar cartilage is definitely thin. T2* mapping, similar to T2 mapping, is a subclinical indicator of articular cartilage degeneration, with additional potential advantages of short scan time and three-dimensional (3D) acquisition . Such 3D gradient-echo sequence offers inherently higher resolution for the thin ankle cartilage layer compared to T2 mapping . Meanwhile, previous findings showed that T2* mapping, with short echo times (TEs), is highly sensitive to collagen architecture and provides improved sensitivity to the deepest zone of cartilage alteration . T2* quantification is sensitive to cartilage matrix changes in ankle osteochondrosis dissecans and hip femoroacetabular impingement .
Get Radiology Tree app to read full this article<
Materials and Methods
Get Radiology Tree app to read full this article<
Participant Selection
Get Radiology Tree app to read full this article<
Get Radiology Tree app to read full this article<
Get Radiology Tree app to read full this article<
TABLE 1
Demographic Data of Patients and Healthy Volunteers
Parameter Control Subjects ( n = 19) Chronic LAI Group ( n = 19)P Value Mean age, mean ± SD, y 26.4 ± 1.1 29.0 ± 1.5 .1838 Sex, male/female, n 11/8 10/9 .7442 BMI, mean ± SD 23.0 ± 0.5 23.1 ± 0.6 .9224
BMI, body mass index; LAI, lateral ankle instability; SD, standard deviation.
Get Radiology Tree app to read full this article<
Imaging Acquisition
Get Radiology Tree app to read full this article<
TABLE 2
Magnetic Resonance Parameters of the Sequences Used in the Study
Pulse Sequence FS-PD in Ax FS-PD in Cor FS-PD in Sag T1 in Ax T2* Mapping Repetition time (ms) 650 843 737 600 50 Echo time (ms) 15.0 9.9 18.0 18.0 2.46, 7.38, 12.30, 17.22, 22.14, 27.06, 31.78, 36.90 Flip angle (degrees) 90 150 140 140 60 Bandwidth (Hz) 250 250 260 260 260 Field of view (mm) 150 × 150 150 × 150 150 × 150 150 × 150 160 × 160 Section thickness (mm) 2.0 2.0 2.0 2.0 2.0 Matrix phase (%) 80 73 75 75 100 Matrix 256 × 205 256 × 187 256 × 192 256 × 192 320 × 320 No. of signals acquired 1 1 1 1 1 Imaging time 2 min 17 s 2 min 32 s 1 min 17 s 1 min 57 s 2 min 52 s
Ax, axial; Cor, coronal; FS-PD, fat-suppressed proton density; Sag, sagittal; No., number.
Get Radiology Tree app to read full this article<
Get Radiology Tree app to read full this article<
Get Radiology Tree app to read full this article<
Get Radiology Tree app to read full this article<
Clinical Evaluation
Get Radiology Tree app to read full this article<
Data Analysis
Get Radiology Tree app to read full this article<
Results
Get Radiology Tree app to read full this article<
Get Radiology Tree app to read full this article<
TABLE 3
Comparison of Zonal T2* Values of Talar Cartilage Between Patients and Control
Zone Chronic LAI Group (ms) Control Subjects (ms)P Value ΔT2* Value MA 22.18 18.18<.001 22.00% # MC 18.98 17.40 .073 9.10% MP 17.21 16.86 .700 2.10% LA 19.53 18.46 .127 5.80% LC 18.31 16.89.039 8.41% # LP 16.92 17.49 .392 −3.37% TTC 18.85 17.55.014 7.47% #
LA, lateral anterior; LC, central lateral; LP, lateral posterior; MA, medial anterior; MC, central medial; MP, medial posterior; TTC, talus trochlear cartilage.
ΔT2* value = [T2* value(“chronic LAI”) − T2* value(“control group”)]/T2* value(“control group”).
The P value less than 0.05 are bold.
Get Radiology Tree app to read full this article<
Get Radiology Tree app to read full this article<
Get Radiology Tree app to read full this article<
Get Radiology Tree app to read full this article<
Discussion
Results Discussion
Get Radiology Tree app to read full this article<
Get Radiology Tree app to read full this article<
Get Radiology Tree app to read full this article<
Get Radiology Tree app to read full this article<
Get Radiology Tree app to read full this article<
Limitations of This Study
Get Radiology Tree app to read full this article<
Conclusions
Get Radiology Tree app to read full this article<
Get Radiology Tree app to read full this article<
Get Radiology Tree app to read full this article<
Get Radiology Tree app to read full this article<
References
1. Gribble P.A., Delahunt E., Bleakley C., et. al.: Selection criteria for patients with chronic ankle instability in controlled research: a position statement of the International Ankle Consortium. J Orthop Sports Phys Ther 2013; 43: pp. 585-591.
2. Jolman S., Robbins J., Lewis L., et. al.: Comparison of magnetic resonance imaging and stress radiographs in the evaluation of chronic lateral ankle instability. Foot Ankle Int 2017; 38: pp. 397-404.
3. Osbahr D.C., Drakos M.C., O’Loughlin P.F., et. al.: Syndesmosis and lateral ankle sprains in the National Football League. Orthopedics 2013; 36: pp. e1378-e1384.
4. Kobayashi T., Suzuki E., Yamazaki N., et. al.: In vivo talocrural joint contact mechanics with functional ankle instability. Foot Ankle Spec 2015; 8: pp. 445-453.
5. Cass J.R., Morrey B.F.: Ankle instability: current concepts, diagnosis, and treatment. Mayo Clin Proc 1984; 59: pp. 165-170.
6. Hintermann B., Boss A., Schafer D.: Arthroscopic findings in patients with chronic ankle instability. Am J Sports Med 2002; 30: pp. 402-409.
7. Valderrabano V., Hintermann B., Horisberger M., et. al.: Ligamentous posttraumatic ankle osteoarthritis. Am J Sports Med 2006; 34: pp. 612-620.
8. Povacz P., Unger S.F., Miller W.K., et. al.: A randomized, prospective study of operative and non-operative treatment of injuries of the fibular collateral ligaments of the ankle. J Bone Joint Surg Am 1998; 80: pp. 345-351.
9. Le J., Peng Q., Sperling K.: Biochemical magnetic resonance imaging of knee articular cartilage: T1rho and T2 mapping as cartilage degeneration biomarkers. Ann N Y Acad Sci 2016; 1383: pp. 34-42.
10. Wei B., Du X., Liu J., et. al.: Associations between the properties of the cartilage matrix and findings from quantitative MRI in human osteoarthritic cartilage of the knee. Int J Clin Exp Pathol 2015; 8: pp. 3928-3936.
11. Eckstein F., Cicuttini F., Raynauld J.P., et. al.: Magnetic resonance imaging (MRI) of articular cartilage in knee osteoarthritis (OA): morphological assessment. Osteoarthritis Cartilage 2006; 14: pp. A46-A75.
12. Apprich S., Trattnig S., Welsch G.H., et. al.: Assessment of articular cartilage repair tissue after matrix-associated autologous chondrocyte transplantation or the microfracture technique in the ankle joint using diffusion-weighted imaging at 3 Tesla. Osteoarthritis Cartilage 2012; 20: pp. 703-711.
13. Sandro G., Paolo S., Francesca V.: MRI in the evaluation of osteochondral lesion. Cartilage lesions of the ankle.2015.SpringerBerlin, Heidelbergpp. 1.
14. Park S.Y., Yoon Y.C., Cha J.G., et. al.: T2 relaxation values of the talar trochlear articular cartilage: comparison between patients with lateral instability of the ankle joint and healthy volunteers. AJR Am J Roentgenol 2016; 206: pp. 136-143.
15. Link T.M., Stahl R., Woertler K.: Cartilage imaging: motivation, techniques, current and future significance. Eur Radiol 2007; 17: pp. 1135-1146.
16. Battaglia M., Rimondi E., Monti C., et. al.: Validity of T2 mapping in characterization of the regeneration tissue by bone marrow derived cell transplantation in osteochondral lesions of the ankle. Eur J Radiol 2011; 80: pp. e132-e139.
17. Mamisch T.C., Hughes T., Mosher T.J., et. al.: T2 star relaxation times for assessment of articular cartilage at 3 T: a feasibility study. Skeletal Radiol 2012; 41: pp. 287-292.
18. Krause F.G., Klammer G., Benneker L.M., et. al.: Biochemical T2* MR quantification of ankle arthrosis in pes cavovarus. J Orthop Res 2010; 28: pp. 1562-1568.
19. Eagle S., Potter H.G., Koff M.F.: Morphologic and quantitative magnetic resonance imaging of knee articular cartilage for the assessment of post-traumatic osteoarthritis. J Orthop Res 2017; 35: pp. 412-423.
20. Williams A., Qian Y., Bear D., et. al.: Assessing degeneration of human articular cartilage with ultra-short echo time (UTE) T2* mapping. Osteoarthritis Cartilage 2010; 18: pp. 539-546.
21. Bittersohl B., Hosalkar H.S., Hughes T., et. al.: Feasibility of T2* mapping for the evaluation of hip joint cartilage at 1.5T using a three-dimensional (3D), gradient-echo (GRE) sequence: a prospective study. Magn Reson Med 2009; 62: pp. 896-901.
22. Marik W., Apprich S., Welsch G.H., et. al.: Biochemical evaluation of articular cartilage in patients with osteochondrosis dissecans by means of quantitative T2- and T2-mapping at 3T MRI: a feasibility study. Eur J Radiol 2012; 81: pp. 923-927.
23. Bischof J.E., Spritzer C.E., Caputo A.M., et. al.: In vivo cartilage contact strains in patients with lateral ankle instability. J Biomech 2010; 43: pp. 2561-2566.
24. Lee S., Yoon Y.C., Kim J.H.: T2 mapping of the articular cartilage in the ankle: correlation to the status of anterior talofibular ligament. Clin Radiol 2013; 68: pp. e355-e361.
25. Ahn J.H., Lee S.H., Choi S.H., et. al.: Magnetic resonance imaging evaluation of anterior cruciate ligament reconstruction using quadrupled hamstring tendon autografts: comparison of remnant bundle preservation and standard technique. Am J Sports Med 2010; 38: pp. 1768-1777.
26. Bittersohl B., Kircher J., Miese F.R., et. al.: T2* mapping and delayed gadolinium-enhanced magnetic resonance imaging in cartilage (dGEMRIC) of humeral articular cartilage—a histologically controlled study. J Shoulder Elbow Surg 2015; 24: pp. 1644-1652.
27. Williams A., Qian Y., Chu C.R.: UTE-T2 * mapping of human articular cartilage in vivo: a repeatability assessment. Osteoarthritis Cartilage 2011; 19: pp. 84-88.
28. Hirose K., Murakami G., Minowa T., et. al.: Lateral ligament injury of the ankle and associated articular cartilage degeneration in the talocrural joint: anatomic study using elderly cadavers. J Orthop Sci 2004; 9: pp. 37-43.
29. Ringleb S.I., Dhakal A., Anderson C.D., et. al.: Effects of lateral ligament sectioning on the stability of the ankle and subtalar joint. J Orthop Res 2011; 29: pp. 1459-1464.
30. Kovaleski J.E., Heitman R.J., Gurchiek L.R., et. al.: Joint stability characteristics of the ankle complex after lateral ligamentous injury, part I: a laboratory comparison using arthrometric measurement. J Athl Train 2014; 49: pp. 192-197.
31. Kobayashi T., Gamada K.: Lateral ankle sprain and chronic ankle instability: a critical review. Foot Ankle Spec 2014; 7: pp. 298-326.
32. Kobayashi T., No Y., Yoneta K., et. al.: In vivo kinematics of the talocrural and subtalar joints with functional ankle instability during weight-bearing ankle internal rotation: a pilot study. Foot Ankle Spec 2013; 6: pp. 178-184.
33. Zhu Z.J., Zhu Y., Liu J.F., et. al.: Posterolateral ankle ligament injuries affect ankle stability: a finite element study. BMC Musculoskelet Disord 2016; 17: pp. 96.
34. Caputo A.M., Lee J.Y., Spritzer C.E., et. al.: In vivo kinematics of the tibiotalar joint after lateral ankle instability. Am J Sports Med 2009; 37: pp. 2241-2248.
35. Sugimoto K., Takakura Y., Okahashi K., et. al.: Chondral injuries of the ankle with recurrent lateral instability: an arthroscopic study. J Bone Joint Surg Am 2009; 91: pp. 99-106.
36. Lee M., Kwon J.W., Choi W.J., et. al.: Comparison of outcomes for osteochondral lesions of the talus with and without chronic lateral ankle instability. Foot Ankle Int 2015; 36: pp. 1050-1057.
37. Cha S.D., Kim H.S., Chung S.T., et. al.: Intra-articular lesions in chronic lateral ankle instability: comparison of arthroscopy with magnetic resonance imaging findings. Clin Orthop Surg 2012; 4: pp. 293-299.
38. Karoly R., Agnes B., Laszlo H.: Mosaicplasty of osteochondral lesions of the ankle.Cartilage lesions of the ankle.2015.SpringerBerlin, Heidelberg:pp. 38.
39. Guillo S., Bauer T., Lee J.W., et. al.: Consensus in chronic ankle instability: aetiology, assessment, surgical indications and place for arthroscopy. Orthop Traumatol Surg Res 2013; 99: pp. S411-S419.
40. Taga I., Shino K., Inoue M., et. al.: Articular cartilage lesions in ankles with lateral ligament injury. An arthroscopic study. Am J Sports Med 1993; 21: pp. 120-126. discussion 126–127
41. Lee J., Hamilton G., Ford L.: Associated intra-articular ankle pathologies in patients with chronic lateral ankle instability: arthroscopic findings at the time of lateral ankle reconstruction. Foot Ankle Spec 2011; 4: pp. 284-289.