
Rationale and Objectives
Non-invasive longitudinal imaging of tumor vasculature could provide new insights into the development of solid tumors, facilitating efficient delivery of therapeutics. In this study, we report three-dimensional imaging and characterization of tumor vascular architecture using a nanoparticle contrast agent and high-resolution computed tomography (CT) imaging.
Materials and Methods
Five Balb/c mice implanted with 4T1/Luc syngeneic breast tumors cells were used for the study. The nanoparticle contrast agent was systemically administered and longitudinal CT imaging was performed pre-contrast and at serial time points post-contrast, for up to 7 days for studying the characteristics of tumor-associated blood vessels. Gene expression of tumor angiogenic biomarkers was measured using quantitative real-time polymerase chain reaction.
Results
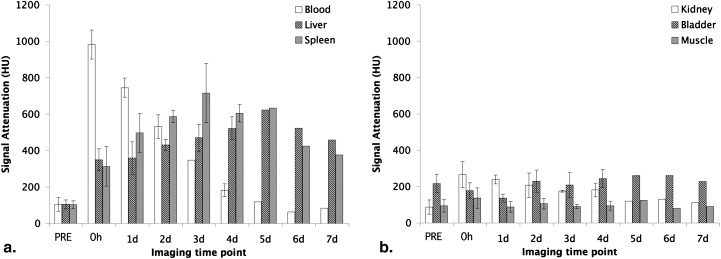
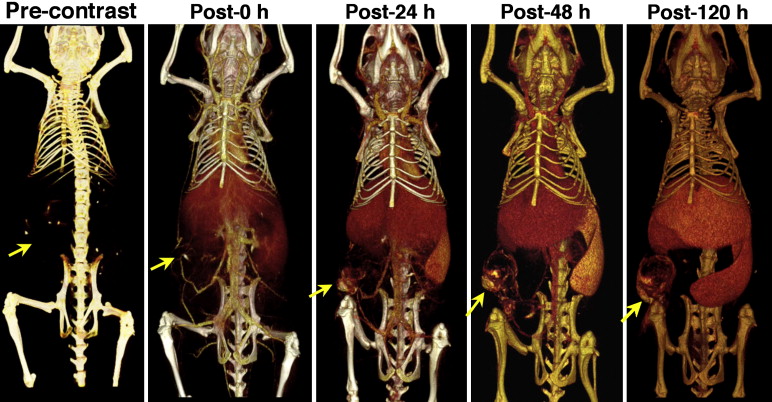
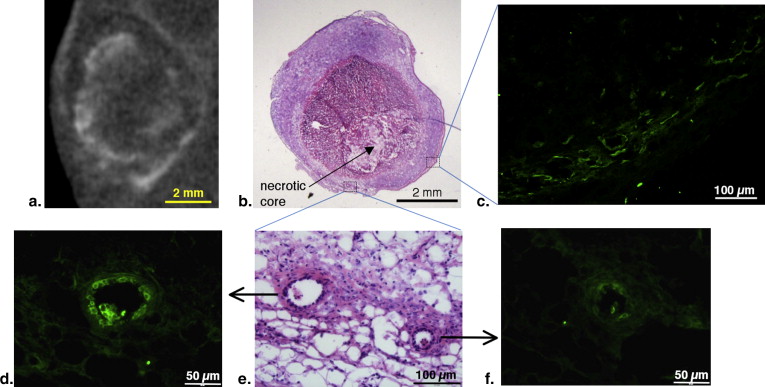
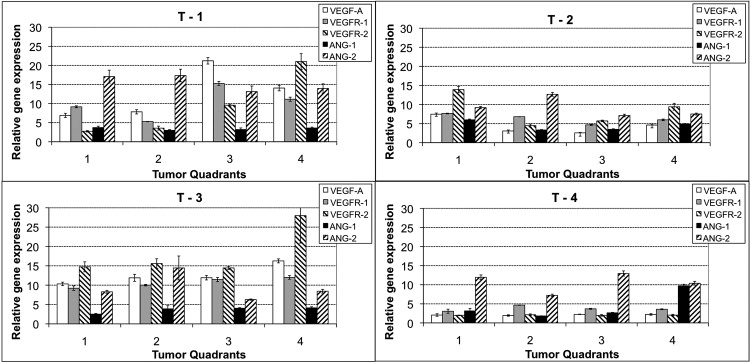
Early-phase imaging demonstrated the presence of co-opted and newly developed tumor vessels. The co-opted vessels demonstrated wall-permeability and “leakiness” characteristics evident by an increase in extravascular nanoparticle-based signal enhancement visible well beyond the margins of tumor. Diameters of tumor-associated vessels were larger than the contralateral normal vessels. Delayed-phase imaging also demonstrated significant accumulation of nanoparticle contrast agent both within and in areas surrounding the tumor. A heterogeneous pattern of signal enhancement was observed both within and among individual tumors. Gene-expression profiling demonstrated significant variability in several angiogenic biomarkers both within and among individual tumors.
Conclusions
The nanoparticle contrast agent and high-resolution CT imaging facilitated visualization of co-opted and newly developed tumors vessels as well as imaging of nanoparticle accumulation within tumors. The use of this agent could provide novel insights into tumor vascular biology and could have implications on the monitoring of tumor status.
Solid tumors undergo significant changes in their architecture during growth and development. Angiogenesis, the growth of new blood vessels, is one of the hallmarks of growing tumors . The tumor blood vessels show distinctly different patterns compared to blood vessels found in normal tissues . The presence of large pores in the endothelial lining of the vessels and the absence of continuous pericyte and smooth muscle cell coverage are two of the commonly observed traits of “leaky” tumor blood vessels . These abnormalities in tumor vessels often lead to significant changes in the transport processes within the tumor interstitial space, affecting the delivery of nutrients and therapeutics . Rapidly growing tumors also represent a large source of growth factors such as vascular endothelial growth factor (VEGF) and its receptors (eg, VEGFR-1 and VEGFR-2), which are then systemically distributed . The increased levels of growth factors and their receptors are known to have implications for blood vessel permeability, rapid proliferation, and the growth and metastatic potential of tumors. Furthermore, although tumors of different origin are expected (and known) to demonstrate marked variability in tumor-architecture and biomarker levels, inter- and intratumor heterogeneity has been observed even within the same tumor type . This heterogeneity could have significant implications in personalized tumor treatment.
Non-invasive monitoring of tumor architecture coupled with gene-expression profiling could therefore enhance our understanding of growing tumors and its interactions with the surrounding host tissue. Dynamic and longitudinal imaging could also provide insights into the functional characteristics of these tumor blood vessels. One methodology that has been used in preclinical models of solid tumors is noninvasive micro–computed tomography (CT) imaging . The three-dimensional nature of the technique combined with high spatial resolution provides excellent assessment of tumors. The linear relationship between image signal enhancement and contrast agent concentration enables accurate quantitative assessment of tumor vasculature and its micro-environment. However the pre-clinical utility of CT imaging for investigating tumor vasculature has been limited because of two major limitations of conventional contrast agents: their rapid systemic clearance from the blood pool and low vessel conspicuity from high propensity to rapidly extravasate into the tumor extravascular space. In this work, we evaluated the tumor micro-environment using a nanoparticle contrast agent and CT imaging. Specifically, we investigated whether a long circulating blood-pool nanoparticle CT contrast agent can enable 1) visualization of tumor vasculature and 2) demonstration of tumor vessel “leakiness” by imaging nanoparticle extravasation into the tumor interstitial space. Early phase imaging was performed to investigate the feasibility of tumor vascular imaging. Longitudinal delayed-phase imaging was performed to study tumor vessel permeability as well as the transport and accumulation of nanoparticles in tumors. These studies were performed during the National Cancer Institute–sponsored Cancer Imaging Summer Camp, held at Washington University, St. Louis, in June 2009.
Materials and methods
Fabrication of Nanoparticle Contrast Agent
Get Radiology Tree app to read full this article<
In Vivo Studies
Animal tumor model
Get Radiology Tree app to read full this article<
Micro-CT setup
Get Radiology Tree app to read full this article<
Imaging study
Get Radiology Tree app to read full this article<
Table 1
Imaging Time Points and Experimental Parameters Used in the Study
Animal Number Animal weight (g) Iodine Dose (mg I/g) Imaging Time Points Pre 0 hours 1 day 2 days 3 days 4 days 5 days 6 days 7 days T-1 16 2.9 X X X X X X T-2 19 3.2 X X X X T-3 20 3.2 X X X X X T-4 18 2.9 X X X X T-5 19 3.0 X X X X
Get Radiology Tree app to read full this article<
Quantitative Real-time Polymerase Chain Reaction
Get Radiology Tree app to read full this article<
Immuno-histology
Get Radiology Tree app to read full this article<
Image Analysis
Get Radiology Tree app to read full this article<
Data Analysis
Get Radiology Tree app to read full this article<
Get Radiology Tree app to read full this article<
Get Radiology Tree app to read full this article<
Statistical Analysis
Get Radiology Tree app to read full this article<
Results
Get Radiology Tree app to read full this article<
Get Radiology Tree app to read full this article<
Get Radiology Tree app to read full this article<
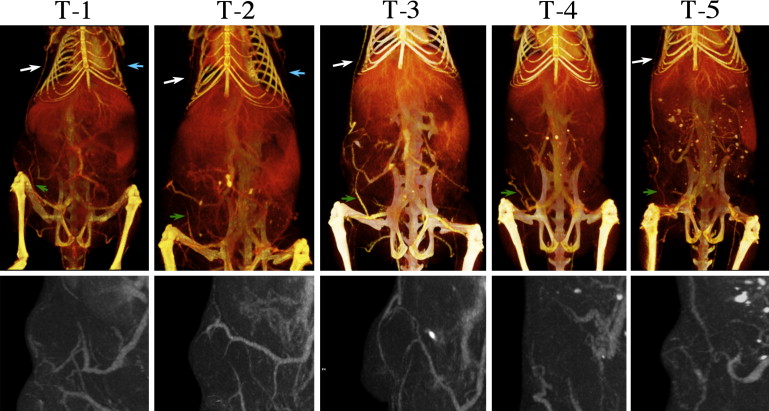
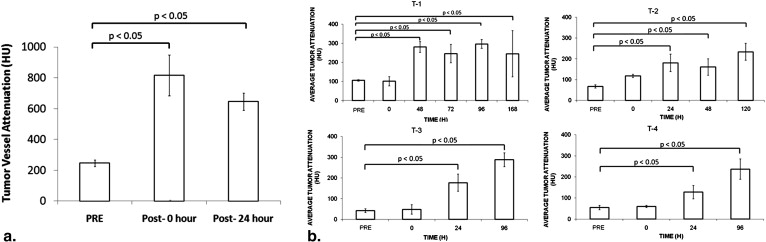
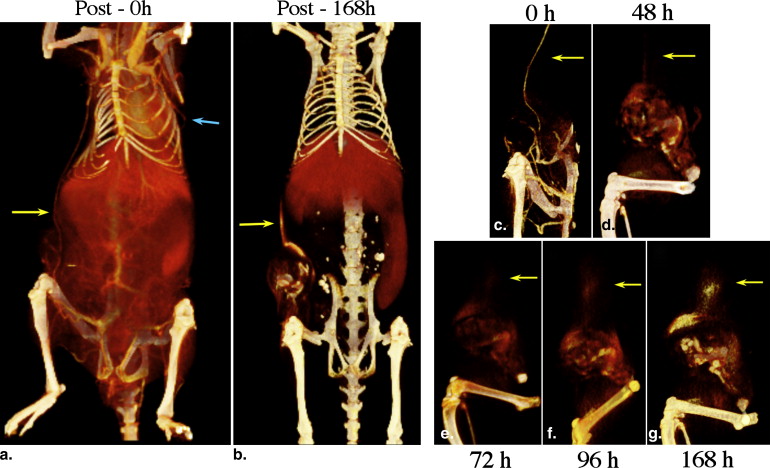
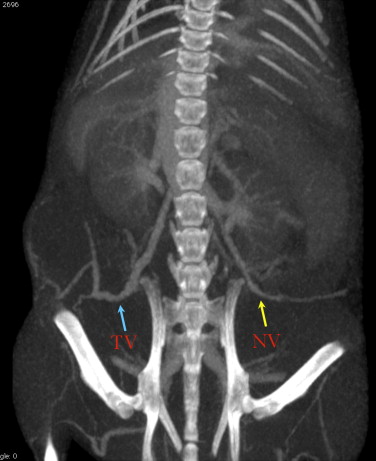
Table 2
Comparison of Vessel Diameters Between Tumor-associated Vessels and Contralateral Normal Vessels
Vessel Origin - Inferior Vena Cava Vessel Origin - Jugular Vein Tumor Identification Tumor vessel diameter (μm) Contralateral vessel diameter (μm) Co-opted vessel diameter (μm) Contra-lateral vessel diameter (μm) T-1 617 ± 66 429 ± 67 448 ± 49 338 ± 9 T-2 696 ± 28 472 ± 3 442 ± 30 381 ± 17 T-3 654 ± 61 473 ± 117 445 ± 32 231 ± 37 T-4 805 ± 42 467 ± 33 194 ± 35 Not visible T-5 642 ± 82 445 ± 27 336 ± 72 231 ± 41
Two types of vessel were analyzed based on their origin. For tumors vessels that originated from inferior vena cava, size analysis was performed for vessel segments surrounding the tumor tissue. Identical contralateral normal vessels were used for comparison. For co-opted vessel originating from the jugular vein, size analysis was performed for vessel segments in the thoraco-abdominal region. Identical contralateral normal vessels were used for comparison. In most animals, the contralateral vessels originating from the jugular vein was not clearly demonstrated below the abdominal region. Values are reported as mean and standard deviation with three to five measurements per vessel.
Get Radiology Tree app to read full this article<
Get Radiology Tree app to read full this article<

Get Radiology Tree app to read full this article<
Get Radiology Tree app to read full this article<
Get Radiology Tree app to read full this article<
Get Radiology Tree app to read full this article<
Get Radiology Tree app to read full this article<
Discussion
Get Radiology Tree app to read full this article<
Get Radiology Tree app to read full this article<
Get Radiology Tree app to read full this article<
Get Radiology Tree app to read full this article<
Get Radiology Tree app to read full this article<
Get Radiology Tree app to read full this article<
Get Radiology Tree app to read full this article<
Acknowledgments
Get Radiology Tree app to read full this article<
Get Radiology Tree app to read full this article<
References
1. Hanahan D., Weinberg R.A.: The hallmarks of cancer. Cell 2000; 100: pp. 57-70.
2. Bergers G., Benjamin L.E.: Tumorigenesis and the angiogenic switch. Nat Rev Cancer 2003; 3: pp. 401-410.
3. McDonald D.M., Choyke P.L.: Imaging of angiogenesis: from microscope to clinic. Nat Med 2003; 9: pp. 713-725.
4. Jain R.K., di Tomaso E., Duda D.G., et. al.: Angiogenesis in brain tumours. Nat Rev Neurosci 2007; 8: pp. 610-622.
5. Pasqualini R., Arap W., McDonald D.M.: Probing the structural and molecular diversity of tumor vasculature. Trends Mol Med 2002; 8: pp. 563-571.
6. Di Tomaso E., Capen D., Haskell A., et. al.: Mosaic tumor vessels: cellular basis and ultrastructure of focal regions lacking endothelial cell markers. Cancer Res 2005; 65: pp. 5740-5749.
7. Bergers G., Benjamin L.E.: Tumorigenesis and the angiogenic switch. Nat Rev Cancer 2003; 3: pp. 401-410.
8. Jain R.K.: Transport of molecules, particles, and cells in solid tumors. Annu Rev Biomed Eng 1999; 1: pp. 241-263.
9. Sennino B., Kuhnert F., Tabruyn S.P., et. al.: Cellular source and amount of vascular endothelial growth factor and platelet-derived growth factor in tumors determine response to angiogenesis inhibitors. Cancer Res 2009; 69: pp. 4527-4536.
10. Fukumura D., Jain R.K.: Tumor microenvironment abnormalities: causes, consequences, and strategies to normalize. J Cell Biochem 2007; 101: pp. 937-949.
11. Jain R.K.: Delivery of molecular and cellular medicine to solid tumors. Adv Drug Deliv Rev 2001; 46: pp. 149-168.
12. Francis P., Fernebro J., Edén P., et. al.: Intratumor versus intertumor heterogeneity in gene expression profiles of soft-tissue sarcomas. Genes Chromosomes Cancer 2005; 43: pp. 302-308.
13. Samei E., Saunders R.S., Badea C.T., et. al.: Micro-CT imaging of breast tumors in rodents using a liposomal, nanoparticle contrast agent. Int J Nanomed 2009; 4: pp. 277-282.
14. Savai R., Langheinrich A.C., Schermuly R.T., et. al.: Evaluation of angiogenesis using micro-computed tomography in a xenograft mouse model of lung cancer. Neoplasia 2009; 11: pp. 48-56.
15. Fushiki H., Kanoh-Azuma T., Katoh M., et. al.: Quantification of mouse pulmonary cancer models by microcomputed tomography imaging. Cancer Sci 2009; 100: pp. 1544-1549.
16. Mukundan S., Ghaghada K.B., Badea C.T., et. al.: A liposomal nanoscale contrast agent for preclinical CT in mice. AJR Am J Roentgenol 2006; 186: pp. 300-307.
17. Karathanasis E., Suryanarayanan S., Balusu S.R., et. al.: Imaging nanoprobe for prediction of outcome of nanoparticle chemotherapy by using mammography. Radiology 2009; 250: pp. 398-406.
18. Karathanasis E., Chan L., Karumbaiah L., et. al.: Tumor vascular permeability to a nanoprobe correlates to tumor-specific expression levels of angiogenic markers. PLoS One 2009; 4: pp. e5843.
19. Jain R.K., Duda D.G., Clark J.W., et. al.: Lessons from phase III clinical trials on anti-VEGF therapy for cancer. Nat Clin Pract Oncol 2006; 3: pp. 24-40.
20. Pàez-Ribes M., Allen E., Hudock J., et. al.: Antiangiogenic therapy elicits malignant progression of tumors to increased local invasion and distant metastasis. Cancer Cell 2009; 15: pp. 220-231.
21. Ebos J.M., Lee C.R., Cruz-Munoz W., et. al.: Accelerated metastasis after short-term treatment with a potent inhibitor of tumor angiogenesis. Cancer Cell 2009; 15: pp. 232-239.
22. Kerbel R.S.: Tumor angiogenesis. N Engl J Med 2008; 358: pp. 2039-2049.
23. Vogelstein B., Kinzler K.W.: Cancer genes and the pathways they control. Nat Med 2004; 10: pp. 789-799.
24. Badea C.T., Hedlund L.W., De Lin M., et. al.: Tumor imaging in small animals with a combined micro-CT/micro-DSA system using iodinated conventional and blood pool contrast agents. Contrast Media Mol Imaging 2006; 1: pp. 153-164.
25. Fushiki H., Kanoh-Azuma T., Katoh M., et. al.: Quantification of mouse pulmonary cancer models by microcomputed tomography imaging. Cancer Sci 2009; 100: pp. 1544-1549.
26. Schwarz M., Engelhorn T., Eyupoglu I.Y., et. al.: In vivo imaging of MSCT and micro-CT: a comparison. Rofo 2010; 182: pp. 322-326.
27. Savai R., Langheinrich A.C., Schermuly R.T., et. al.: Evaluation of angiogenesis using micro-computed tomography in a xenograft mouse model of lung cancer. Neoplasia 2009; 11: pp. 48-56.
28. Martiniova L., Schimel D., Lai E.W., et. al.: In vivo micro-CT imaging of liver lesions in small animal models. Methods 2010; 50: pp. 20-25.
29. Bullitt E., Reardon D.A., Smith J.K.: A review of micro- and macrovascular analyses in the assessment of tumor-associated vasculature as visualized by MR. Neuroimage 2007; 37: pp. S116-S119.
30. Tian S., Hayes A.J., Metheny-Barlow L.J., et. al.: Stabilization of breast cancer xenograft tumour neovasculature by angiopoietin-1. Br J Cancer 2002; 86: pp. 645-651.
31. Jain R.K.: Normalization of tumor vasculature: an emerging concept in antiangiogenic therapy. Science 2005; 307: pp. 58-62.
32. Jones N., Iljin K., Dumont D.J., et. al.: Tie receptors: new modulators of angiogenic and lymphangiogenic responses. Nat Rev Mol Cell Biol 2001; 2: pp. 257-267.
33. Thurston G., Suri C., Smith K., et. al.: Leakage-resistant blood vessels in mice transgenically overexpressing angiopoietin-1. Science 1999; 286: pp. 2511-2514.
34. Maisonpierre P.C., Suri C., Jones P.F., et. al.: Angiopoietin-2, a natural antagonist for Tie2 that disrupts in vivo angiogenesis. Science 1997; 277: pp. 55-60.
35. Tait C.R., Jones P.F.: Angiopoietins in tumours: the angiogenic switch. J Pathol 2004; 204: pp. 1-10.
36. Holash J., Maisonpierre P.C., Compton D., et. al.: Vessel cooption, regression, and growth in tumors mediated by angiopoietins and VEGF. Science 1999; 284: pp. 1994-1998.
37. Falcón B.L., Hashizume H., Koumoutsakos P., et. al.: Contrasting actions of selective inhibitors of angiopoietin-1 and angiopoietin-2 on the normalization of tumor blood vessels. Am J Pathol 2009; 175: pp. 2159-2170.
38. Zhang L., Yang N., Park J.W., et. al.: Tumor-derived vascular endothelial growth factor up-regulates angiopoietin-2 in host endothelium and destabilizes host vasculature, supporting angiogenesis in ovarian cancer. Cancer Res 2003; 63: pp. 3403-3412.
39. Visconti R.P., Richardson C.D., Sato T.N.: Orchestration of angiogenesis and arteriovenous contribution by angiopoietins and vascular endothelial growth factor (VEGF). Proc Natl Acad Sci U S A 2002; 99: pp. 8219-8224.
40. Kuboki S., Shimizu H., Mitsuhashi N., et. al.: Angiopoietin-2 levels in the hepatic vein as a useful predictor of tumor invasiveness and prognosis in human hepatocellular carcinoma. J Gastroenterol Hepatol 2008; 23: pp. e157-e164.