
Rationale and Objectives
Attention deficit-hyperactivity disorder (ADHD) is a socially disabling condition whose pathophysiology is mostly unknown. Previous magnetic resonance imaging (MRI)-based reports have shown structural abnormalities in the prefrontal region and the striatum, but with inconsistencies across the studies with regard to right/left specificity of changes. Our study is aimed at finding evidence of dysfunction with more refined MRI techniques such as diffusion-weighted MRI and spectroscopy.
Materials and Methods
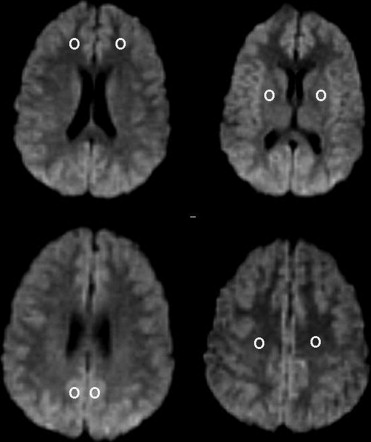
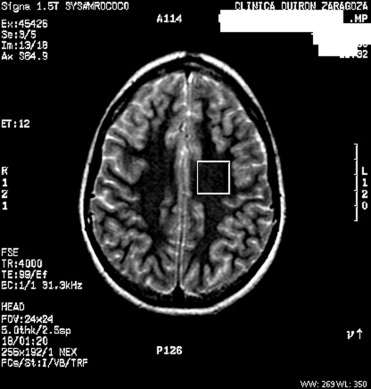
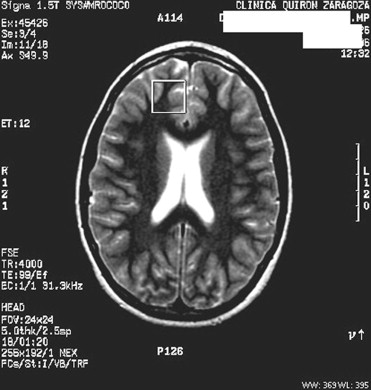
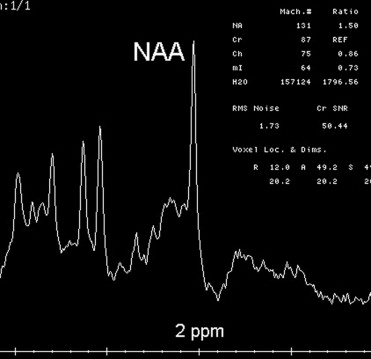
We enrolled 22 ADHD children (mean age 9; SD 2.91) and 8 healthy children (mean age 7.5; SD 3). All of them underwent diffusion-weighted MRI in several areas of the brain bilaterally: prefrontal, lentiform nucleus, posterior cingulate, and centrum semiovale; and single-voxel proton magnetic resonance spectroscopy in the left centrum semiovale and right prefrontal region.
Results
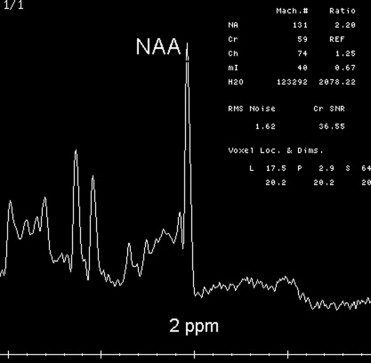
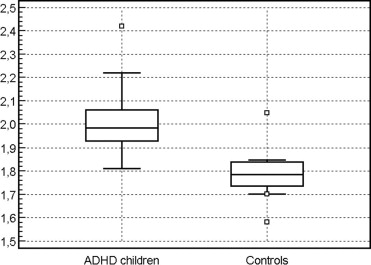
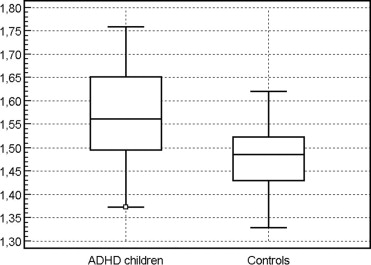
We did not see either apparent structural abnormalities of the brain in conventional MRI or differences in the apparent-diffusion coefficients in any of the areas studied. However, we observed significant differences in the N-acetyl-aspartate/creatine ratios in relation to controls in the right prefrontal corticosubcortical region: 1.58 (SD 0.09) versus 1.47 (0.08), P = .01); and in the left centrum semiovale: 2.02 (0.13) versus 1.79 (0.13), P = .0003. This finding is consistent with a published report on eight ADHD children in whom N-acetyl-aspartate/creatine ratios were also elevated.
Conclusions
Given these results, we hypothesize that a biochemical dysfunction might underlie in the brain of ADHD children. The N-acetyl-aspartate/creatine ratio may be regarded as a potential marker of the disease.
Introduction
Attention deficit-hyperactivity disorder (ADHD) is a common developmental disorder afflicting 3–7% of school-age children. It is characterized by overactivity, impulsivity, and inattentiveness, which lead to negative academic and social consequences ( ). In the past, these children were considered to have minimal brain dysfunction, but so far the etiology and pathophysiology are mostly unknown.
Magnetic resonance (MR)-based techniques have provided useful information and clues about the areas of the brain that are supposedly involved in this disorder. The majority of studies agree that the reduced volumes underlay in areas involved in attentional and executive functions (prefrontal-striatal areas). However, there are inconsistencies across the studies, especially in relation to right/left predominance of decreased brain volumes and other changes.
Get Radiology Tree app to read full this article<
Get Radiology Tree app to read full this article<
Get Radiology Tree app to read full this article<
Get Radiology Tree app to read full this article<
Patients and methods
Get Radiology Tree app to read full this article<
Get Radiology Tree app to read full this article<
Get Radiology Tree app to read full this article<
Get Radiology Tree app to read full this article<
Get Radiology Tree app to read full this article<
Get Radiology Tree app to read full this article<
Get Radiology Tree app to read full this article<
Get Radiology Tree app to read full this article<
Get Radiology Tree app to read full this article<
Results
Get Radiology Tree app to read full this article<
Table 1
Mean Apparent Diffusion Coefficients (ADC) by Every Area
Area Examined Mean ADC of patients ( n = 24) Mean ADC of controls ( n = 8) Right prefrontal 6.6993 E-10 6.9925 E-10 NS Left prefrontal 6.8423 E-10 6.7462 E-10 NS Right striatum 5.8381 E-10 5.7475 E-10 NS Left striatum 5.8195 E-10 5.79 E-10 NS Right cingulate 7.3568 E-10 7.2112 E-10 NS Left cingulate 7.1395 E-10 7.1287 E-10 NS Right centrum semiovale 6.1618 E-10 6.1925 E-10 NS Left centrum semiovale 5.8192 E-10 5.8685 E-10 NS
Get Radiology Tree app to read full this article<
Get Radiology Tree app to read full this article<
Table 2
Mean and SD Values of the Metabolites Relative to Cr
Left Centrum Semiovale Metabolite Ratio to Cr ADHD Children ( n = 24) Controls ( n = 8) Significance NAA/Cr 2.02 (SD 0.13) 1.79 (SD 0.13)P = .0003 Ch/Cr 1.15 (SD 0.12) 1.13 (SD 0.2)P = .6 mI/Cr 0.67 (SD 0.09) 0.67 (SD 0.07)P = .8 Right Prefrontal Region Metabolite Ratio to Cr ADHD Children ( n = 24) Controls ( n = 8) Significance NAA/Cr 1.58 (SD 0.09) 1.47 (SD 0.08)P = .01 Ch/Cr 0.87 (SD 0.13) 0.84 (SD 0.07)P = .07 mI/Cr 0.73 (SD 0.06) 0.72 (SD 0.07)P = .6
Note.—Cr = creatine; ADHD = attention deficit hyperactivity disorder; NAA = N-acetyl-aspartate/creatine; Ch = choline; mI = myo-Inositol
Get Radiology Tree app to read full this article<
Discussion
Get Radiology Tree app to read full this article<
Get Radiology Tree app to read full this article<
Get Radiology Tree app to read full this article<
Get Radiology Tree app to read full this article<
Get Radiology Tree app to read full this article<
Get Radiology Tree app to read full this article<
Get Radiology Tree app to read full this article<
References
1. The American Psychiatric Association: Diagnostical and statistical manual of mental disorders.ed. 42000.The American Psychiatric AssociationArlington, VA
2. Hynd G.W., Semrud-Clikeman M., Lorys A.R., et. al.: Brain morphology in developmental dyslexia and attention deficit disorder/hyperactivity. Arch Neurol 1990; 47: pp. 919-926.
3. Castellanos F.X., Giedd J.N., Eckburg P., et. al.: Quantitative morphology of the caudate nucleus in attention deficit hyperactivity disorder. Am J Psychiatry 1994; 151: pp. 1791-1796.
4. Filipek P.A., Semrud-Clikeman M., Steingard R.J., et. al.: Volumetric MRI analysis comparing subjects having attention-deficit hyperactivity disorder with normal controls. Neurology 1997; 48: pp. 89-601.
5. Castellanos F.X., Giedd J.N., Berquin P.C., et. al.: Quantitative brain magnetic resonance imaging in girls with attention-deficit/hyperactivity disorder. Arch Gen Psychiatry 2001; 58: pp. 289-295.
6. Castellanos F.X., Giedd J.N., Marsh W.L., et. al.: Quantitative brain magnetic resonance imaging in attention-deficit hyperactivity disorder. Arch Gen Psychiatry 1996; 53: pp. 607-616.
7. Mostofsky S.H., Cooper K.L., Kates W.R., et. al.: Smaller prefrontal and premotor volumes in boys with attention-deficit/hyperactivity disorder. Biol Psychiatry 2002; 52: pp. 785-794.
8. Durston S., Hulshoff Pol H.E., Schnack H.G., et. al.: Magnetic resonance imaging of boys with attention-deficit/hyperactivity disorder and their unaffected siblings. J Am Acad Child Adolesc Psychiatry 2004; 43: pp. 332-340.
9. Carmona S., Villarroya O., Bielsa A., et. al.: Global and regional gray matter reductions in ADHD: a voxel-based morphometric study. Neurosci Lett 2005; 389: pp. 88-93.
10. Mc Alonan G.M., Cheung V., Chua S.E., et. al.: Mapping brain structure in attention deficit-hyperactivity disorder: A voxel-based MRI study of regional grey and white matter volume. Psychiatry Res 2007; 154: pp. 171-180.
11. Seidman L.J., Valera E.M., Makris N., et. al.: Dorsolateral prefrontal and anterior cingulate cortex volumetric abnormalities in adults with attention-deficit/hyperactivity disorder identified by magnetic resonance imaging. Biol Psychiatry 2006; 60: pp. 1071-1080.
12. Zametkin A.J., Nordahl T.E., Gross M., et. al.: Cerebral glucose metabolism in adults with hyperactivity of childhood onset. N Engl J Med 1990; 323: pp. 1361-1366.
13. Zametkin A.J., Liebenauer L.L., Fitzgerald G.A., et. al.: Brain metabolism in teenagers with attention-deficit hyperactivity disorder. Arch Gen Psychiatry 1993; 50: pp. 33-340.
14. Ernst M., Cohen R.M., Liebenauer L.L., et. al.: Cerebral glucose metabolism in adolescent girls with attention-deficit/hyperactivity disorder. J Am Acad Child Adolesc Psychiatry 1997; 36: pp. 1399-1406.
15. Yeo R.A., Hill D.E., Campbell R.A., et. al.: Proton magnetic resonance spectroscopy investigation of the right frontal lobe in children with attention-deficit/hyperactivity disorder. J Am Acad Child Adolesc Psychiatry 2003; 42: pp. 303-310.
16. Courvoisie H., Hooper S.R., Fine C., et. al.: Neurometabolic functioning and neuropsychological correlates in children with ADHD: preliminary findings. Neuropsychiatry Clin Neurosci 2004; 16: pp. 63-69.
17. Fayed N., Modrego P.J.: Comparative study of the cerebral white matter in autism and attention-deficit/hyperactivity disorder by means of magnetic resonance spectroscopy. Acad Radiol 2005; 12: pp. 566-569.
18. Modrego P.J., Pina M.A., Fayed N., et. al.: Changes in metabolite ratios after treatment with rivastigmine in Alzheimer’s disease. CNS Drugs 2006; 20: pp. 867-877.
19. Solanto M.V.: Dopamine dysfunction in AD/HD: integrating clinical and basic neuroscience research. Behav Brain Res 2002; 130: pp. 65-71.
20. Madras B.K., Miller G.M., Fischman A.J.: The dopamine transporter and attention-deficit/hyperactivity disorder. Biol Psychiatry 2005; 57: pp. 1397-1409.
21. Volkow N.D., Wang G.J., Newcorn J., et. al.: Brain dopamine transporter levels in treatment and drug naive adults with ADHD. Neuroimage 2007; 34: pp. 1182-1190.
22. Ernst M., Zametkin A.J., Matochilk J.A., et. al.: High midbrain 18F-Dopa accumulation in children with ADHD. Am J Psychiatry 1999; 156: pp. 1209-1215.
23. Castellanos F.X., Elia J., Kruesi M.J., et. al.: Cerebrospinal fluid monoamine metabolites in boys with attention-deficit/hyperactivity disorder. Neuropsychopharmacology 1996; 14: pp. 125-137.
24. Ashtari M., Kumra S., Bhaskar S.L., et. al.: Attention-deficit/hyperactivity disorder: a preliminary diffusion tensor imaging study. Biol Psychiatry 2005; 57: pp. 448-455.
25. Barker P.B.: N-acetyl-aspartate: a neuronal marker?. Ann Neurol 2001; 49: pp. 423-424.
26. Clark J.B.: N-acetyl-aspartate: a marker for neuronal loss or mitochondrial dysfunction. Dev Neurosci 1998; 20: pp. 271-276.
27. Toft P.B., Leth H., Lou H.C., et. al.: Metabolite concentrations in the developing brain estimated with proton MR spectroscopy. J Magn Reson Imaging 1994; 4: pp. 674-680.
28. Kato T., Nishina M., Matshushita K., et. al.: Neuronal maturation and N-acetyl-L-aspartic acid development in human fetal and child brains. Brain Dev 1997; 19: pp. 131-133.
29. Murphy D.G., Critchley H.D., Schmitz N., et. al.: Asperger syndrome: a proton magnetic resonance spectroscopy study of the brain. Arch Gen Psychiatry 2002; 59: pp. 885-891.
30. Hesslinger B., Thiel T., Tebartz van Elst L., et. al.: Attention-deficit disorder in adults with or without hyperactivity; where is the difference?. Neurosci Lett 2001; 304: pp. 117-119.
31. Sun L., Jin Z., Zang Y.F., et. al.: Differences between attention-deficit disorder with and without hyperactivity: a 1H-magnetic resonance spectroscopy study. Brain Dev 2005; 27: pp. 340-344.
32. Jin Z., Zang Y.F., Zeng Y.W., et. al.: Striatal neuronal loss or dysfunction and choline rise in children with attention-deficit hyperactivity disorder a 1H-magnetic resonance spectroscopy study. Neurosci Lett 2001; 315: pp. 45-48.
33. Perlov E., Philipsen A., Hesslinger B., et. al.: Reduced cingulate glutamate/glutamine-to-creatine ratios in adult patients with attention deficit/hyperactivity disorder. Psychiatry Res 2007; epub ahead of print
34. Carrey N., MacMaster F.P., Fogel J., et. al.: Metabolite changes resulting from treatment in children with ADHD: a 1H-MRS study. Clin Neuropharmacol 2003; 26: pp. 218-221.
35. Carrey N.J., MacMaster F.P., Gaudet L., et. al.: Striatal creatine and glutamate/glutamine in attention-deficit/hyperactivity disorder. J Child Adolesc Psychopharmacol 2007; 17: pp. 11-17.
36. Kreis R., Ernst T., Ross B.D.: Development of the human brain: in vivo quantification of metabolite and water content with proton magnetic resonance spectroscopy. Magn Reson Med 1993; 30: pp. 424-437.