
Rationale and Objectives
During aging, there is evidence of microstructural changes in certain cortical and subcortical brain regions. Diffusion tensor imaging (DTI) is used to study age related microstructural changes in the acoustic pathway.
Materials and Methods
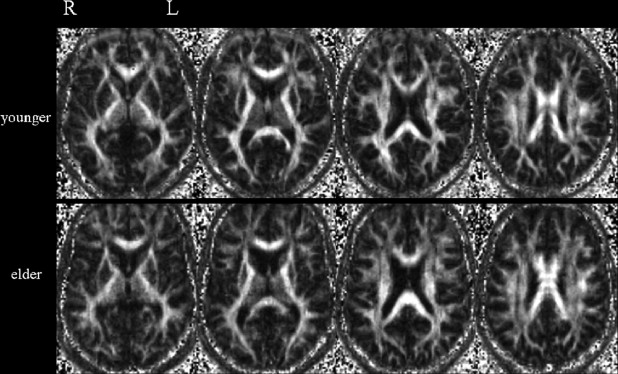
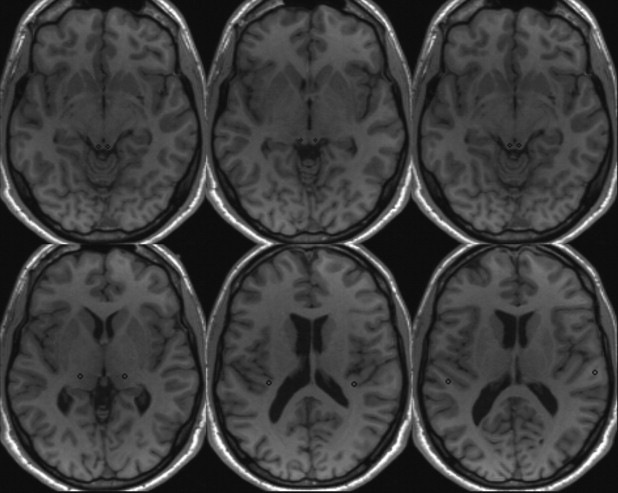
Twenty healthy volunteers (mean age 28.5 years) and 15 healthy volunteers (mean age 61.3 years) were examined using a 1.5-T MR system with a high-resolution T1-weighted sequence and an integrated parallel imaging technique DTI Echo-planar-imaging (EPI) sequence. For reliability, 10 subjects underwent a second examination 2 days later. The fractional anisotropy (FA) and the apparent diffusion coefficient (ADC) were measured in six brain regions of the auditory pathway.
Results
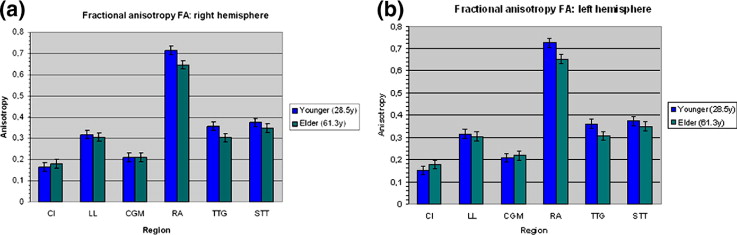
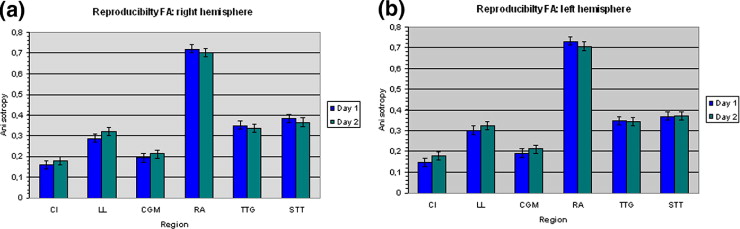
We found no left/right asymmetry in the selected brain structures. There were no significant differences ( P < .05) in the ADC and FA in the lateral lemniscus and medial geniculate body of young and elderly subjects. However, FA was significantly increased ( P < .05) in the inferior colliculus and decreased in the auditory radiation, the superficial temporal gyrus, and the transverse temporal gyrus in the elder subjects than in the younger ones. There were no significant differences in anisotropy in subsequent examinations in the younger individuals.
Conclusions
These findings suggest evidence of age-related changes in the acoustic pathway. These changes are associated with a decrease in anisotropy mainly in the cortical grey and white matter rather than in the subcortical regions. Our DTI measurements were reproducible.
The aging brain shows a variety of micro- and macroscopic changes, which can result in some degree of functional decline. During aging, the auditory system undergoes numerous changes in its structure, function, and neurochemistry ( ). Age-related hearing changes have usually been attributed to changes in the cochlea, inducing a loss of sensory cells, atrophy of stria vascularis, and a loss of spiral ganglion cells ( ). However, there is strong evidence that changes in the ability of hearing is also due to changes in the central auditory system ( ). The anatomic structure of the acoustic pathway is organized as follows: The anatomic organization of the auditory system consists of a large ensemble of subcortical nuclei, connected with each other and with the auditory cortex through ascending and descending white matter fiber pathways, processing both serial and parallel information within the auditory system. The cochlear nerve connects the cochlear with the anterior and posterior cochlear nucleus in the brainstem. Then, the majority of fibres cross to the contralateral side (90%) and approximately 10% run ipsilaterally to connect the auditory nuclei with the superior olivary complex. The fibers of the pathway reach the medial geniculate body, which is the thalamic auditory relay station and are there transmitted bilateral toward the primary auditory cortices. The gyri directly involved in the auditory perception are the transverse temporal gyri (of Heschl) and the superior temporal gyrus. Diffusion tensor imaging (DTI), a recently emerged, exciting variation of magnetic resonance imaging (MRI), provides a unique opportunity to visualize the integrity of tissue microstructure and quantify the diffusion of water in various tissues noninvasively ( ). Tissues, which have a random microstructure, such as cerebrospinal fluid, show isotropic diffusion properties ( ). This means diffusion is equal in all directions. In contrast, in tissues that have a regularly ordered microstructure, such as brain white matter, water molecules behave in a sorted fashion, with a predominant motion direction and a given orientation, indicating a marked anisotropy in the diffusion properties ( ). The microstructural tissue changes can be expressed as FA (fractional anisotropy), which has no dimension and as mean diffusitivity (apparent diffusion coefficient, ADC) with ×10 −3 mm 2 /s ( ). These indices can be seen as complementary for the evaluation of brain tissue. Whereas ADC is a measure of the directionally averaged magnitude of diffusional motion of water molecules (= related to integrity of membranes), FA describes the degree of anisotropy the process of molecular diffusion (= degree of structural alignment) ( ). Previous DTI studies have shown white matter declines in normal aging and various neuropsychiatric disorders ( ). Two earlier studies investigating the acoustic pathway by the means of DTI were focused on patients with sensineuronal hearing loss ( ) and the FA value of Heschl’s gyrus in a normal population ( ). However, to the best of our knowledge, there is no previous study, investigating the aging of the acoustic pathway.
The major goal of this study was to evaluate the aging of structures of the acoustic pathway by means of measuring the mean diffusivity and anisotropy values in young healthy adults in comparison to elderly healthy adults. Therefore, we designed a DTI acquisition protocol, using integrated parallel imaging technique (iPAT) to investigate the anisotropy of the acoustic pathway. To analyze the reliability of anisotropy measurements, we investigated the reproducibility of our DTI measurements, using a second follow-up examination of our younger study group in the same experimental settings.
Material and methods
Subjects
Get Radiology Tree app to read full this article<
Get Radiology Tree app to read full this article<
Get Radiology Tree app to read full this article<
Image Acquisition
Get Radiology Tree app to read full this article<
Image Analysis
Get Radiology Tree app to read full this article<
Get Radiology Tree app to read full this article<
Region of Interest
Get Radiology Tree app to read full this article<
Get Radiology Tree app to read full this article<
Statistical Analysis
Get Radiology Tree app to read full this article<
Get Radiology Tree app to read full this article<
Results
Get Radiology Tree app to read full this article<
Table 1
Comparison of the ADC and FA Values for the Different Brain Regions of the Left and Right Hemisphere in the Younger Study Group
Comparison of Right and Left Hemisphere: Younger Subjects Region ADC (× 10 −3 mm 2 /s) FA Right Left_P_ Value Right Left_P_ Value Lateral lemniscus 0.805 (± 0.01) 0.801 (± 0.01) .198 0.32 (± 0.05) 0.32 (± 0.04) .979 Inferior colliculus 0.537 (± 0.02) 0.534 (± 0.03) .272 0.17 (± 0.03) 0.16 (± 0.02) .084 Medial geniculate body 0.644 (± 0.02) 0.653 (± 0.06) .758 0.21 (± 0.02) 0.21 (± 0.02) .758 Acoustic radiation 0.708 (± 0.07) 0.700 (± 0.05) .317 0.71 (± 0.03) 0.72 (± 0.02) .149 Heschl’s gyrus 0.779 (± 0.01) 0.755 (± 0.04) .262 0.37 (± 0.03) 0.37 (± 0.03) .463 Superior temp gyrus 0.762 (± 0.05) 0.743 (± 0.05) .174 0.37 (± 0.03) 0.37 (± 0.02) 0.943
ADC: apparent diffusion coefficient; FA: fractional anisotropy.
Mean values with standard deviation in parentheses.
P values < .05 indicate significant difference.
Table 2
Comparison of the ADC and FA Values for the Different Brain Regions of the Left and Right Hemisphere in the Elderly Study Group
Comparison of Right and Left Hemisphere: Elder Subjects Region ADC (× 10 −3 mm 2 /s) FA Right Left_P_ Value Right Left_P_ Value Lateral lemniscus 0.802 (± 0.02) 0.810 (± 0.02) .087 0.30 (± 0.01) 0.30 (± 0.02) .569 Inferior colliculus 0.552 (± 0.05) 0.543 (± 0.03) .258 0.18 (± 0.08) 0.18 (± 0.09) .277 Medial geniculate body 0.644 (± 0.02) 0.643 (± 0.02) .563 0.22 (± 0.02) 0.22 (± 0.02) .918 Acoustic radiation 0.737 (± 0.05) 0.725 (± 0.06) .463 0.64 (± 0.03) 0.65 (± 0.04) .277 Heschl’s gyrus 0.755 (± 0.04) 0.751 (± 0.06) .681 0.30 (± 0.03) 0.31 (± 0.03) .196 Superior temp gyrus 0.775 (± 0.04) 0.759 (± 0.06) .059 0.35 (± 0.01) 0.35 (± 0.01) .717
ADC: apparent diffusion coefficient; FA: fractional anisotropy.
Mean values with standard deviation in parentheses.
P values < .05 indicate significant difference.
Table 3
Average ADC and FA Values for the Different Brain Regions of the Younger and the Elder Subjects
Comparison of Younger vs Elder Subjects Region ADC (× 10 −3 mm 2 /s) FA Younger Older_P_ Value Younger Older_P_ Value Lateral lemniscus 0.801 (± 0.02) 0.805 (± 0.03) .658 0.31 (± 0.04) 0.31 (± 0.01) .691 Inferior colliculus 0.540 (± 0.04) 0.547 (± 0.02) .112 0.17 (± 0.02) 0.18 (± 0.06) .0006 Medial geniculate body 0.650 (± 0.05) 0.645 (± 0.02) .323 0.21 (± 0.02) 0,21 (± 0.01) .686 Acoustic radiation 0.700 (± 0.04) 0.732 (± 0.02) .067 0.71 (± 0.05) 0.64 (± 0.02) <.0001 Heschl’s gyrus 0.821 (± 0.01) 0.830 (± 0.03) .441 0.36 (± 0.04) 0.31 (± 0.05) <.0001 Superior temp gyrus 0.764 (± 0.01) 0.810 (± 0.06) .356 0.37 (± 0.02) 0.35 (± 0.03) <.0001
ADC: apparent diffusion coefficient; FA: fractional anisotropy.
Mean values with standard deviation in parentheses.
P values < .05 indicate significant difference.
Get Radiology Tree app to read full this article<
Get Radiology Tree app to read full this article<
Get Radiology Tree app to read full this article<
Get Radiology Tree app to read full this article<
Table 4
The P Values of the Follow-Up Examination of the Younger Study Group, Indicating Excellent Reproducibility ( P > .05) for the FA value (a) and the ADC (b)
a. FA P Values ( P < .05) Reproducibility: Younger Subjects Region Right Left 1. Scan 2. Scan_P_ Value 1. Scan 2. Scan_P_ Value Lateral lemniscus 0.32 (± 0.05) 0.28 (± 0.02) .176 0.32 (± 0.04) 0.30 (± 0.01) .240 Inferior colliculus 0.17 (± 0.03) 0.18 (± 0.04) .310 0.16 (± 0.02) 0.19 (± 0.03) .058 Medial geniculate body 0.21 (± 0.02) 0.19 (± 0.03) .091 0.21 (± 0.02) 0.19 (± 0.03) 0.128 Acoustic radiation 0.71 (± 0.03) 0.70 (± 0.01) .147 0.72 (± 0.02) 0.70 (± 0.02) .063 Heschl’s gyrus 0.37 (± 0.03) 0.35 (± 0.02) .35 0.37 (± 0.03) 0.35 (± 0.01) .553 Superior temp gyrus 0.37 (± 0.03) 0.38 (± 0.06) .466 0.37 (± 0.02) 0.37 (± 0.02) .695 b. ADC (× 10 –3 mm 2 /s) P Values ( P < .05) Reproducibility: Younger Subjects Region Right Left 1. Scan 2. Scan_P_ Value 1. Scan 2. Scan_P_ Value Lateral lemniscus 0.805 (± 0.01) 0.811 (± 0.06) .352 0.801 (± 0.01) 0.820 (± 0.06) .080 Inferior colliculus 0.537 (± 0.02) 0.540 (± 0.02) .753 0.534 (± 0.03) 0.552 (± 0.04) .053 Medial geniculate body 0.644 (± 0.02) 0.671 (± 0.04) .061 0.653 (± 0.06) 0.667 (± 0.04) .500 Acoustic radiation 0.708 (± 0.07) 0.691 (± 0.02) .485 0.700 (± 0.05) 0.718 (± 0.05) .159 Heschl’s gyrus 0.779 (± 0.01) 0.775 (± 0.05) .977 0.755 (± 0.04) 0.768 (± 0.01) .798 Superior temp gyrus 0.762 (± 0.05) 0.739 (± 0.03) .078 0.743 (± 0.05) 0.753 (± 0.02) .187
ADC: apparent diffusion coefficient (ADC); FA: fractional anisotropy (FA).
Mean values with standard deviation in parentheses.
Get Radiology Tree app to read full this article<
Discussion
Get Radiology Tree app to read full this article<
Get Radiology Tree app to read full this article<
Get Radiology Tree app to read full this article<
Get Radiology Tree app to read full this article<
Get Radiology Tree app to read full this article<
Get Radiology Tree app to read full this article<
Get Radiology Tree app to read full this article<
Get Radiology Tree app to read full this article<
References
1. Rauschecker J.P.: Auditory cortical plasticity: a comparison with other sensory systems. Trends Neurosci 1999; 22: pp. 74-80.
2. Syka F.: Plastic changes in the central auditory system after hearing loss, restoration of function, and during learning. Physiol Rev 2002; 82: pp. 601-636.
3. Ponton C.W., Vasama J.P., Tremblay K., et. al.: Plasticity in the adult human central auditory system: evidence from late-onset profound unilateral deafness. Hear Res 2001; 154: pp. 32-44.
4. Soucek S., Michaels L.: 1990.Springer VerlagLondon
5. Mendelson J.R., Lui B.: The effects of aging in the medial geniculate nucleus: a comparison with the inferior colliculus and auditory cortex. Hear Res 2004; 191: pp. 21-33.
6. Moore J.K., Niparko J.K., Miller M.R., et. al.: Effect of profound hearing loss on a central auditory nucleus. Am J Otol 1994; 15: pp. 588-595.
7. Sotak C.H.: Nuclear magnetic resonance (NMR) measurement of the apparent diffusion coefficient (ADC) of tissue water and its relationship to cell volume changes in pathological states. Neurochem Int 2004; 45: pp. 569-582.
8. Moseley M.E., Cohen Y., Mintorovitch J., et. al.: Early detection of ischemic injury: comparison of spectroscopy, diffusion-, T2-, and magnetic susceptibility-weighted MRI in cats. Acta Neurochir 1990; 51: pp. 207-209.
9. Le Bihan D., Mangin J.F., Poupon C., et. al.: Diffusion tensor imaging: concepts and applications. J Magn Reson Imaging 2001; 13: pp. 534-546.
10. Beaulieu C.: The basis of anisotropic water diffusion in the nervous system—a technical review. NMR Biomed 2002; 15: pp. 435-455.
11. Pierpaoli C., Jezzard P., Basser P.J., et. al.: Diffusion tensor MR imaging of the human brain. Radiology 1996; 201: pp. 637-648.
12. Moseley M.: Diffusion tensor imaging and aging-a review. NMR Biomed 2002; 15: pp. 553-560.
13. Sullivan E.V., Pfefferbaum A.: Diffusion tensor imaging in normal aging and neuropsychiatric disorders. Eur J Radiol 2003; 45: pp. 244-255.
14. Taylor W.D., Hsu E., Ranga Rama Krishnan K., et. al.: Diffusion tensor imaging: background, potential, and utility in psychiatric research. Biol Psychiatry 2004; 55: pp. 201-207.
15. Chang Y., Lee S.H., Lee Y.J., et. al.: Auditory neural pathway evaluation on sensorineural hearing loss using diffusion tensor imaging. NeuroReport 2004; 15: pp. 1699-1703.
16. Hiwatashi A., Zhong J., Ekholm S.E., et. al.: Fractional anisotropy is higher in Heschl’s gyrus than in superior temporal gyrus in normal subjects. Acad Radiol 2006; 13: pp. 73-76.
17. Basser P.J., Pierpaoli C.: A simplified method to measure the diffusion tensor from seven MR images. Magn Reson Med 1998; 39: pp. 928-934.
18. Basser P.J.: Cable equation for a myelinated axon derived from its microstructure. Med Biol Eng Comput 1993; 31: pp. 87-92.
19. Talairach J., Tournoux P.: 1988.ThiemeNew York
20. Drayer B.P.: Imaging of the aging brain, I: normal findings. Radiology 1988; 166: pp. 785-796.
21. Pfefferbaum A., Mathalon D.H., Sullivan E.V., et. al.: A quantitative magnetic resonance imaging study of changes in brain morphology from infancy to late adulthood. Arch Neurol 1994; 51: pp. 874-887.
22. Aboititz F., Rodriguez E., Olivares R., et. al.: Age-related changes in fibre composition of the human corpus callosum: sex differences. NeuroReport 1996; 7: pp. 1761-1764.
23. Ciccarelli O., Werring D.J., Barker G.J., et. al.: A study of the mechanisms of normal-appearing white matter damage in multiple sclerosis using diffusion tensor imaging-evidence of Wallerian degeneration. J Neurol 2003; 250: pp. 287-292.
24. Guo A.C., Jewells V.L., Provenzale J.M.: Analysis of normal-appearing white matter in multiple sclerosis: comparison of diffusion tensor MR imaging and magnetization transfer imaging. AJNR Am J Neuroradiol 2001; 22: pp. 1893-1900.
25. Werring D.J., Clark C.A., Barker G.J., et. al.: Diffusion tensor imaging of lesions and normal-appearing white matter in multiple sclerosis. Neurology 1999; 52: pp. 1626-1632.
26. Sorensen A.G., Copen W.A., Ostergaard L., et. al.: Hyperacute stroke: simultaneous measurement of relative cerebral blood volume, relative cerebral flow, and mean tissue transit time. Radiology 1999; 210: pp. 519-527.
27. Lim K.O., Hedeus M., Moseley M., et. al.: Compromised white matter tract integrity in schizophrenia inferred from diffusion tensor imaging. Arch Gen Psychiatry 1999; 56: pp. 367-374.
28. Pfefferbaum A., Adalsteinsson E., Sullivan E.V.: Replicability of diffusion tensor imaging measurements of fractional anisotropy and trace in brain. J Magn Reson Imaging 2003; 18: pp. 427-433.
29. Pfefferbaum A., Sullivan E.V., Hedehus M., et. al.: Age-related decline in brain white matter anisotropy measured with spatially corrected echo-planar diffusion tensor imaging. Magn Reson Med 2000; 44: pp. 259-268.
30. Sullivan E.V., Adalsteinsson E., Hedehus M., et. al.: Equivalent disruption of regional white matter microstructure in ageing healthy men and women. NeuroReport 2001; 12: pp. 99-104.
31. Willott J.F.: 1991.SingularSan Diego, Ca
32. Schmithorst V.J., Wilke M., Dardziinski B.J., et. al.: Correlation of white matter diffusivity and anisotropy with age during childhood and adolescence: a cross-sectional diffusion-tensor MR imaging study. Radiology 2002; 222: pp. 212-218.
33. Palombi P.S., Caspary D.M.: Physiology of the aged Fischer rat 344 inferior colliculus: responses to contralateral stimuli. J Neurophysiol 1996; 76: pp. 3114-3125.
34. Caspary D.M., Milbrandt J.C., Helfert R.H.: Central auditory aging: GABA changes in the inferior colliculus. Exp Gerontol 1995; 30: pp. 349-360.
35. Bronge L., Bogdanovic N., Wahlund L.O.: Postmortem MRI and histopathology of white matter changes in Alzheimer brains. Dement Geriatr Cogn Disord 2002; 13: pp. 205-212.
36. Meier-Ruge W., Ulrich J., Bruhlamnn M., et. al.: Age-related white matter atrophy in the human brain. Ann N Y Acad Sci 1992; 673: pp. 260-269.