
Rationale and Objectives
Imaging report turnaround time (RTAT) is an important measure of radiology performance and has become the leading priority in customer satisfaction surveys conducted among nonradiologists, who may not be familiar with the imaging workflow. Our aim was to assess physicians’ expected RTAT for commonly ordered studies and determine if satisfaction correlates with met expectations.
Materials and Methods
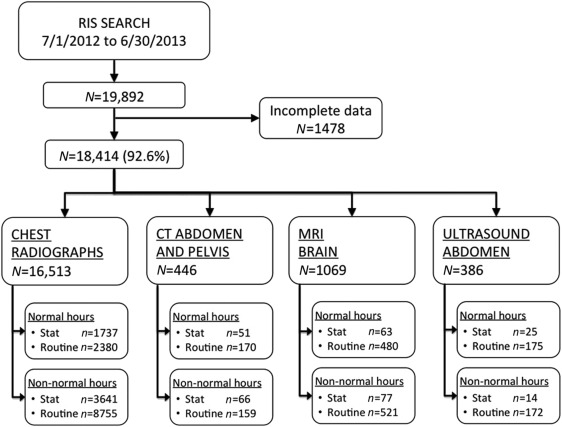
Retrospective review of inpatient imaging was conducted at a single academic institution, and RTAT for 18,414 studies was calculated. Examinations were grouped by study type, priority, and time of day. A cross-sectional survey instrument was completed by 48 internal medicine and surgery resident physicians with questions regarding RTAT and their level of satisfaction with various examinations.
Results
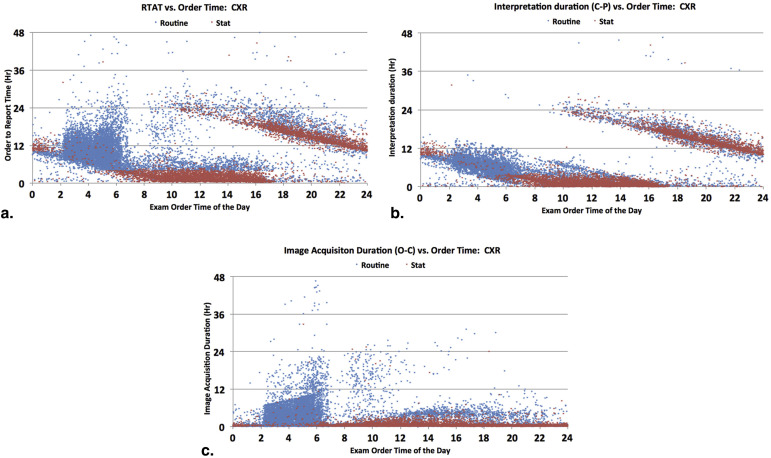
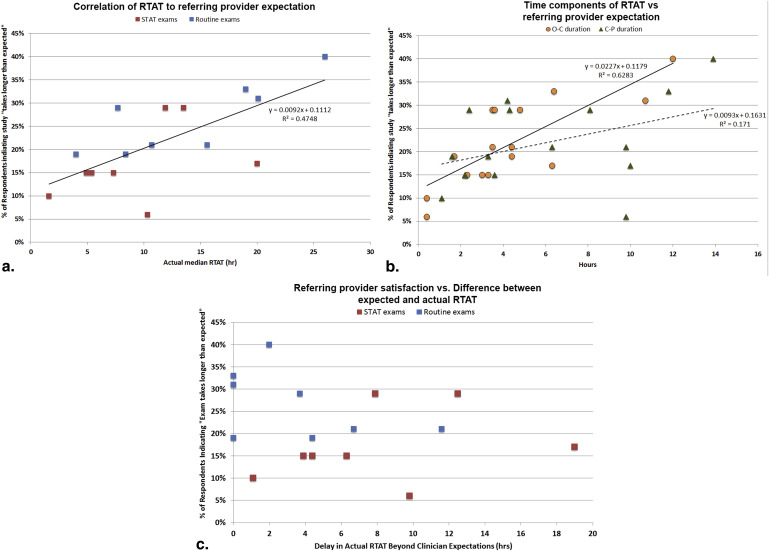
Actual RTAT ranged from 1.6 to 26.0 hours, with chest radiographs and computed tomographies generally faster than magnetic resonance images and ultrasounds. Urgent (STAT) examinations and those ordered during business hours have shorter RTAT. The time for image interpretation largely contributed to the RTAT because of the lack of night-time radiology coverage. Referring physician expectations were consistently shorter than actual RTAT, ranging from 30 minutes to 24 hours. Overall satisfaction scores were inversely correlated with RTAT, with a strong correlation to the time from study order to imaging (r 2 = 0.63) and a weak correlation to the image interpretation time (r 2 = 0.17). Satisfaction scores did not correlate with whether the actual RTAT met expectations (r 2 = 0.06).
Conclusions
Referring physician satisfaction is likely multifactorial. Although RTAT has been reported as a priority, shortening turnaround time alone may not directly improve clinician satisfaction.
Medical imaging report turnaround time (RTAT) is an important and recognized measure of radiology performance . Timely completion of a finalized radiology report has been a priority among ordering clinicians for over 30 years, and prolonged reporting times can negatively impact clinical outcomes and the perceived value of a radiologist . Multiple surveys conducted among clinicians have demonstrated that RTAT is a potential unmet need, and with increasing focus on volume and efficiency, turnaround time has become the leading factor affecting ordering customer satisfaction . Patients also desire faster diagnoses, with most expecting results “within a few hours” . Furthermore, future radiology reimbursements and pay-for-performance measures may increasingly focus on RTAT as a quality metric .
Although radiology workflow at most institutions is complex, with a myriad of steps and processes that affect RTAT, one significant cause of delays in turnaround time is reduced radiology staffing during evening hours and weekends . This has led to the adoption of night-time teleradiology coverage in many community practices. Although some academic groups have implemented around-the-clock attending radiology coverage with reductions in turnaround time , most academic programs remain with resident-only coverage during nontraditional work hours because of financial or education reasons .
Get Radiology Tree app to read full this article<
Get Radiology Tree app to read full this article<
Materials and methods
Get Radiology Tree app to read full this article<
Get Radiology Tree app to read full this article<
Get Radiology Tree app to read full this article<
Get Radiology Tree app to read full this article<
Get Radiology Tree app to read full this article<
Results
Get Radiology Tree app to read full this article<
Get Radiology Tree app to read full this article<
Get Radiology Tree app to read full this article<
Table 1
Median Report Turnaround Times for Common Inpatient Radiology Studies
Total Normal Hours (M-F 7a-4p) Nonnormal Hours Routine Stat_P_ Value Routine Stat_P_ Value Chest radiographs, inpatient Sample size, n (%) 16,513 2380 (14.4) 1737 (10.5) 8755 (53.0) 3641 (22.1) Total RTAT, median (25%–75% qtr), h 9.3 (4.3–13.7) 4.0 (2.1–7.8) 1.6 (0.9–2.6) <.001 10.7 (8.1–14.0) 10.3 (5.0–14.9) <.001 O-C duration, median (25%–75% qtr), h 1.3 (0.4–4.2) 1.7 (0.6–4.2) 0.4 (0.3–0.6) 3.5 (1.4–5.5) 0.4 (0.3–0.5) C-P duration, median (25%–75% qtr), h 5.6 (2.4–9.3) 1.6 (0.6–3.8) 1.1 (0.5–2.0) 6.3 (4.5–8.6) 9.8 (4.4–14.4) CT abdomen and pelvis, inpatient Sample size, n (%) 446 170 (38.1) 51 (11.4) 159 (35.7) 66 (14.8) Total RTAT, median (25%–75% qtr), h 9.6 (5.6–19.9) 8.4 (5.8–21.8) 5.4 (4.4–7.1) <.001 15.6 (9.0–20.6) 7.3 (4.2–11.8) <.001 O-C duration, median (25%–75% qtr), h 3.8 (2.2–6.1) 4.4 (1.8–6.9) 3.3 (1.7–4.2) 4.4 (2.4–6.5) 2.3 (1.3–3.9) C-P duration, median (25%–75% qtr), h 4.0 (1.8–12.7) 3.3 (1.7–14.9) 2.2 (1.5–4.2) 9.8 (2.9–15.1) 3.6 (1.6–9.5) MRI brain, inpatient Sample size, n (%) 1069 408 (38.2) 63 (5.9) 521 (48.7) 77 (7.2) Total RTAT, median (25%–75% qtr), h 21.7 (15.5–27.2) 26.0 (22.4–29.8) 20.0 (6.0–24.7) <.001 19.0 (14.4–25.5) 13.5 (7.3–19.2) <.001 O-C duration, median (25%–75% qtr), h 8.2 (4.6–14.1) 12.0 (8.4–18.2) 6.3 (3.1–9.1) 6.4 (4.0–12.3) 3.5 (2.3–4.7) C-P duration, median (25%–75% qtr), h 12.4 (6.1–16.1) 13.9 (8.2–16.8) 10.0 (2.1–15.7) 11.8 (6.3–15.5) 8.1 (2.7–13.9) Ultrasound abdomen, inpatient Sample size, n (%) 386 175 (45.3) 25 (6.5) 172 (44.6) 14 (3.6) Total RTAT, median (25%–75% qtr), h 16.4 (6.1–25.1) 7.7 (4.8–23.7) 4.9 (3.6–8.8) NS 20.1 (13.9–26.8) 11.9 (3.6–24.4) NS O-C duration, median (25%–75% qtr), h 6.2 (2.5–15.5) 4.8 (2.4–8.1) 3.0 (1.7–4.2) 10.7 (4.0–17.3) 3.6 (1.9–9.5) C-P duration, median (25%–75% qtr), h 3.0 (1.1–15.8) 2.4 (0.9–4.8) 2.2 (0.7–6.5) 4.2 (1.9–18.1) 4.3 (0.7–18.4)
CT, computed tomography; M-F, monday to friday; MRI, magnetic resonance imaging; Qtr, Quartiles; RTAT, report turnaround time.
Get Radiology Tree app to read full this article<
Get Radiology Tree app to read full this article<
Get Radiology Tree app to read full this article<
Get Radiology Tree app to read full this article<
Get Radiology Tree app to read full this article<
Get Radiology Tree app to read full this article<
Table 2
Referring Provider Survey Results and Comparison to Actual Radiology Performance
“How Long Do You Think It Should Take to Get a Report?” (h) % Indicating “It Takes Longer than Expected to Get a Report” Actual RTAT, median (25%–75% qtr), h Difference Between RTAT Performance and Expectation (h) ∗ Chest radiographs Normal hours Stat priority <0.5 10 1.6 (0.9–2.6) 1.1 Routine priority 1–4 19 4.0 (2.1–7.8) 0.0 † Non-normal hours Stat priority <0.5 6 10.3 (5.0–14.9) 9.8 Routine priority 1–4 21 10.7 (8.1–14.0) 6.7 CT abdomen and pelvis Normal hours Stat priority 0.5–1 15 5.4 (4.4–7.1) 4.4 Routine priority 1–4 19 8.4 (5.8–21.8) 4.4 Non-normal hours Stat priority 0.5–1 15 7.3 (4.2–11.8) 6.3 Routine priority 1–4 21 15.6 (9.0–20.6) 11.6 MRI brain Normal hours Stat priority 0.5–1 17 20.0 (6.0–24.7) 19.0 Routine priority 4–24 40 26.0 (22.4–29.8) 2.0 Non-normal hours Stat priority 0.5–1 29 13.5 (7.3–19.2) 12.5 Routine priority 4–24 33 19.0 (14.4–25.5) 0.0 † Ultrasound abdomen Normal hours Stat priority 0.5–1 15 4.9 (3.6–8.8) 3.9 Routine priority 1–4 29 7.7 (4.8–23.7) 3.7 Non-normal hours Stat priority 1–4 29 11.9 (3.6–24.4) 7.9 Routine priority 4–24 31 20.1 (13.9–26.8) 0.0 †
CT, computed tomography; MRI, magnetic resonance imaging; Qtr, Quartiles; RTAT, report turnaround time.
Get Radiology Tree app to read full this article<
Get Radiology Tree app to read full this article<
Get Radiology Tree app to read full this article<
Get Radiology Tree app to read full this article<
Get Radiology Tree app to read full this article<
Get Radiology Tree app to read full this article<
Get Radiology Tree app to read full this article<
Get Radiology Tree app to read full this article<
Get Radiology Tree app to read full this article<
Discussion
Get Radiology Tree app to read full this article<
Get Radiology Tree app to read full this article<
Get Radiology Tree app to read full this article<
Get Radiology Tree app to read full this article<
Get Radiology Tree app to read full this article<
Get Radiology Tree app to read full this article<
Get Radiology Tree app to read full this article<
Get Radiology Tree app to read full this article<
Acknowledgments
Get Radiology Tree app to read full this article<
Supplementary data
Get Radiology Tree app to read full this article<
Appendix 1
Get Radiology Tree app to read full this article<
Get Radiology Tree app to read full this article<
Get Radiology Tree app to read full this article<
References
1. International Radiology Quality Network (IRQN), Performance Metrics and Indicators Project Workgroup.
2. ACR practice guideline for communication of diagnostic imaging findings. www.acr.org . 2010.
3. Vogel G.E., Givey J.: X-ray report turnaround studies. Radiol Manage 1984; 6: pp. 12-15.
4. Boland G.: Stakeholder expectations for radiologists: obstacles or opportunities?. J Am Coll Radiol 2006; 3: pp. 156-163.
5. Clinger N.J., Hunter T.B., Hillman B.J.: Radiology reporting: attitudes of referring physicians. Radiology 1988; 169: pp. 825-826.
6. Reiner B, Siegel E. Reinventing the radiology report, 2: time to adapt. Imaging Economics. Available at: http://www.imagingeconomics.com/2004/12/reinventing-the-radiology-report-2-time-to-adapt/ . Accessed June 30, 2014.
7. Lund I, Krent S, Lin C, et al. The changing radiologist role: key imperatives for securing health system alignment and radiology group prosperity. The Advisory Board Company. Available at: http://www.advisory.com/research/imaging-performance-partnership/studies/2012/the-changing-radiologist-role/elevating-the-physician-service-standard/perfect-read-and-report-radiology . Accessed June 30, 2014.
8. Basu P.A., Ruiz-Wibbelsmann J.A., Spielman S.B., et. al.: Creating a patient-centered imaging service: determining what patients want. Am J Roentgenol 2011; 196: pp. 605-610.
9. Fields R. 5 ways to improve pay-for-performance from the CEO, CMO and COO of Advocate Health Care. Becker’s Hospital Review. Available at: http://www.beckershospitalreview.com/hospital-management-administration/5-ways-to-improve-pay-for-performance-from-the-ceo-cmo-and-coo-of-advocate-health-care.html . Accessed June 30, 2014.
10. Boland G., Halpern E.F., Gazelle G.S.: Radiologist report turnaround time: impact of pay-for-performance measures. Am J Roentgenol 2010; 195: pp. 707-711.
11. Spigos D., Mueller L.F., Mueller C.: 24-hour coverage by attending physicians: a new paradigm. Am J Roentgenol 1996; 167: pp. 1089-1090.
12. Velmahos G.C., Fili C., Vassiliu P., et. al.: Around-the-clock attending radiology coverage is essential to avoid mistakes in the care of trauma patients. Am Surg 2001; 67: pp. 1175-1177.
13. Steele R.D., Kerr H.H.: 24-hour radiology. Am J Roentgenol 1997; 169: pp. 953-954.
14. Hunter T.B., Taljanovic M.S., Krupinski E., et. al.: Academic radiologists’ on-call and late-evening duties. J Am Coll Radiol 2007; 4: pp. 716-719.
15. Collins J., Gruppen L.D., Bailey J.E., et. al.: 24/7/365 in-house radiologist coverage: effects on resident education. Acad Radiol 2014; 21: pp. 842-850.
16. Howanitz P.J., Cembrowski G.S., Steindel S.J., et. al.: Physician goals and laboratory test turnaround times. A College of American Pathologists Q-Probes study of 2763 clinicians and 722 institutions. Arch Pathol Lab Med 1993; 117: pp. 22-28.
17. Seltzer S.E., Kelly P., Adams D.F., et. al.: Expediting the turnaround of radiology reports: use of total quality management to facilitate radiologists’ report signing. Am J Roentgenol 1994; 162: pp. 775-781.
18. Escher, A, Heye, T, Merkle, E. Implementation of a pseudonymized feedback system to improve individual turnaround-times for radiology reports. Radiological Society of North America 2013 Scientific Assembly and Annual Meeting, Chicago IL.
19. Hobson, C. An even keel. American College of Radiology. Available at: http://www.acr.org/News-Publications/News/News-Articles/2014/ACR-Bulletin/201402-An-Even-Keel . Accessed June 30, 2014.
20. Krupinski E.A., Berbaum K.S., Caldwell R.T., et. al.: Do long radiology workdays affect nodule detection in dynamic CT interpretation?. J Am Coll Radiol 2012; 9: pp. 191-198.
21. Zhang L., Hefke A., Figiel J., et. al.: Identifying radiological needs of the referring clinicians. J Digit Imaging 2013; 26: pp. 393-401.
22. Tappouni R, Sarwani N, Bruno M. What does the ‘customer’ really want? How do clinicians read the radiology report and what are their preferences regarding communication of unexpected findings: a survey of academic center staff physicians. Radiological Society of North America 2009 Scientific Assembly and Annual Meeting, Chicago IL.
23. Kane B.: Point-of-care testing: instant gratification?. Ann Intern Med 1999; 130: pp. 870-872.
24. Japsen B. Commentary: doctors may soon be paid for not making you wait. Forbes Magazine. Available at: http://www.forbes.com/sites/brucejapsen/2014/07/06/doctors-may-soon-be-paid-for-not-making-you-wait/ . Accessed July 8, 2014.