
Rationale and Objectives
The aim of this study was to investigate whether samples obtained using two kinds of small trephines, 2.4 and 1.8 mm in inner diameter, are sufficient for the quantitative evaluation of metabolic bone disease using micro–computed tomographic (CT) three-dimensional parameter data sets.
Materials and Methods
A total of 19 porcine lumbar vertebrae prior to biopsy and biopsy samples from the use of 2.4- and 1.8-mm trephines were examined using micro–CT imaging. For quantitative analysis, seven three-dimensional structural parameters, including trabecular bone volume, trabecular number, trabecular thickness, trabecular separation, the structure model index, the degree of anisotropy, and the trabecular bone pattern factor, were measured using CtAn software. The difference and agreement between the biopsy samples and the baseline vertebrae specimens before biopsy were assessed using paired t tests and Bland-Altman anaylsis, respectively.
Results
There were no significant differences between the 2.4-mm samples and the baseline vertebrae specimens for trabecular bone volume, trabecular thickness, and trabecular number, with mean differences of −0.9%, 2.3%, and −3.1%, respectively; there was no significant difference between the 1.8-mm samples and the baseline vertebrae specimens only for trabecular thickness, with a mean difference of 1.9%.
Conclusion
Samples taken from the use of the 2.4-mm trephine were better for quantitative analysis than those from the use of the 1.8-mm trephine and were acceptable for the quantitative evaluation of trabecular bone volume, trabecular thickness, and trabecular number.
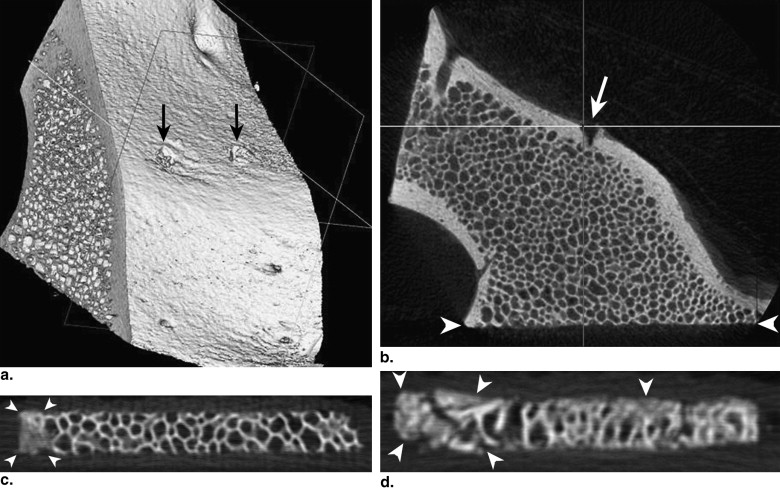
Bone biopsies have been used with increasing frequency for the diagnosis of metabolic bone diseases and for research purposes . In terms of microstructure analysis from a bone biopsy, an appropriate sample size is a major determinant for the accurate qualitative and quantitative histologic diagnosis of metabolic bone disease . Crushing artifacts that occur during the retrieval of samples can cause morphometric differences by resulting in structural damage and compression. Therefore, a biopsy resulting in a bone core with diameter ≥ 5 mm is recommended . More invasive techniques are required for bone specimens of increasing size; thus, it is important to establish a sample size that is sufficient for accurate and representative histologic results. To identify the smallest sample size that can be used with consistency and reliability, several investigations have been undertaken and have reached differing conclusions .
Standard bone histomorphometry has been used as the gold standard to assess trabecular microstructure, but it is time consuming, invasive, and subject to artifacts during preparation. Shrinkage during the cutting process will inevitably lead to the distortion of specimens . Recent advances in the use of micro–computed tomographic (CT) imaging have made it feasible to perform three-dimensional bone structural evaluations nondestructively, quickly, and more simply because of the absence of preparation and may provide high reproducibility and accuracy . Therefore, micro-CT three-dimensional data sets can be used as a substitute for conventional histologic sections for bone structural evaluations . To the best of our knowledge, there has been no report on the smallest sample size that is sufficient for the quantitative diagnosis of metabolic bone disease by using micro-CT imaging instead of histomorphometry.
Get Radiology Tree app to read full this article<
Materials and methods
Specimens
Get Radiology Tree app to read full this article<
Get Radiology Tree app to read full this article<
Micro-CT Protocol
Get Radiology Tree app to read full this article<
Micro-CT Scanning
Get Radiology Tree app to read full this article<
Quantitative Analysis Using Micro-CT Three-dimensional Trabecular Parameters
Get Radiology Tree app to read full this article<
Get Radiology Tree app to read full this article<
Get Radiology Tree app to read full this article<
TbPf=(P1−P2)/(A1−A2), TbPf
=
(
P
1
−
P
2
)
/
(
A
1
−
A
2
)
,
Get Radiology Tree app to read full this article<
Get Radiology Tree app to read full this article<
SMI=6(BS’×BV/BS2), SMI
=
6
(
BS
’
×
BV
/
BS
2
)
,
Get Radiology Tree app to read full this article<
Get Radiology Tree app to read full this article<
Get Radiology Tree app to read full this article<
Statistical Analysis
Get Radiology Tree app to read full this article<
Results
Quantitative Analysis Using Micro-CT Three-dimensional Trabecular Parameters
Agreement and Difference Between the Baseline Vertebrae Specimens and Samples Taken Using the 2.4-mm Trephine
Get Radiology Tree app to read full this article<
Table 1
Agreement and Comparison Between the 3D Micro-CT Parameters of Baseline Vertebrae Specimens and the 2.4-mm Trephine Biopsy Samples Using Bland-Altman Methods and the Paired t -Test
Baseline Specimen 2.4-mm Sample Agreement ∗ Comparison † Measurement Mean ± SD Mean ± SD Mean Difference (%) 95% Confidence Interval_P_ Value BV/TV 43.38 ± 5.21 43.72 ± 4.87 −0.9 −18.0 to 16.2 .69 Tb. Th 12.28 ± 0.78 12.04 ± 1.14 2.2 −22.8 to 27.2 .49 Tb. N 0.035 ± 0.0043 0.036 ± 0.0040 −3.1 −29.1 to 22.9 .34 Tb. Sp 22.39 ± 3.13 18.02 ± 2.31 22.7 −35.4 to 80.8 .003 Tb. Pf −0.036 ± 0.022 0.073 ± 0.067 388.8 −6201.7 to 6979.2 <.0001 SMI 0.44 ± 0.37 1.51 ± 0.51 −121.4 −249.0 to 6.2 <.0001 DA 20.31 ± 27.39 10.16 ± 19.01 63.1 −137.6 to 263.8 .23
3D, three-dimensional; BV/TV, trabecular bone volume; CT, computed tomography; DA, degree of anisotropy; SMI, structural model index; Tb. N, trabecular number; Tb. Pf: trabecular bone fraction factor; Tb.Sp: trabecular separation; Tb.Th, trabecular thickness.
Get Radiology Tree app to read full this article<
Get Radiology Tree app to read full this article<
Get Radiology Tree app to read full this article<
Agreement and Difference Between the Baseline Vertebrae Specimens and Samples Taken Using the 1.8-mm Trephine
Get Radiology Tree app to read full this article<
Table 2
Agreement and Comparison Between the 3D Micro-CT Parameters of the Baseline Vertebrae Specimens and the 1.8-mm Trephine Biopsy Samples Using Bland-Altman Methods and the Paired t -Test
Baseline Specimen 1.8-mm Sample Agreement ∗ Comparison † Measurement Mean ± SD Mean ± SD Mean Difference (%) 95% Confidence Interval_P_ Value BV/TV 42.81 ± 5.15 47.81 ± 7.02 −10.7 −31.6 to 10.2 .0003 Tb. Th 12.38 ± 0.81 12.17 ± 1.20 1.9 −18.7 to 22.6 .49 Tb. N 0.035 ± 0.0043 0.039 ± 0.0048 −12.6 −34.9 to 9.7 .0001 Tb. Sp 23.02 ± 3.78 14.39 ± 2.62 45.8 5.0 to 86.5 <.0001 Tb. Pf −0.031 ± 0.025 0.099 ± 0.053 −273.7 −2378.6 to 1831.1 <.0001 SMI 0.59 ± 0.34 1.88 ± 0.43 −111.1 −197.6 to −24.6 <.0001 DA 14.27 ± 12.53 5.84 ± 3.00 55.8 −105.5 to 217.1 .0135
3D, three-dimensional; BV/TV, trabecular bone volume; CT, computed tomography; DA, degree of anisotropy; SMI, structural model index; Tb. N, trabecular number; Tb. Pf: trabecular bone fraction factor; Tb.Sp: trabecular separation; Tb.Th, trabecular thickness.
Get Radiology Tree app to read full this article<
Get Radiology Tree app to read full this article<
Get Radiology Tree app to read full this article<
Discussion
Get Radiology Tree app to read full this article<
Get Radiology Tree app to read full this article<
Get Radiology Tree app to read full this article<
Get Radiology Tree app to read full this article<
Get Radiology Tree app to read full this article<
Acknowledgment
Get Radiology Tree app to read full this article<
Get Radiology Tree app to read full this article<
References
1. Trueba D., Sawaya B.P., Mawad H., Malluche H.H.: Bone biopsy: indications, techniques, and complications. Semin Dial 2003; 16: pp. 341-345.
2. Boutry N., Cortet B., Dubois P., Marchandise X., Cotten A.: Trabecular bone structure of the calcaneus: preliminary in vivo MR imaging assessment in men with osteoporosis. Radiology 2003; 227: pp. 708-717.
3. Legrand E., Chappard D., Pascaretti C., et. al.: Trabecular bone microarchitecture, bone mineral density, and vertebral fractures in male osteoporosis. J Bone Miner Res 2000; 15: pp. 13-19.
4. Majumdar S., Newitt D., Jergas M., et. al.: Evaluation of technical factors affecting the quantification of trabecular bone structure using magnetic resonance imaging. Bone 1995; 17: pp. 417-430.
5. Monier-Faugere M.C., Mawad H., Qi Q., Friedler R.M., Malluche H.H.: High prevalence of low bone turnover and occurrence of osteomalacia after kidney transplantation. J Am Soc Nephrol 2000; 11: pp. 1093-1099.
6. Langub M.C., Faugere M.C., Malluche H.H.: Molecular bone morphometry. Pediatr Nephrol 2000; 14: pp. 629-635.
7. Faugere M.C., Malluche H.H.: Comparison of different bone-biopsy techniques for qualitative and quantitative diagnosis of metabolic bone diseases. J Bone Joint Surg Am 1983; 65: pp. 1314-1318.
8. Vigorita V.J.: The bone biopsy protocol for evaluating osteoporosis and osteomalacia. Am J Surg Pathol 1984; 8: pp. 925-930.
9. Ward J.C., Jeanneret B., Oehlschlegel C., Magerl F.: The value of percutaneous transpedicular vertebral bone biopsies for histologic examination. Results of an experimental histopathologic study comparing two biopsy needles. Spine 1996; 21: pp. 2484-2490.
10. Moore R.J., Durbridge T.C., Woods A.E., Vernon-Roberts B.: Comparison of two bone trephine instruments used for quantitative histomorphometry. J Clin Pathol 1989; 42: pp. 213-215.
11. Roberts C.C., Morrison W.B., Leslie K.O., Carrino J.A., Lozevski J.L., Liu P.T.: Assessment of bone biopsy needles for sample size, specimen quality and ease of use. Skeletal Radiol 2005; 34: pp. 329-335.
12. Fyfe I., Henry A., Mulholland R.: Closed vertebral biopsy. J Bone Joint Surg (Br) 1983; 65: pp. 140-143.
13. Thomsen J.S., Laib A., Koller B., Prohaska S., Mosekilde L., Gowin W.: Stereological measures of trabecular bone structure: comparison of 3D micro computed tomography with 2D histological sections in human proximal tibial bone biopsies. J Microsc 2005; 218: pp. 171-179.
14. Uchiyama T., Tanizawa T., Muramatsu H., Endo N., Takahashi H.E., Hara T.: A morphometric comparison of trabecular structure of human ilium between microcomputed tomography and conventional histomorphometry. Calcif Tissue Int 1997; 61: pp. 493-498.
15. Nagele E., Kuhn V., Vogt H., et. al.: Technical considerations for microstructural analysis of human trabecular bone from specimens excised from various skeletal sites. Calcif Tissue Int 2004; 75: pp. 15-22.
16. David V., Laroche N., Boudignon B., et. al.: Noninvasive in vivo monitoring of bone architecture alterations in hindlimb-unloaded female rats using novel three-dimensional microcomputed tomography. J Bone Miner Res 2003; 18: pp. 1622-1631.
17. Chappard D., Retailleau-Gaborit N., Legrand E., Basle M.F., Audran M.: Comparison insight bone measurements by histomorphometry and microCT. J Bone Miner Res 2005; 20: pp. 1177-1184.
18. Rupprecht M., Pogoda P., Mumme M., Rueger J.M., Puschel K., Amling M.: Bone microarchitecture of the calcaneus and its changes in aging: a histomorphometric analysis of 60 human specimens. J Orthop Res 2006; 24: pp. 664-674.
19. Guggenbuhl P., Bodic F., Hamel L., Basle M.F., Chappard D.: Texture analysis of x-ray radiographs of iliac bone is correlated with bone micro-CT. Osteoporos Int 2006; 17: pp. 447-454.
20. Cooper D.M., Matyas J.R., Katzenberg M.A., Hallgrimsson B.: Comparison of microcomputed tomographic and microradiographic measurements of cortical bone porosity. Calcif Tissue Int 2004; 74: pp. 437-447.
21. Pothuaud L., Laib A., Levitz P., Benhamou C.L., Majumdar S.: Three-dimensional-line skeleton graph analysis of high-resolution magnetic resonance images: a validation study from 34-microm-resolution microcomputed tomography. J Bone Miner Res 2002; 17: pp. 1883-1895.
22. Ito M., Ohki M., Hayashi K., Yamada M., Uetani M., Nakamura T.: Trabecular texture analysis of CT images in the relationship with spinal fracture. Radiology 1995; 194: pp. 55-59.
23. Hildebrand T., Ruegsegger P.: A new method for the model-independent assessment of thickness in three dimensional images. J Microsc 1997; 185: pp. 67-75.
24. Hahn M., Vogel M., Pompesius-Kempa M., Delling G.: Trabecular bone pattern factor—a new parameter for simple quantification of bone microarchitecture. Bone 1992; 13: pp. 327-330.
25. Whitehouse W.J.: The quantitative morphology of anisotropic trabecular bone. J Microsc 1974; 101: pp. 153-168.
26. Bland J.M., Altman D.G.: Statistical methods for assessing agreement between two methods of clinical measurement. Lancet 1986; 1: pp. 307-310.