
Rationale and Objectives
Clinical deployment of hyperpolarized 129 Xe magnetic resonance imaging requires accurate quantification and visualization of the ventilation defect percentage (VDP). Here, we improve the robustness of our previous semiautomated analysis method to reduce operator dependence, correct for B 1 inhomogeneity and vascular structures, and extend the analysis to display multiple intensity clusters.
Materials and Methods
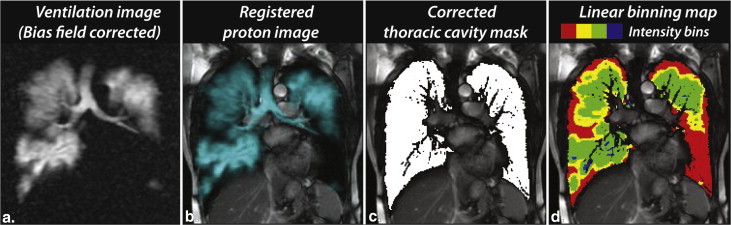
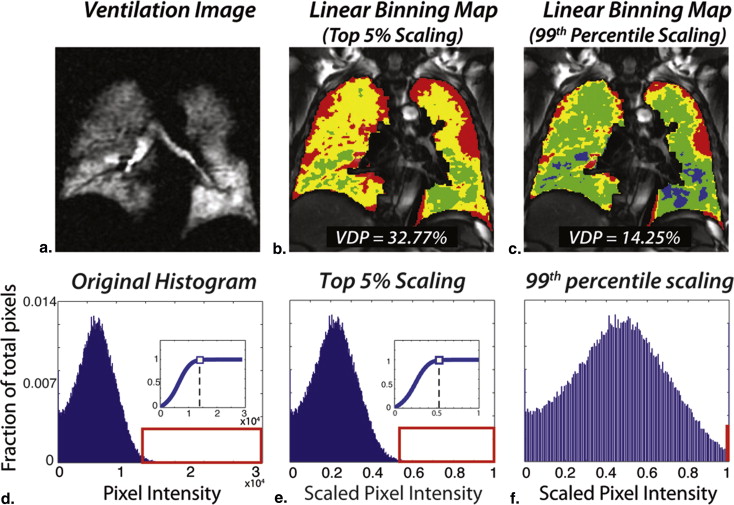
Two segmentation methods were compared—a seeded region-growing method, previously validated by expert reader scoring, and a new linear-binning method that corrects the effects of bias field and vascular structures. The new method removes nearly all operator interventions by rescaling the 129 Xe magnetic resonance images to the 99th percentile of the cumulative distribution and applying fixed thresholds to classify 129 Xe voxels into four clusters: defect, low, medium, and high intensity. The methods were applied to 24 subjects including patients with chronic obstructive pulmonary disease ( n = 8), age-matched controls ( n = 8), and healthy normal subjects ( n = 8).
Results
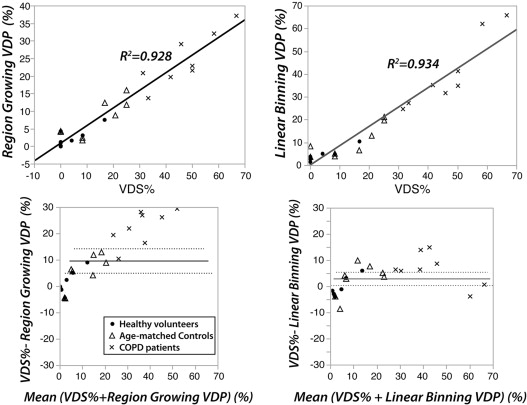
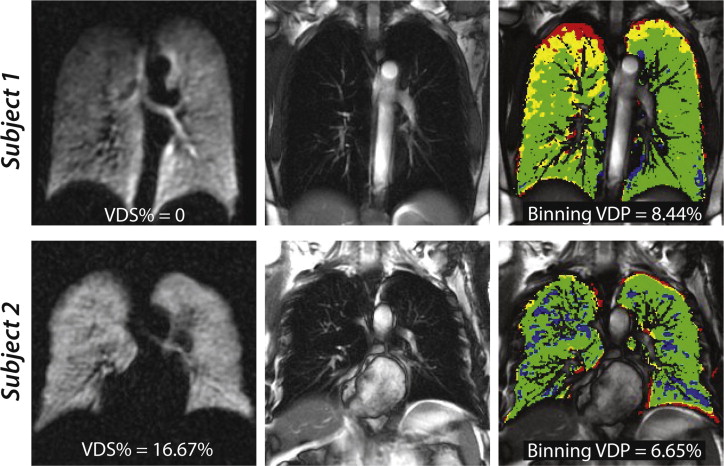
Linear-binning enabled a faster and more reproducible workflow and permitted analysis of an additional 0.25 ± 0.18 L of lung volume by accounting for vasculature. Like region-growing, linear-binning VDP correlated strongly with reader scoring ( R 2 = 0.93, P < .0001), but with less systematic bias. Moreover, linear-binning maps clearly depict regions of low and high intensity that may prove useful for phenotyping subjects with chronic obstructive pulmonary disease.
Conclusions
Corrected linear-binning provides a robust means to quantify 129 Xe ventilation images yielding VDP values that are indistinguishable from expert reader scores, while exploiting the entire dynamic range to depict multiple image clusters.
The introduction of hyperpolarized (HP) 129 Xe magnetic resonance imaging (MRI) into clinical research has accelerated in recent years, with demonstrations of high-resolution imaging of pulmonary ventilation , alveolar microstructure , and gas exchange . Like 3 He MRI, which emerged over the past decade but suffers from supply limitations , 129 Xe MRI offers a means to enable radiation-free longitudinal imaging of pulmonary function. Although recent interest in 129 Xe has been centered on exploiting its intriguing properties such as solubility and chemical-shift to probe diffusive gas exchange , important questions still remain to be addressed about how best to acquire and analyze even basic 129 Xe spin-density (ventilation) images. HP 129 Xe spin-density imaging, like 3 He MRI, readily depicts ventilation impairment in a variety of pulmonary disorders such as asthma, chronic obstructive pulmonary disease (COPD), cystic fibrosis, and radiation-induced lung injury .
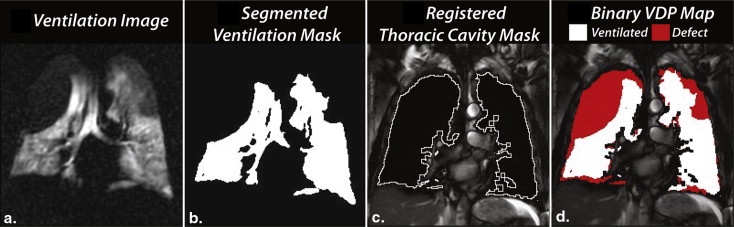
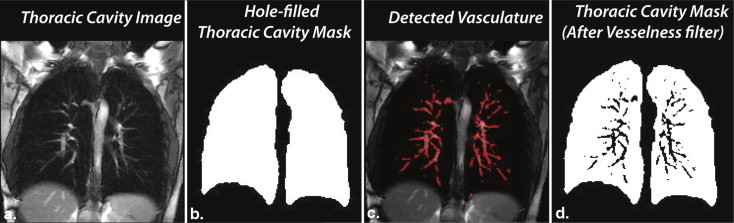
Although much progress has been made using reader-based scoring of HP gas MRI, it is also important to quantify these images in a way that is robust and automated. Such quantification not only enables high-throughput imaging, but also provides a means to extract the full richness of functional lung imaging. The simplest and longest-standing quantification metric is the ventilation defect percentage (VDP) introduced by Woodhouse et al. . Methods to calculate VDP were subsequently extended by Kirby et al. who exploited a breath-hold 1 H anatomical image to confine the analysis to the thoracic cavity. We have previously used this basic framework in conjunction with supervised region-growing methods to quantify VDP of 129 Xe MRI . This approach showed a good interoperator agreement and correlated well with expert reader scores. However, the study also highlighted the need to further remove operator dependence and to extend the range of analysis beyond simply calculating defect percentages. Moreover, the automated analysis can also be confounded by two additional factors. Firstly, the flexible vest coil may produce an inhomogeneous B 1 field, which causes a bias field variation across the lung . Secondly, the presence of pulmonary vasculature within the thoracic cavity can cause 129 Xe signal intensity voids that can be incorrectly classified as ventilation defects.
Get Radiology Tree app to read full this article<
Materials and methods
Get Radiology Tree app to read full this article<
129 Xe Polarization and Delivery
Get Radiology Tree app to read full this article<
Image Acquisition
Get Radiology Tree app to read full this article<
Semiautomated Image Analysis Methods
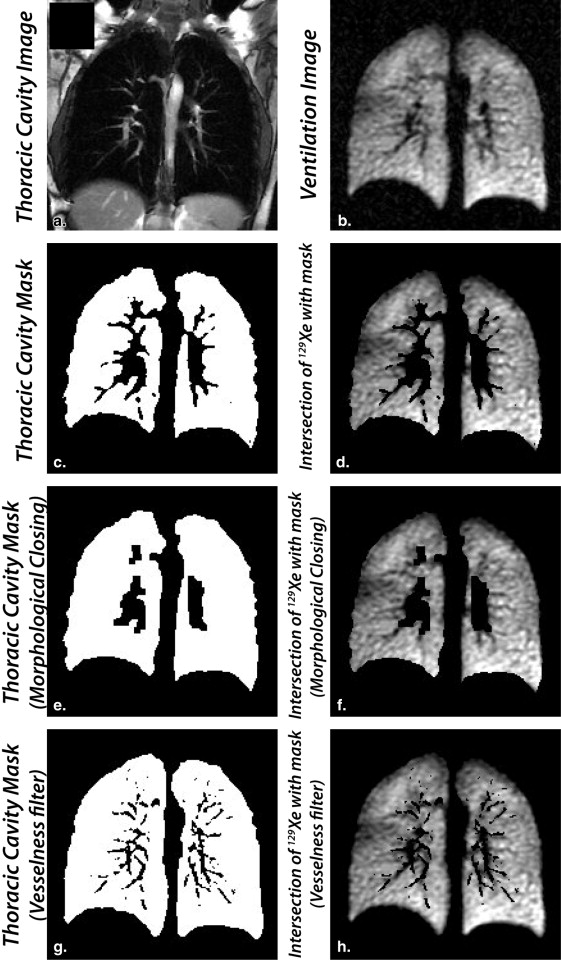
Creating the registered thoracic cavity mask
Get Radiology Tree app to read full this article<
Method 1: seeded region-growing segmentation to determine VDP
Get Radiology Tree app to read full this article<
Get Radiology Tree app to read full this article<
Method 2: scaled linear-binning maps with bias field and vesselness corrections
Get Radiology Tree app to read full this article<
Get Radiology Tree app to read full this article<
Linear-binning histogram scaling
Get Radiology Tree app to read full this article<
Vesselness correction of the thoracic cavity mask
Get Radiology Tree app to read full this article<
Get Radiology Tree app to read full this article<
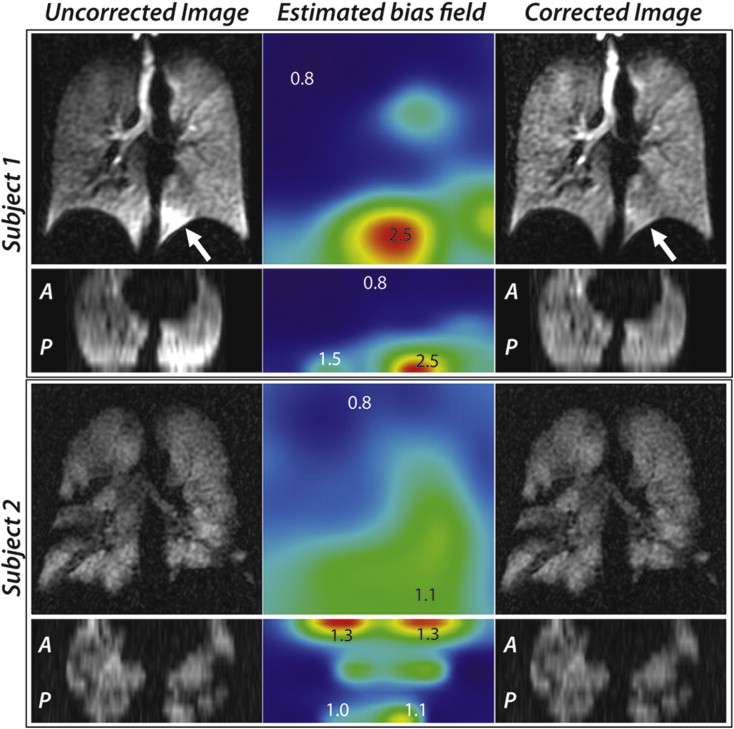
Retrospective bias field correction
Get Radiology Tree app to read full this article<
Statistical Methods
Get Radiology Tree app to read full this article<
Results
Linear-Binning Histogram Scaling
Get Radiology Tree app to read full this article<
Get Radiology Tree app to read full this article<
Vesselness Filter
Get Radiology Tree app to read full this article<
Get Radiology Tree app to read full this article<
Bias Field Correction
Get Radiology Tree app to read full this article<
Get Radiology Tree app to read full this article<
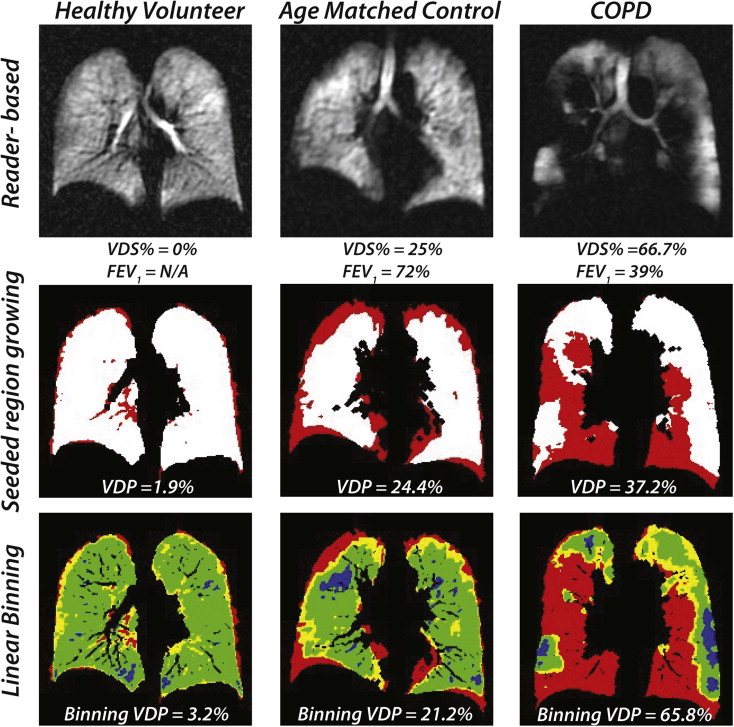
Seeded Region-Growing and Linear-Binning Clustering Measurements
Get Radiology Tree app to read full this article<
Get Radiology Tree app to read full this article<
Get Radiology Tree app to read full this article<
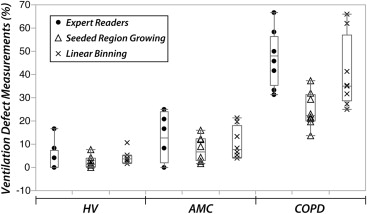
Table 1
Mean Values (±Standard Deviation) of Ventilation Defect Score Percentage (VDS%) and 129 Xe Cluster Percentage Measurements Using Region-Growing and Linear-Binning
Parameter Mean Values ± Standard Deviation_P_ Values HV ( n = 8) AMC ( n = 8) COPD ( n = 8) HV, AMC AMC, COPD HV, COPD VDS% (%) 3.65 ± 6.07 13.02 ± 10.31 47.14 ± 11.93 .068 <.0001 ∗ <.0001 ∗ Seeded region-growing method VDP (%) 2.41 ± 2.55 7.77 ± 5.27 24.68 ± 7.59 .066 <.0001 ∗ <.0001 ∗ Linear-binning method VDP (%) 4.24 ± 2.91 10.29 ± 6.96 40.45 ± 15.40 .135 <.0001 ∗ <.0001 ∗ Low-intensity (%) 16.16 ± 3.76 15.94 ± 8.32 22.95 ± 7.07 .947 .055 .048 ∗ Medium-intensity (%) 70.87 ± 4.73 65.87 ± 11.76 32.69 ± 14.21 .373 <.0001 ∗ <.0001 ∗ High-intensity (%) 8.73 ± 1.28 7.90 ± 3.36 3.92 ± 1.37 .463 .0017 ∗ .0003 ∗
AMC, age-matched control; COPD, chronic obstructive pulmonary disease; HV, healthy volunteer, VDP, ventilation defect percentage.
Get Radiology Tree app to read full this article<
Get Radiology Tree app to read full this article<
Get Radiology Tree app to read full this article<
Correlations and Bland-Altman Analysis
Get Radiology Tree app to read full this article<
Get Radiology Tree app to read full this article<
Discussion
Advantages of the Corrected Linear-Binning Method
Get Radiology Tree app to read full this article<
Comparison of Reader-Based Scoring, Seeded Region-Growing, and Linear-Binning
Get Radiology Tree app to read full this article<
Get Radiology Tree app to read full this article<
Get Radiology Tree app to read full this article<
Get Radiology Tree app to read full this article<
Get Radiology Tree app to read full this article<
Study Limitations
Get Radiology Tree app to read full this article<
Get Radiology Tree app to read full this article<
Conclusions
Get Radiology Tree app to read full this article<
Acknowledgments
Get Radiology Tree app to read full this article<
Get Radiology Tree app to read full this article<
References
1. Svenningsen S., Kirby M., Starr D., et. al.: Hyperpolarized He and Xe MRI: differences in asthma before bronchodilation. J Magn Reson Imaging 2013; 38: pp. 1521-1530.
2. Kaushik S.S., Freeman M.S., Cleveland Z.I., et. al.: Probing the regional distribution of pulmonary gas-exchange through single-breath, gas- and dissolved-phase 129Xe MR imaging. J Appl Physiol 2013; 115: pp. 850-860.
3. Qing K., Ruppert K., Jiang Y., et. al.: Regional mapping of gas uptake by blood and tissue in the human lung using hyperpolarized xenon-129 MRI. J Magn Reson Imaging 2014; 39: pp. 346-359.
4. Cleveland Z.I., Cofer G.P., Metz G., et. al.: Hyperpolarized Xe MR imaging of alveolar gas uptake in humans. PLoS One 2010; 5: pp. e12192.
5. Kramer D.: DOE begins rationing helium-3. Phys Today 2010; 63: pp. 6.
6. Virgincar R.S., Cleveland Z.I., Sivaram Kaushik S., et. al.: Quantitative analysis of hyperpolarized (129) Xe ventilation imaging in healthy volunteers and subjects with chronic obstructive pulmonary disease. NMR Biomed 2012; 26: pp. 424-435.
7. Shukla Y., Wheatley A., Kirby M., et. al.: Hyperpolarized 129Xe magnetic resonance imaging: tolerability in healthy volunteers and subjects with pulmonary disease. Acad Radiol 2012; 19: pp. 941-951.
8. Kirby M., Svenningsen S., Owrangi A., et. al.: Hyperpolarized 3He and 129Xe MR imaging in healthy volunteers and patients with chronic obstructive pulmonary disease. Radiology 2012; 265: pp. 600-610.
9. Kirby M., Heydarian M., Svenningsen S., et. al.: Hyperpolarized 3He magnetic resonance functional imaging semiautomated segmentation. Acad Radiol 2012; 19: pp. 141-152.
10. Woodhouse N., Wild J.M., Paley M.N., et. al.: Combined helium-3/proton magnetic resonance imaging measurement of ventilated lung volumes in smokers compared to never-smokers. J Magn Reson Imaging 2005; 21: pp. 365-369.
11. Tustison N.J., Avants B.B., Cook P.A., et. al.: N4ITK: improved N3 bias correction. IEEE Trans Med Imaging 2010; 29: pp. 1310-1320.
12. Frangi A.F., Niessen W.J., Hoogeveen R.M., et. al.: Model-based quantitation of 3-D magnetic resonance angiographic images. IEEE Trans Med Imaging 1999; 18: pp. 946-956.
13. Rabe K.F., Hurd S., Anzueto A., et. al.: Global strategy for the diagnosis, management, and prevention of chronic obstructive pulmonary disease—GOLD executive summary. Am J Respir Crit Care Med 2007; 176: pp. 532-555.
14. Driehuys B., Cates G.D., Miron E., et. al.: High-volume production of laser-polarized Xe-129. Appl Phys Lett 1996; 69: pp. 1668-1670.
15. Studholme C., Hill D.L.G., Hawkes D.J.: An overlap invariant entropy measure of 3D medical image alignment. Pattern Recogn 1999; 32: pp. 71-86.
16. Rueckert D., Sonoda L.I., Hayes C., et. al.: Nonrigid registration using free-form deformations: application to breast MR images. IEEE Trans Med Imaging 1999; 18: pp. 712-721.
17. Mistry N.N., Thomas A., Kaushik S.S., et. al.: Quantitative analysis of hyperpolarized 3He ventilation changes in mice challenged with methacholine. Magn Reson Med 2010; 63: pp. 658-666.
18. Tustison N.J., Avants B.B., Flors L., et. al.: Ventilation-based segmentation of the lungs using hyperpolarized (3)He MRI. J Magn Reson Imaging 2011; 34: pp. 831-841.
19. Belaroussi B., Milles J., Carme S., et. al.: Intensity non-uniformity correction in MRI: existing methods and their validation. Med Image Anal 2006; 10: pp. 234-246.
20. Arnold J.B., Liow J.S., Schaper K.A., et. al.: Qualitative and quantitative evaluation of six algorithms for correcting intensity nonuniformity effects. Neuroimage 2001; 13: pp. 931-943.
21. Wild J.M., Ajraoui S., Deppe M.H., et. al.: Synchronous acquisition of hyperpolarised 3He and 1H MR images of the lungs—maximising mutual anatomical and functional information. NMR Biomed 2011; 24: pp. 130-134.
22. Tustison N.J., Altes T.A., Song G., et. al.: Feature analysis of hyperpolarized helium-3 pulmonary MRI: a study of asthmatics versus nonasthmatics. Magn Reson Med 2010; 63: pp. 1448-1455.