
Rationale and Objectives
This study examines the joint effect of several factors on radiology resident performance in the task of interpreting after-hours neuroradiology examinations.
Materials and Methods
As part of a quality assessment process, we conducted a prospective evaluation of all ( N = 21,796) after-hours preliminary readings of neuroradiology examinations performed by radiology residents over a 62-month period at our academic medical center. Each reading was scored by the interpreting neuroradiologist as “agree,” “disagree with minimal clinical impact,” and “disagree with significant clinical impact.” Coded resident and attending identities were also recorded for each case along with modality, body area studied, and the date of examination. These raw data were used to create an analytic data set with level of resident/attending agreement as the outcome and six predictors, including two date-derived variables: months 1–62 representing when the case occurred during the study and quartiles 1–4 accounting for the timing of the case in each resident’s own experience. Cross tabulations, plots, bivariate statistics, and logistic regression were used to examine the relationships between study variables and the outcome (level of agreement).
Results
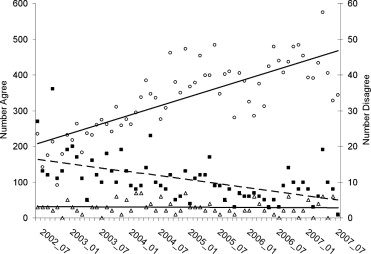
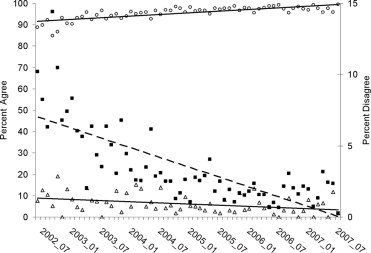
Over about 5 years of the study, the absolute number of significant disagreements remained stable at about three per month. The total caseload increased at a rate of 4.1 per month with most of the increase falling into the agree category, whereas the minimal disagreements actually decreased slightly (0.2 per month). In the logistic model for disagreement, three of the factors accounted for most of the variance: attending (61%), resident (15%), and month (15%). Study type (modality and area examined) accounted for another 10%. There was no significant contribution from the variable (quartile) constructed to test for individual resident learning during the on-call experience.
Conclusion
Although residents differ somewhat in the extent of attending agreement with their on-call work, evaluation or remediation made on the basis of simple comparison of these rates should be done with caution. Improved agreement over time seems to be a collective experience shared by residents.
Nearly a decade ago, the Accreditation Council for Graduate Medical Education (ACGME) developed the Outcome Project in response to an increasing demand for physician accountability. This project was implemented as a long-term initiative consisting of four phases, with progressive emphasis on educational outcomes in the residency education accreditation process. Phase 1 implementation occurred in July 2001 and included the introduction of the six general competencies into residency training. In Phase 2 (July 2002–June 2006), programs were required to demonstrate that they were teaching and assessing the competencies. We are currently in Phase 3 (July 2006–June 2011), and the requirements focus on measurable outcomes; that is, programs are now required to use outcome data as evidence for the continuous improvement of individual resident and residency program performance ( ). Graduate medical education programs can no longer simply state that they are training their residents to be qualified in the six general competencies; they have to provide evidence that supports this.
The challenge is to identify useful, reliable, and valid methods for assessing performance outcomes for each competency during graduate medical education training. Outcome proposals for the Patient Care competency in radiology residency include the documentation of reducing the discrepancy rate between the on-call preliminary resident radiologic examination interpretation and the final attending reading ( ). The assumption is that a reduction in this discrepancy rate reflects an increase in accuracy of the resident preliminary interpretation as the resident progresses through training. However, there are other factors to consider when making this determination, such as the variability of faculty interpretation, the percentage of abnormal examinations and change in volume of examinations over time, and the imaging modality and the anatomic site imaged.
Get Radiology Tree app to read full this article<
Get Radiology Tree app to read full this article<
Materials and methods
Get Radiology Tree app to read full this article<

Get Radiology Tree app to read full this article<
Get Radiology Tree app to read full this article<
Statistical Analysis
Get Radiology Tree app to read full this article<
Get Radiology Tree app to read full this article<
Get Radiology Tree app to read full this article<
Logit[Prob(disagree)]=β0+β1Resident+β2Attending+β3Modality+β4Area Examined+β5Quartile+β6Month+ε. Logit
[
Prob
(
disagree
)
]
=
β
0
+
β
1
Resident
+
β
2
Attending
+
β
3
Modality
+
β
4
Area Examined
+
β
5
Quartile
+
β
6
Month
+
ε
.
Get Radiology Tree app to read full this article<
Get Radiology Tree app to read full this article<
Results
Get Radiology Tree app to read full this article<
Get Radiology Tree app to read full this article<
Get Radiology Tree app to read full this article<
Table 1
Agreement by Attending
Attending Agreement Disagreement Minimal Disagreement Significant Total A 1499 (88.3%) 111 (6.5%) 87 (5.1%) 1697 B 1703 (90.6%) 150 (8.0%) 27 (1.4%) 1880 C 3891 (96.3%) 133 (3.3%) 18 (0.4%) 4042 D 2187 (96.4%) 67 (3.0%) 14 (0.6%) 2268 E 930 (97.9%) 24 (2.5%) 6 (0.6%) 960 F 5419 (97.7%) 114 (2.1%) 13 (0.2%) 5546 G 3136 (96.9%) 49 (1.5%) 18 (0.6%) 3203 H 725 (98.6%) 9 (1.2%) 1 (0.1%) 735 I 1454 (99.2%) 8 (0.5%) 3 (0.2%) 1465 Total 20,944 (96.1%) 665 (3.1%) 187 (0.9%) 21,796
Table 2
Agreement by Study Type
Study Type Agreement Disagreement Minimal Disagreement Significant Total CT combined 4408 (95.7%) 148 (3.2%) 52 (1.1%) 4608 CT head 14,342 (96.6%) 412 (2.8%) 99 (0.7%) 14,853 CT maxillofacial 1939 (90.2%) 19 (8.9%) 2 (0.9%) 214 CT neck 181 (95.3%) 10 (5.1%) 5 (2.6%) 196 CT orbits 137 (95.1%) 5 (3.5%) 2 (1.4%) 144 CT spine 743 (96.4%) 22 (2.9%) 6 (0.8%) 771 MRI combined 205 (95.3%) 6 (2.8%) 4 (1.9%) 215 MRI head 300 (92.0%) 21 (6.4%) 5 (1.5%) 326 MRI maxillofacial 1 (50.0%) 1 (50.0%) 0 (0.0%) 2 MRI neck 5 (83.3%) 0 (0.0%) 1 (16.7%) 6 MRI orbits 13 (92.9%) 1 (7.1%) 0 (0.0%) 14 MRI spine 416 (93.1%) 20 (4.5%) 11 (2.5%) 447 Total 20,944 (96.1%) 665 (3.1%) 187 (0.9%) 21,796
CT, computed tomography; MRI, magnetic resonance imaging.
Table 3
Agreement by Quartile
Quartile Agreement Disagreement Minimal Disagreement Significant Total 1 5169 (95.37%) 205 (3.78%) 46 (0.85%) 5420 2 5222 (95.94%) 179 (3.29%) 42 (0.77%) 5443 3 5244 (96.18%) 163 (2.99%) 45 (0.83%) 5452 4 5309 (96.86%) 118 (2.15%) 54 (0.99%) 5481 20,944 (96.1%) 665 (3.1%) 187 (0.9%) 21,796
Get Radiology Tree app to read full this article<
Get Radiology Tree app to read full this article<
Table 4
Logistic Regression Results
Variable df Wald Χ 2 P -value Explained Variance Resident 45 102.13 <.0001 15.13% Attending 8 354.21 <.0001 60.68% Modality 1 21.95 <.0001 4.24% Area examined 5 37.44 <.0001 5.09% Quartile 3 0.62 .8920 0.00% Month 1 ⁎ 11.43 .0007 14.85%
df, degree of freedom.
Get Radiology Tree app to read full this article<
Get Radiology Tree app to read full this article<
Get Radiology Tree app to read full this article<
Table 5
Logistic Regression Results (Odds Ratios)
Variable (reference value) Odds Ratio Lower 95% CI Upper 95% CI Modality Reference = MRI CT 0.954 0.928 0.980 Area examined (reference value = maxillofacial) Combined 0.854 0.519 1.405 Head 0.528 0.328 0.851 Neck 0.959 0.472 1.951 Orbits 0.692 0.287 1.668 Spine 0.687 0.392 1.204 Attending (reference value = A) B 0.153 0.402 0.653 C 0.242 0.192 0.306 D 0.250 0.189 0.330 E 0.163 0.109 0.245 F 0.164 0.129 0.208 G 0.194 0.144 0.262 H 0.124 0.064 0.239 Quartile (reference value = 1) 2 1.008 0.828 1.227 3 1.088 0.853 1.389 4 1.048 0.741 1.482 Month (reference value = 0) 1–61 ⁎ 0.954 0.928 0.980
CI, confidence interval.
Get Radiology Tree app to read full this article<
Get Radiology Tree app to read full this article<
Get Radiology Tree app to read full this article<
Get Radiology Tree app to read full this article<
Get Radiology Tree app to read full this article<
Discussion
Get Radiology Tree app to read full this article<
Get Radiology Tree app to read full this article<
Get Radiology Tree app to read full this article<
Get Radiology Tree app to read full this article<
Get Radiology Tree app to read full this article<
Get Radiology Tree app to read full this article<
Get Radiology Tree app to read full this article<
References
1. Accreditation Council for Graduate Medical Education: Outcome Project, Home page.2007. http://www.acgme.org/outcome/project/proHome.asp Accessed April 2, 2008
2. Association of Program Directors in Radiology: Measurement of Competencies Resident Outcomes in Diagnostic Radiology.2007. http://www.apdr.org/directors/pdffiles/10-07DiagnosticRadiologyOutcomes.pdf Accessed April 2, 2008
3. Carney E., Kempf J., DeCarvalho V., et. al.: Preliminary interpretations of after-hours CT and sonography by radiology residents versus final interpretations by body imaging radiologists at a level 1 trauma center. AJR Am J Roentgenol 2003; 181: pp. 367-373.
4. Lal N.R., Murray U.M., Eldevik O.P., et. al.: Clinical consequences of misinterpretations of neuroradiologic CT scans by on-call radiology residents. AJNR Am J Neuroradiol 2000; 21: pp. 124-129.
5. Ojutiku O., Haramati L.B., Rakoff S., et. al.: Radiology residents’ on-call interpretation of chest radiographs for pneumonia. Acad Radiol 2005; 12: pp. 658-664.
6. Wysoki M.G., Nassar C.J., Koenigsberg R.A., et. al.: Head trauma: CT scan interpretation by radiology residents versus staff radiologists. Radiology 1998; 208: pp. 125-128.
7. Wysoki M.: Trauma head CT interpretation by radiology residents versus staff radiologists. Radiology 1999; 210: pp. 283.
8. Feldmann E.J., Jain V.R., Rakoff S., et. al.: Radiology residents’ on-call interpretation of chest radiographs for congestive heart failure. Acad Radiol 2007; 14: pp. 1264-1270.
9. Mann F.A., Danz P.L.: The night stalker effect: Quality improvements with a dedicated night-call rotation. Invest Radiol 1993; 28: pp. 92-96.
10. Ruchman R.B., Jaeger J., Wiggins E.F., et. al.: Preliminary radiology resident interpretations versus final attending radiologist interpretations and the impact on patient care in a community hospital. AJR Am J Roentgenol 2007; 189: pp. 523-526.
11. Halsted M.J., Kumar H., Paquin J.J., et. al.: Diagnostic errors by radiology residents in interpreting pediatric radiographs in an emergency setting. Pediatr Radiol 2004; 34: pp. 331-336.
12. Erly W.K., Berger W.G., Krupinski E., et. al.: Radiology resident evaluation of head CT scan orders in the emergency department. AJNR Am J Neuroradiol 2002; 23: pp. 103-107.
13. Wechsler R.J., Spettell C.M., Kurtz A.B., et. al.: Effects of training and experience in interpretation of emergency body CT scans. Radiology 1996; 199: pp. 717-720.
14. Hillier J.C., Tattersall D.J., Gleeson F.V.: Trainee reporting of computed tomography examinations: Do they make mistakes and does it matter?. Clin Radiol 2004; 59: pp. 159-162.
15. Branstetter B.F., Morgan M.B., Nesbit C.E., et. al.: Preliminary reports in the emergency department: Is a subspecialist radiologist more accurate than a radiology resident?. Acad Radiol 2007; 14: pp. 201-206.