
Rationale and Objectives
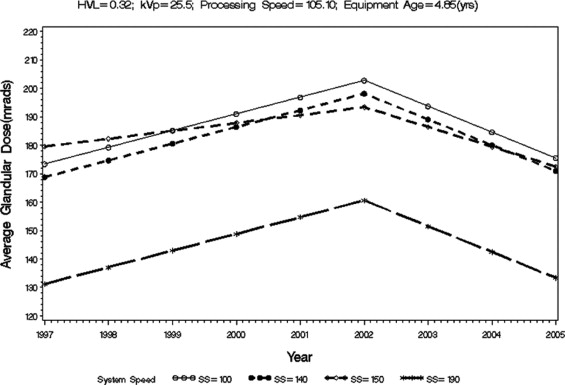
We sought to determine which factors affected the decrease in average glandular dose recorded at the annual U.S. Food and Drug Administration Mammography Quality Standards Act inspections of mammography equipment in North Carolina from 2002 through 2005.
Materials and Methods
Average glandular dose, half-value layer, kVp, equipment age, processing speed, and system speed for every mammography unit in the state were collected by Food and Drug Administration−trained state inspectors. A mixed-effect model was used to evaluate the changes of glandular dose over time and to identify the factors associated with these changes.
Results
There was a statistically significant decrease in average glandular dose in North Carolina since 2002. Factors that were statistically significantly associated with this effect were changes in kVp, equipment age, processing speed, and system speed.
Conclusion
Average glandular dose for mammography has decreased in North Carolina after 2002. This change is probably at least partially due to the cumulative effect of direct intervention by mammography consultants and statewide educational seminars on mammography quality control.
Ionizing radiation has been shown to induce breast cancers in populations exposed to very large radiation doses ( ). These data have been extrapolated to estimate the risk of breast cancer in patients exposed to low doses ( ). Federal regulation of mammography has led to reduced radiation exposure in patients undergoing screening mammography ( ). Radiation exposure of the glandular elements of the breasts is reported as average glandular dose (AGD) ( ) and has been gradually increasing in the United States since the 1980s ( ). It was this observed trend in Food and Drug Administration (FDA) inspection data that prompted Pisano et al. ( ) to evaluate and analyze the factors affecting increasing radiation dose for mammography in the state of North Carolina from 1997 to 2001.
In the study by Pisano et al., there was a statistically significant increase in the AGD in North Carolina mammography facilities in 1999, 2000, and 2001 compared with the baseline year of 1997. Factors that were statistically significantly related to this effect were changes in kVp, processing speed (PS), and system speed (SS) ( ). In order to reverse this trend, mammography consultant intervention and statewide educational seminars on mammography quality control were instituted. A trend toward decreasing dose for North Carolina mammography facilities from 2002 through 2005 was detected after the interventions. This article reports this trend and analyzes the decrease in AGD in North Carolina.
Materials and methods
Get Radiology Tree app to read full this article<
Get Radiology Tree app to read full this article<
Table 1
Interventions by Mammography Consultations for Mammography Facilities in North Carolina from December 1, 2002 through December 31, 2005
Year Telephone On Site Total 2002 370 12 382 2003 487 15 502 2004 393 14 407 2005 440 17 457 Total 1690 58 1748
Get Radiology Tree app to read full this article<
Get Radiology Tree app to read full this article<
Get Radiology Tree app to read full this article<
Table 2
Facilities and Mammography Units Inspected Per Year in North Carolina
Year 1997 1998 1999 2000 2001 2002 2003 2004 2005 # of facilities 226 173 249 247 242 241 228 230 229 # of units 293 222 345 354 363 371 359 367 372 # of complete cases 126 (43) 114 (51.4) 329 (95.4) 300 (84.8) 363 (100) 371 (100) 359 (100) 366 (99.7) 370 (99.5) Average Glandular Dose 292 (99.7) 215 (96.9) 329 (95.4) 354 (100) 363 (100) 371 (100) 359 (100) 367 (100) 370 (99.5) HVL 292 (99.7) 222 (100) 340 (98.6) 354 (100) 363 (100) 371 (100) 359 (100) 367 (100) 372 (100) kVp 292 (99.7) 222 (100) 340 (98.6) 354 (100) 363 (100) 371 (100) 359 (100) 366 (99.7) 372 (100) Equipment Age 291 (99.3) 222 (100) 340 (98.6) 354 (100) 363 (100) 371 (100) 359 (100) 367 (100) 372 (100) Processing Speed 127 (43.3) 114 (51.4) 337 (97.7) 300 (84.8) 363 (100) 371 (100) 359 (100) 367 (100) 370 (99.5) System Speed 283 (96.6) 215 (96.9) 337 (97.7) 300 (84.8) 363 (100) 371 (100) 359 (100) 367 (100) 372 (100)
*Number in () is percentage.
Get Radiology Tree app to read full this article<
Get Radiology Tree app to read full this article<
Table 3
Summary Statistics for the Variables used in the Analysis
1997 1998 1999 2000 2001 2002 2003 2004 2005 Average Glandular Dose N 292 215 329 354 363 371 359 367 370 Mean (SD) 176.05 (36.86) 180.58 (34.20) 185.04 (31.00) 191.01 (30.91) 190.49 (31.88) 195.19 (33.27) 188.81 (29.59) 181.27 (26.78) 174.32 (27.57) Minimum 86.82 85 95 94 93 97 116 109 109 Maximum 288.39 292 292 279 319 296 287 272 272 HVL N 292 222 340 354 363 371 359 367 372 Mean (SD) 0.32 (0.02) 0.32 (0.02) 0.32 (0.02) 0.32 (0.02) 0.32 (0.02) 0.32 (0.02) 0.32 (0.02) 0.32 (0.02) 0.32 (0.02) Minimum 0.25 0.25 0.27 0.26 0.26 0.25 0.28 0.25 0.25 Maximum 0.39 0.39 0.45 0.38 0.40 0.39 0.43 0.40 0.38 kVp N 292 222 340 354 363 371 359 366 372 Mean (SD) 25.64 (0.76) 25.61 (0.73) 25.55 (0.66) 25.50 (0.65) 25.50 (0.71) 25.50 (0.62) 25.50 (0.67) 25.43 (0.62) 25.41 (0.62) Minimum 24 24 24 24 23 25 24 24 24 Maximum 28 28 28 28 30 28 29 29 28 Equipment Age (years) N 291 222 340 354 363 371 359 367 372 Mean (SD) 4.93 (3.03) 5.10 (3.27) 4.52 (3.05) 4.71 (3.20) 4.80 (3.30) 4.54 (2.99) 4.52 (2.80) 5.07 (2.84) 5.58 (2.94) Minimum 0.14 0.19 0.12 0.22 0.13 0.16 0.38 0.01 0.21 Maximum 12.34 16.22 14.32 15.29 16.27 13.86 13.99 15.56 14.66 Processing Speed N 127 114 337 300 363 371 359 367 370 Mean (SD) 107.49 (16.37) 101.96 (11.35) 100.61 (11.22) 100.34 (9.87) 103.73 (7.92) 105.64 (7.49) 108.98 (9.20) 108.51 (9.32) 106.81 (7.68) Minimum 72 78 77 57 85 85 55 85 84 Maximum 172 136 147 136 134 128 148 152 133 System Speed N 283 215 337 300 363 371 359 367 372 Mean (SD) 105.87 (20.94) 110.60 (21.30) 129.76 (24.58) 133.83 (23.43) 137.88 (21.46) 143.35 (16.47) 147.21 (10.99) 145.34 (13.74) 119.27 (24.37) Minimum 100 100 100 100 100 100 100 100 100 Maximum 190 190 150 150 150 150 150 150 150
Key: N = Data Available; SD = Standard Deviation.
Get Radiology Tree app to read full this article<
Get Radiology Tree app to read full this article<
Get Radiology Tree app to read full this article<
Results
Get Radiology Tree app to read full this article<
Get Radiology Tree app to read full this article<
Get Radiology Tree app to read full this article<
Table 4
Parameter Estimates for the Effects of Each Covariate
Factors Parameter Interpretation Estimate Standard Error_P_ -value Year AGD change per year before 2002, controlling for the covariates at their means 3.79 0.6053 <0.0001 AGD change per year after 2002, controlling for the covariates at their means −7.64 0.6335 <0.0001 HVL AGD change per 0.01 increase in HVL, controlling for all other covariates 0.64 0.3764 0.0885 Equipment age AGD change per year increase in EA, controlling for all other covariates −0.56 0.2289 0.0151 kVp AGD change per unit increase in kVp in 1997 −5.73 2.4856 0.0213 Change per year in the AGD change per unit increase in kVp before 2002 −0.04 0.6493 0.9499 Change per year in the AGD change per unit increase in kVp after 2002 −2.41 0.7894 0.0023 Processing Speed AGD change per unit increase in processing speed in 1997 −0.74 0.1269 <.0001 Change per year in the AGD change per unit increase in processing speed before 2002 0.07 0.0383 0.0664 Change per year in the AGD change per unit increase in processing speed after 2002 0.04 0.0583 0.4417 System Speed AGD Change from SS=100 to SS=140, controlling for the other covariates −4.56 3.6931 0.2168 AGD Change from SS=100 to SS=190, controlling for the other covariates −42.17 18.6542 0.0239 AGD Change from SS=100 to SS=150 at year 1997, controlling for other covariates 6.18 3.6053 0.0868 Chang per year in the AGD change from SS=100 to SS=150, controlling for other covariates before 2002 −3.11 1.0170 0.0022 Chang per year in the AGD change from SS=100 to SS=150, controlling for other covariates after 2002 2.14 1.1193 0.0566
AGD = Average Glandular Dose; EA=Equipment Age; SS=System Speed.
The units for column 3 (Estimate) in this table are mrads per unit of factor in the corresponding row.
Get Radiology Tree app to read full this article<
Get Radiology Tree app to read full this article<
Get Radiology Tree app to read full this article<
Get Radiology Tree app to read full this article<
Discussion
Get Radiology Tree app to read full this article<
Get Radiology Tree app to read full this article<
Get Radiology Tree app to read full this article<
Get Radiology Tree app to read full this article<
Get Radiology Tree app to read full this article<
Get Radiology Tree app to read full this article<
Get Radiology Tree app to read full this article<
References
1. McGregor D.H., Land C.E., Choi K., et. al.: Breast cancer incidence among atomic bomb survivors, Hiroshima and Nagasaki, 1950-1974. J Natl Cancer Inst 1979; 62: pp. 1347-1359.
2. MacKenzie I.: Breast cancer following multiple fluoroscopies. Br J Cancer 1965; 19: pp. 1-8.
3. Shore R.E., Hempelmann L.H., Kowaluk E., et. al.: Breast neoplasms in women treated with x-rays for acute postpartum mastitis. J Natl Cancer Inst 1979; 59: pp. 799-811.
4. Hendee W.R.: History and status of x-ray mammography. Health Phys 1995; 69: pp. 636-648.
5. Basset L.W.: The regulation of mammography. Semin Ultrasound CT MR 1996; 17: pp. 415-423.
6. Feig S.A.: Assessment of the hypothetical risk from mammography and evaluation of the potential benefit. Radiat Clin North Am 1983; 21: pp. 173-191.
7. Suleiman O.H., Spelic D.C., McCrohan J.L., Houn F.: Mammography in the 1990s: The United States and Canada. Radiology 1999; 210: pp. 345-351.
8. Pisano E.D., Chiu Y.F., Ni L., et. al.: Factors affecting increasing radiation dose for mammography in North Carolina from 1997 through 2001. Acad Radiol 2004; 11: pp. 536-543.
9. MQSA Inspection Procedures (version 3.0).1999.Food and Drug AdministrationRockville, MD:pp. 19-30.
10. Gammex RMI. American College of Radiology Quality Control Program breast phantom. Available at: www.gammex.com .
11. Diggle P.J., Liang K.Y., Zeger S.L.: 1993.Oxford University PressOxford, UK