
Purpose
To describe recruitment, enrollment, and participation in a study of US radiologists invited to participate in a randomized controlled trial of two continuing medical education (CME) interventions designed to improve interpretation of screening mammography.
Methods
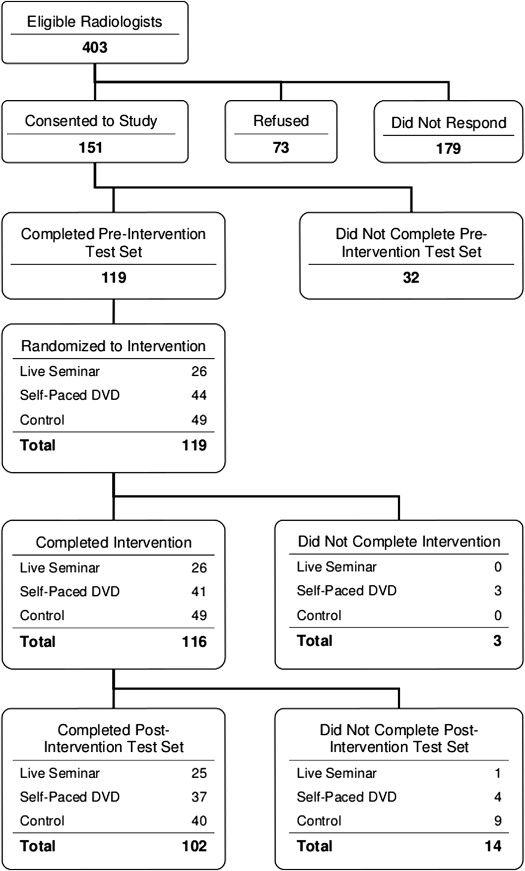
We collected recruitment, consent, and intervention-completion information as part of a large study involving radiologists in California, Oregon, Washington, New Mexico, New Hampshire, North Carolina, and Vermont. Consenting radiologists were randomized to receive either a 1-day live, expert-led educational session; to receive a self-paced DVD with similar content; or to a control group (delayed intervention). The impact of the interventions was assessed using a preintervention–postintervention test set design. All activities were institutional review board approved and HIPAA compliant.
Results
Of 403 eligible radiologists, 151 of 403 (37.5%) consented to participate in the trial and 119 of 151 (78.8%) completed the preintervention test set, leaving 119 available for randomization to one of the two intervention groups or to controls. Female radiologists were more likely than male radiologists to consent to and complete the study ( P = .03). Consenting radiologists who completed all study activities were more likely to have been interpreting mammography for 10 years or less compared to radiologists who consented and did not complete all study activities or did not consent at all. The live intervention group was more likely to report their intent to change their clinical practice as a result of the intervention compared to those who received the DVD (50% versus 17.6%, P = .02). The majority of participants in both interventions groups felt the interventions were a useful way to receive CME mammography credits.
Conclusions
Community radiologists found interactive interventions designed to improve interpretative mammography performance acceptable and useful for clinical practice. This suggests CME credits for radiologists should, in part, be for examining practice skills.
Continuing medical education (CME) has traditionally been a requirement for maintaining qualifications for practicing physicians . Physicians who interpret mammography are required by the Mammography Quality Standards Act (MQSA) to obtain at least 15 hours of Category 1 CME units in mammography every 36 months to maintain their qualifications . Justification for continuing CME activities under MQSA is based on a belief that gains in knowledge will lead to improved patient care and outcomes . However, despite the significant level of participation and resources applied to CME, there are two persistent concerns. First, conventional, lecture-based CME may have little, if any, effect on physician performance . Second, 20 years after Congress passed the MQSA, there remains a sizable gap between actual and ideal interpretative performance .
In 1992, the definition of traditional CME had expanded beyond classic passive lectures or grand rounds, as physicians and CME providers were undertaking more complex learning activities such as computer-based simulations using actual patient problems, reading materials, and visits to practice sites by health care professionals trained to improve performance using academic detailing . Several such approaches have been described as positive interventions because they prepared physicians for further learning and improvements in clinical practice . In addition, subsequent studies of more discrete interventions consistently identified three important features of effective CME: (i) assessment of learning needs is a necessary precursor to effective CME, (ii) the importance of interaction among physician-learners with opportunities to practice the skills learned, and (iii) the importance of multifaceted educational activities .
Get Radiology Tree app to read full this article<
Get Radiology Tree app to read full this article<
Methods
Get Radiology Tree app to read full this article<
Get Radiology Tree app to read full this article<
Study Population
Get Radiology Tree app to read full this article<
Get Radiology Tree app to read full this article<
Data Collection
Get Radiology Tree app to read full this article<
Get Radiology Tree app to read full this article<
Get Radiology Tree app to read full this article<
Data Analysis
Get Radiology Tree app to read full this article<
Results
Get Radiology Tree app to read full this article<
Get Radiology Tree app to read full this article<
Table 1
Characteristics of Radiologists among 207 Subjects Who Were Eligible to Participate in AIM and Who Completed the FAVOR Survey
Characteristics Consenting Radiologists Who Completed All Study Activities Consenting Radiologists Who Did Not Complete All Study Activities Nonconsenting Radiologists_P_ Value ( n = 81/102; 79.4%) ( n = 31/49; 81.6%) ( n = 95/252; 37.7%) Gender, No. .03 Male 43 (53.1%) 20 (64.5%) 69 (72.6%) Female 38 (46.9%) 11 (35.5%) 26 (27.4%) Academic affiliation, No. .49 Primary 12 (14.8%) 3 (10%) 7 (7.5%) Adjunct 9 (11.1%) 4 (13.3%) 8 (8.6%) None 60 (74.1%) 23 (76.7%) 78 (83.9%) Missing 1 2 Fellowship training, No. 12 (14.8%) 5 (16.1%) 7 (7.4%) .19 Years interpreting mammograms, No. .02 <10 29 (35.8%) 7 (22.6%) 23 (24.2%) 10–20 35 (43.2%) 10 (32.3%) 31 (32.6%) >20 17 (21%) 14 (45.2%) 41 (43.2%) Time spent in breast imaging, No. .10 <20% 20 (24.7%) 8 (25.8%) 30 (31.6%) 20–39% 19 (23.5%) 6 (19.4%) 30 (31.6%) 40–79% 21 (25.9%) 4 (12.9%) 10 (10.5%) ≥80% 21 (25.9%) 13 (41.9%) 25 (26.3%) Prefer instructor-led CME activities, No. .28 Disagree 3 (3.8%) 3 (9.7%) 3 (3.2%) Neutral 13 (16.3%) 5 (16.1%) 9 (9.5%) Agree 64 (80%) 23 (74.2%) 83 (87.4%) Missing 1 Prefer self-directed CME activities, No. .45 Disagree 23 (28.8%) 6 (20.7%) 30 (31.9%) Neutral 35 (43.8%) 14 (48.3%) 31 (33%) Agree 22 (27.5%) 9 (31%) 33 (35.1%) Missing 1 2 1 Prefer interactive CME activities, No. .11 Disagree 3 (3.8%) 3 (10%) 8 (8.6%) Neutral 22 (27.5%) 12 (40%) 38 (40.9%) Agree 55 (68.8%) 15 (50%) 47 (50.5%) Missing 1 1 2 CME improves my interpretive performance, No. .06 Disagree 0 (0%) 3 (9.7%) 1 (1.1%) Neutral 14 (17.3%) 3 (9.7%) 16 (16.8%) Agree 67 (82.7%) 25 (80.6%) 78 (82.1%)
All P values are from Fisher’s exact test, performed on nonmissing observations.
Get Radiology Tree app to read full this article<
Get Radiology Tree app to read full this article<
Table 2
BCSC Performance Data in the 5 Years Preceding Invitation to Participate among 290 Participants for Whom Performance Data Are Available
Data Consenting Radiologists Who Completed All Study Activities Consenting Radiologists Who Did Not Complete All Study Activities Nonconsenting Radiologists_P_ Value ( n = 82/102; 80.4%) ( n = 42/49; 85.7%) ( n = 166/252; 65.9%) Median number of years over the past 5 during which screening mammogram data were available, median [IQR] 4.34 [2.50, 4.98] 4.91 [2.70, 4.99] 4.96 [4.24, 4.99] 0.004 Screening mammograms in the 5 years preceding invitation, No. 0.67 ≤1000 12 (14.6%) 5 (11.9%) 24 (14.5%) 1001–2000 20 (24.4%) 14 (33.3%) 41 (24.7%) 2001–3000 14 (17.1%) 9 (21.4%) 42 (25.3%) >3000 36 (43.9%) 14 (33.3%) 59 (35.5%) Screening mammograms associated with cancer in the 5 years preceding invitation, No. 0.88 0 4 (4.9%) 1 (2.4%) 5 (3%) 1–4 12 (14.6%) 6 (14.3%) 24 (14.5%) 5–9 9 (11%) 5 (11.9%) 28 (16.9%) 10–29 30 (36.6%) 19 (45.2%) 56 (33.7%) ≥30 27 (32.9%) 11 (26.2%) 53 (31.9%) Screening performance measures in the 5 years preceding invitation, median [IQR] Sensitivity (%) 86.8 [80, 93.6] 90.0 [82.1, 92.9] 86.8 [77.8, 94.1] 0.49 Specificity (%) 90.7 [87, 94] 91.0 [88.1, 93.3] 91.3 [88.1, 93.8] 0.73 Recall rate (%) 9.7 [6.2, 13.4] 9.5 [7.1, 12.4] 9.0 [6.5, 12.4] 0.68 PPV1(% of cancers detected on recalled screening exams) 4.1 [2.8, 5.9] 4.7 [3.07, 6.0] 4.3 [3.1, 5.9] 0.57 CDR (cancers detected per 1000 screening exams) 4.0 [2.1, 5.6] 4.4 [3.3, 5.4] 3.8 [2.7, 5.3] 0.69
IQR, interquartile range.
P values comparing the categorical items are from Fisher’s exact test. Fisher P value for the number of screening mammograms associated with cancers was simulated using 10,000 table replicates .
P values for continuous items are from the Kruskall-Wallis test, an extension of the Wilcoxon rank sum test, which accommodates comparison of more than two groups.
Get Radiology Tree app to read full this article<
Get Radiology Tree app to read full this article<
Table 3
Satisfaction with the Preintervention Test Set among 85 Participants Who Completed the Preintervention Test Set and the Corresponding Satisfaction Survey
Data, No. Av Test Set 1: 15 Easier Cancers Test Set 2: 30 Easier Cancers Test Set 3: 15 Harder Cancers Test Set 4: 30 Harder Cancers_P_ Value ( n = 20/30; 66.7%) ( n = 25/34; 73.5%) ( n = 18/28; 64.3%) ( n = 22/27; 81.5%) Were the types of abnormal findings on this test set representative of those in your practice? .54 Not at all 0 (0%) 0 (0%) 0 (0%) 1 (4.5%) Somewhat 5 (25%) 10 (40%) 8 (44.4%) 6 (27.3%) Definitely 15 (75%) 15 (60%) 10 (55.6%) 15 (68.2%) Do you think the test set was useful for evaluating your skill when interpreting mammography? .43 Not at all 3 (15%) 2 (8%) 0 (0%) 1 (4.5%) Somewhat 9 (45%) 10 (40%) 5 (27.8%) 7 (31.8%) Definitely 8 (40%) 13 (52%) 13 (72.2%) 14 (63.6%) Do you think you will change anything in your clinical practice because of this CME exercise? .57 Not at all 6 (30%) 4 (16%) 2 (11.1%) 6 (27.3%) Somewhat 12 (60%) 15 (60%) 12 (66.7%) 10 (45.5%) Definitely 2 (10%) 6 (24%) 4 (22.2%) 6 (27.3%) Did you find the feedback on how well you did on the test set compared to your peers helpful to improving your practice? ∗ .95 Not at all 1 (6.3%) 1 (4.8%) 0 (0%) 2 (12.5%) Somewhat 6 (37.5%) 9 (42.9%) 7 (46.7%) 6 (37.5%) Definitely 9 (56.3%) 11 (52.4%) 8 (53.3%) 8 (50%) Missing 1 Not assessed 4 4 3 5 Is this a useful way for you to receive CME mammography credits? .56 Not at all 0 (0%) 0 (0%) 0 (0%) 2 (9.1%) Somewhat 4 (20%) 8 (32%) 4 (22.2%) 4 (18.2%) Definitely 16 (80%) 17 (68%) 14 (77.8%) 16 (72.7%)
All P values are from Fisher’s exact test, performed on nonmissing observations.
Get Radiology Tree app to read full this article<
Get Radiology Tree app to read full this article<
Get Radiology Tree app to read full this article<
Table 4
Satisfaction with Assigned Intervention among 60 Participants in the Live and DVD Intervention Groups Who Completed Their Assigned Intervention and Completed the Corresponding Satisfaction Survey
Data, No. Live Intervention DVD Intervention_P_ Value ( n = 26/26; 100%) ( n = 34/41; 82.9%) Were the methods used for instruction appropriate for your learning style? .002 Not at all 0 (0%) 2 (5.9%) Somewhat 6 (23.1%) 21 (61.8%) Definitely 20 (76.9%) 11 (32.4%) Do you think the seminar/DVD was useful for evaluating your skill when interpreting mammography? .08 Not at all 0 (0%) 5 (14.7%) Somewhat 12 (46.2%) 17 (50%) Definitely 14 (53.8%) 12 (35.3%) Do you think you will change anything in your clinical practice because of this CME exercise? .02 Not at all 2 (7.7%) 8 (23.5%) Somewhat 11 (42.3%) 20 (58.8%) Definitely 13 (50%) 6 (17.6%) Did you find the feedback on how well you did answering the questions compared to your peers helpful to improving your practice? .28 Not at all 0 (0%) 2 (5.9%) Somewhat 8 (30.8%) 15 (44.1%) Definitely 18 (69.2%) 17 (50%) Is this a useful way for you to receive CME mammography credits? .44 Not at all 4 (15.4%) 5 (14.7%) Somewhat 5 (19.2%) 12 (35.3%) Definitely 17 (65.4%) 17 (50%)
CME, continuing medical education.
All P values are from Fisher’s exact test, performed on nonmissing observations.
Get Radiology Tree app to read full this article<
Get Radiology Tree app to read full this article<
Table 5
Satisfaction with Follow-up Test Set among 88 Participants Who Completed Both the Follow-up Test Set and the Corresponding Satisfaction Survey
Data, No. Live Intervention DVD Intervention Control Group_P_ Value ( n = 23/25; 92.0%) ( n = 34/37; 91.9%) ( n = 31/40; 77.5%) Were the types of abnormal findings on this test set representative of those in your practice? .31 Not at all 0 (0%) 0 (0%) 0 (0%) Somewhat 13 (56.5%) 16 (47.1%) 11 (35.5%) Definitely 10 (43.5%) 18 (52.9%) 20 (64.5%) Do you think the seminar/DVD was useful for evaluating your skill when interpreting mammography? .15 Not at all 0 (0%) 1 (2.9%) 2 (6.5%) Somewhat 14 (60.9%) 19 (55.9%) 10 (32.3%) Definitely 9 (39.1%) 14 (41.2%) 19 (61.3%) Do you think you will change anything in your clinical practice because of this CME exercise? .63 Not at all 4 (17.4%) 6 (17.6%) 7 (22.6%) Somewhat 14 (60.9%) 20 (58.8%) 13 (41.9%) Definitely 5 (21.7%) 8 (23.5%) 11 (35.5%) Did you find the feedback on how well you did answering the questions compared to your peers helpful to improving your practice? .005 Not at all 1 (4.3%) 3 (8.8%) 0 (0%) Somewhat 14 (60.9%) 19 (55.9%) 8 (25.8%) Definitely 8 (34.8%) 12 (35.3%) 23 (74.2%) Is this a useful way for you to receive CME mammography credits? .16 Not at all 0 (0%) 3 (8.8%) 2 (6.5%) Somewhat 10 (43.5%) 9 (26.5%) 5 (16.1%) Definitely 13 (56.5%) 22 (64.7%) 24 (77.4%)
CME, continuing medical education.
All P values are from Fisher’s exact test, performed on nonmissing observations.
Get Radiology Tree app to read full this article<
Discussion
Get Radiology Tree app to read full this article<
Get Radiology Tree app to read full this article<
Get Radiology Tree app to read full this article<
Get Radiology Tree app to read full this article<
Get Radiology Tree app to read full this article<
Get Radiology Tree app to read full this article<
Conclusions
Get Radiology Tree app to read full this article<
Acknowledgments
Get Radiology Tree app to read full this article<
References
1. Davis D., O’Brien M.T., Freemantle N., et. al.: Impact of formal continuing medical education: do conferences, workshops, rounds, and other traditional continuing education activities change physician behavior or health care outcomes?. JAMA 1999; 282: pp. 867-874.
2. Mammography quality standards act of 1992: Mammography facilities requirement for accrediting bodies, and quality standards and certifying requirements: interim rules (21 CFR 900). Fed Reg 1993; 58: pp. 57558-57572. Washington, DC: Government Printing Office1992. Report No.: 102-539
3. Mazmanian P.E., Davis D.A.: Continuing medical education and the physician as a learner: guide to the evidence. JAMA 2002; 288: pp. 1057-1060.
4. Davis D.A., Taylor-Vaisey A.: Translating guidelines into practice: a systematic review of theoretic concepts, practical experience and research evidence in the adoption of clinical practice guidelines. CMAJ 1997; 157: pp. 408-416.
5. Davis D.A., Thomson M.A., Oxman A.D., et. al.: Changing physician performance: a systematic review of the effect of continuing medical education strategies. JAMA 1995; 274: pp. 700-705.
6. Oxman A.D., Thomson M.A., Davis D.A., et. al.: No magic bullets: a systematic review of 102 trials of interventions to improve professional practice. CMAJ 1995; 153: pp. 1423-1431.
7. Carney P.A., Sickles E.A., Monsees B.S., et. al.: Identifying minimally acceptable interpretive performance criteria for screening mammography. Radiology 2010; 255: pp. 354-361.
8. Warren Burhenne L.J., Smith R.A., Tabar L., et. al.: Mammographic screening: international perspective. Semin Roentgenol 2001; 36: pp. 187-194.
9. Davis D.A., Lindsay E.A., Mazmanian P.E.: The effectiveness of CME interventions.Davis D.A.Fox R.D.The physician as learner: linking research to practice.1994.American Medical AssociationChicago, IL:pp. 245-280.
10. Davis D., Thomson M.A., Oxman A.D., et. al.: Evidence for the effectiveness of CME: a review of 50 randomized controlled trials. JAMA 1992; 268: pp. 1111-1117.
11. O’Brien M.A., Freemantle N., Oxman A.D., et. al.: Continuing education meetings and workshops: effects on professional practice and health care outcomes.2002.Cochrane Library, Update SoftwareOxford, England issue 1
12. Mazmanian P.E., Davis D.A.: Continuing medical education and the physician as a learner: Guide to the evidence. JAMA 2002; 288: pp. 1057-1060.
13. Perry N.M.: Breast cancer screening–the European experience. Int J Fertil Women’s Med 2004; 49: pp. 228-230.
14. Adcock K.A.: Initiative to improve mammogram interpretation. Permanente J Spring 2004; 8: pp. 12-18.
15. Linver M.N., Paster S., Rosenberg R.D., et. al.: Improvements in mammography interpretation skills in a community radiology practice after dedicated courses: 2-year medical audit of 38,633 cases. Radiology 1992; 184: pp. 39-43.
16. Berg W.A., D’Orsi C.J., Jackson V.P., et. al.: Does training in breast imaging reporting and data system (BI-RADS) improve biopsy recommendations of feature analysis agreement with experienced breast imagers at mammography?. Radiology 2002; 224: pp. 871-880.
17. Carney P.A., Geller B., Bogart A., et. al.: Association between time spent, confidence and accuracy of screening mammography. AJR Am J Roentgenol 2012; 198: pp. 970-978.
18. Geller BM, Bogart A, Carney PA, et al. Educational interventions to improve screening mammography interpretation: a randomized, controlled trial. AJR. In press.
19. Radiology ACR. Mammography case review. 2012; Available from: http://www.acr.org/mcr .
20. Sickles E.: The American College of Radiology’s Mammography Interpretive Skills Assessment (MISA) examination. Semin Breast Dis 2003; 6: pp. 133-139.
21. Ballard-Barbash R., Taplin S.H., Yankaskas B.C., et. al.: Breast Cancer Surveillance Consortium: a national mammography screening and outcomes database. AJR Am J Roentgenol 1997; 169: pp. 1001-1008.
22. Carney P.A., Geller B.M., Moffett H., et. al.: Current medico-legal and confidentiality issues in large multi-center research programs. Am J Epidemiol 2000; 152: pp. 371-378.
23. Elmore J.G., Jackson S.L., Abraham L., et. al.: Variability in interpretive performance of screening mammography and radiologist characteristics associated with accuracy. Radiology 2009; 253: pp. 641-651.
24. Buist D.S.M., Anderson M.L., Haneuse S.J.P.A., et. al.: The influence of volume on interpretive performance of screening mammography in the US. Radiology 2011; 259: pp. 72-84.
25. Kruskal W.H., Wallis W.A.: Use of ranks in one-criterion variance analysis. J Am Stat Assoc 1952; 47: pp. 583-621.
26. Carney P.A., Geller B.M., Sickles E.A., et. al.: Feasibility and satisfaction associated with using a tailored Web-based intervention for recalibrating radiologists thresholds for conducting additional work-up. Acad Radiol 2011; 18: pp. 369-376.
27. Urban N., Longton G.M., Crowe A.D., et. al.: Computer-Assisted Mammography Feedback Program (CAMFP) an electronic tool for continuing medical education. Acad Radiol 2007; 14: pp. 1036-1042.
28. Lewis R.S., Bhargavan M., Sunshine J.H.: Women radiologists in the United States: results from the American College of Radiology’s 2003 survey. Radiology 2007; 242: pp. 802-810.
29. Patefield W.M.: Algorithm AS159. An efficient method of generating r x c tables with given row and column totals. Appl Stat 1981; 30: pp. 91-97.