
Rationale and Objectives
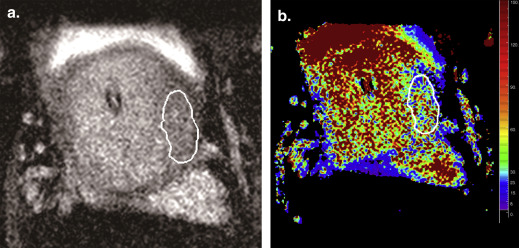
To assess the feasibility of quantitative T2* mapping at 3.0 T for prostate cancer detection and to investigate the use of T2* values to characterize tumor aggressiveness, with whole-mount step-section pathologic analysis as the reference standard.
Materials and Methods
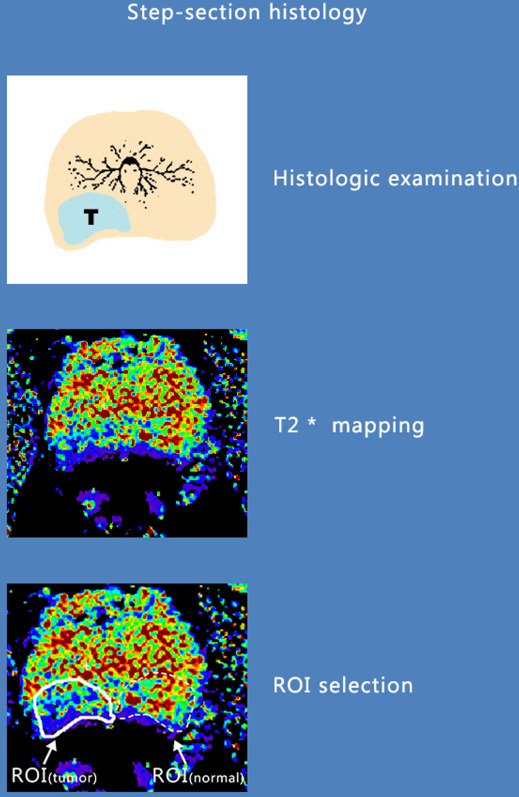
Prostate multiecho T2* was performed in 55 consecutive patients with prostate cancer using a multishot fast-field echo sequence at 3.0 T magnetic resonance imaging. T2* mapping was obtained by exponentially fitting the multiecho T2* images pixel by pixel with different echo times for each slice. Generalized estimating equations were used to test the T2* value difference between normal and malignant prostate regions and the association between T2* value and tumor Gleason scores.
Results
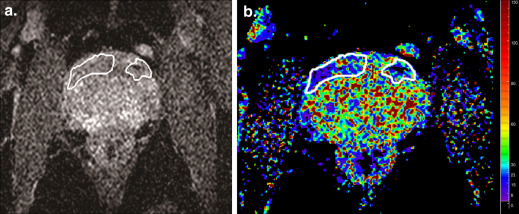
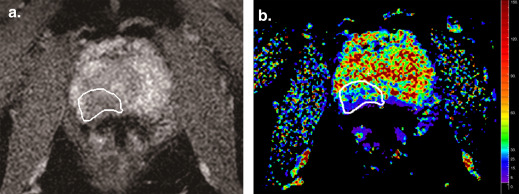
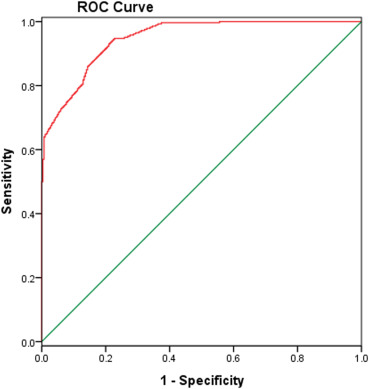
The T2* values of the cancerous prostatic regions (mean: 42.51 ± 0.65 milliseconds) were significantly lower ( P < .001) than those of the normal prostatic regions (mean: 74.87 ± 0.99 milliseconds). Adopting a threshold value of 59.27 milliseconds, T2* mapping resulted in 94.8% sensitivity and 77.3% specificity in the identification of prostate cancer. A lower mean T2* value was significantly associated with a higher tumor Gleason score (mean T2* values of 53.53, 43.75, 33.66, and 22.95 milliseconds were associated with Gleason score of 3 + 3, 3 + 4, 4 + 3, and ≥8, respectively P < .05).
Conclusions
From these preliminary data, quantitative T2* mapping seems to be a potential method in the characterization of prostate cancer. T2* mapping may provide additional quantitative information that significantly correlated with prostate cancer aggressiveness.
The prostate is the most common noncutaneous site of cancer among men in the United States . Owing to the increasing awareness of its variable biologic aggressiveness, the biggest challenge in managing patients with newly diagnosed prostate cancer is shifting from tumor detection alone to identifying patients with aggressive disease who would benefit from more radical therapy, while sparing those with indolent cancers.
Current clinical prostate magnetic resonance imaging (MRI) uses a multiparametric imaging approach to increase the sensitivity and specificity of diagnosis, including T2W-weighted turbo-spin echo (TSE) sequence, diffusion-weighted (DW) imaging, dynamic contrast enhancement (DCE) using gadolinium, and magnetic resonance spectroscopic (MRS) imaging. High-grade prostate cancer demonstrates decreased signal on T2W-TSE images, diffusion restriction, early/intense contrast enhancement with early contrast washout, and increased choline/decreased citrate on MRS . Multiple functional MRI techniques could make MRI a much more powerful tool for noninvasively characterizing prostate cancer. However, practical methods to analyze, interpret, and integrate the large amount of data generated by such a multiparametric approach are still lacking. Furthermore, for DCE-MRI, it required the administration of contrast material. Although DW-MRI is the one most commonly used in clinical prostate MRI protocols, it is still an evolving technique with several limitations to be overcome; these include intrinsic technical difficulties that result in image distortions and susceptibility artifacts and a lack of anatomic information and standardized acquisition and image analysis methods.
Get Radiology Tree app to read full this article<
Materials and Methods
Eligibility Criteria and Patient Characteristics
Get Radiology Tree app to read full this article<
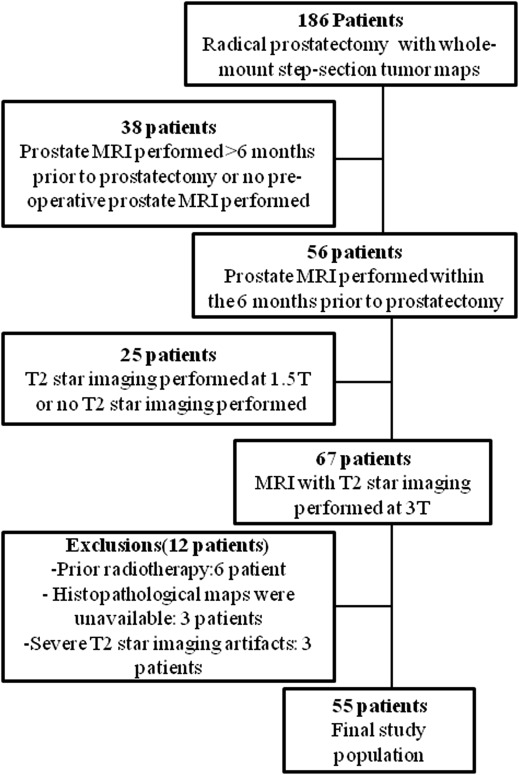
Table 1
Patient Characteristics
Characteristic Value Age (years) 56 (43–78) Initial prostate-specific antigen (ng/mL) 6.5 (0.9–107.2) Time between magnetic resonance imaging and prostatectomy (days) 23 (1–181) Patients ( n ) 55 Gleason score Biopsy 3 + 3 19 (35) 3 + 4 23 (42) 4 + 3 8 (15) >4 + 4 5 (9) Prostatectomy 3 + 3 10 (18) 3 + 4 30 (55) 4 + 3 14 (25) >4 + 4 1 (2)
Data are represented as n (%) or median (range).
Get Radiology Tree app to read full this article<
MRI Acquisition
Get Radiology Tree app to read full this article<
MRI Interpretation
Get Radiology Tree app to read full this article<
Get Radiology Tree app to read full this article<
Get Radiology Tree app to read full this article<
Histopathologic Analysis and Image Correlation
Get Radiology Tree app to read full this article<
Statistical Analysis
Get Radiology Tree app to read full this article<
Get Radiology Tree app to read full this article<
Results
Histopathology Results
Get Radiology Tree app to read full this article<
MRI Results
Get Radiology Tree app to read full this article<
Get Radiology Tree app to read full this article<
Get Radiology Tree app to read full this article<
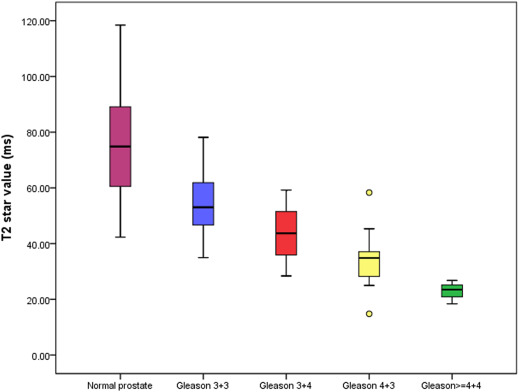
Table 2
Relationship Between Gleason Score (3 + 3, 3 + 4, 4 + 3, and ≥8) and Mean T2* Values
Number of Foci Mean T2* Value of the Foci_P_ Value Normal 286 74.87 ± 0.99P < .05 Malignant 286 42.51 ± 0.65 Gleason score = 3 + 3 52 53.53 ± 1.20P < .05 Gleason score = 3 + 4 156 43.75 ± 0.72 Gleason score = 4 + 3 71 33.66 ± 0.81 Gleason score ≥8 7 22.95 ± 1.31
Get Radiology Tree app to read full this article<
Discussion
Get Radiology Tree app to read full this article<
Get Radiology Tree app to read full this article<
Get Radiology Tree app to read full this article<
Get Radiology Tree app to read full this article<
Get Radiology Tree app to read full this article<
Get Radiology Tree app to read full this article<
Get Radiology Tree app to read full this article<
References
1. Jemal A., Siegel R., Xu J., et. al.: Cancer statistics, 2010. CA Cancer J Clin 2010; 60: pp. 277-300.
2. Hricak H., Choyke P.L., Eberhardt S.C., et. al.: Imaging prostate cancer: a multidisciplinary perspective. Radiology 2007; 243: pp. 28-53.
3. Mazaheri Y., Shukla-Dave A., Muellner A., et. al.: MR imaging of the prostate in clinical practice. MAGMA 2008; 21: pp. 379-392.
4. Turkbey B., Albert P.S., Kurdziel K., et. al.: Imaging localized prostate cancer: current approaches and new developments. AJR Am J Roentgenol 2009; 192: pp. 1471-1480.
5. Ghugre N.R., Enriquez C.M., Coates T.D., et. al.: Improved R2* measurements in myocardial iron overload. J Magn Reson Imaging 2006; 23: pp. 9-16.
6. Mamisch T.C., Hughes T., Mosher T.J., et. al.: T2 star relaxation times for assessment of articular cartilage at 3 T: a feasibility study. Skeletal Radiol 2012; 41: pp. 287-292.
7. Hardman R.L., El-Merhi F., Jung A.J., et. al.: Fast T2*-weighted MRI of the prostate at 3 Tesla. J Magn Reson Imaging 2011; 33: pp. 902-907.
8. Korteweg M.A., Zwanenburg J.J., Hoogduin J.M., et. al.: Dissected sentinel lymph nodes of breast cancer patients: characterization with high-spatial-resolution 7-T MR imaging. Radiology 2011; 261: pp. 127-135.
9. Apprich S., Mamisch T.C., Welsch G.H., et. al.: Evaluation of articular cartilage in patients with femoroacetabular impingement (FAI) using T2* mapping at different time points at 3.0 Tesla MRI: a feasibility study. Skeletal Radiol 2012; 41: pp. 987-995.
10. Liney G.P., Knowles A.J., Manton D.J., et. al.: Comparison of conventional single echo and multi-echo sequences with a fast spin-echo sequence for quantitative T2 mapping: application to the prostate. J Magn Reson Imaging 1996; 6: pp. 603-607.
11. Liney G.P., Lowry M., Turnbull L.W., et. al.: Proton MR T2 maps correlate with the citrate concentration in the prostate. NMR Biomed 1996 Apr; 9: pp. 59-64.
12. Roebuck J.R., Haker S.J., Mitsouras D., et. al.: Carr-Purcell-Meiboom-Gill imaging of prostate cancer: quantitative T2 values for cancer discrimination. Magn Reson Imaging 2009 May; 27: pp. 497-502.
13. Langer D.L., van der Kwast T.H., Evans A.J., et. al.: Prostate cancer detection with multi-parametric MRI: logistic regression analysis of quantitative T2, diffusion-weighted imaging, and dynamic contrast-enhanced MRI. J Magn Reson Imaging 2009; 30: pp. 327-334.
14. Haacke E.M., Mittal S., Wu Z., et. al.: Susceptibility-weighted imaging: technical aspects and clinical applications, part 1. AJNR Am J Neuroradiol 2009; 30: pp. 19-30.
15. Harada T., Tanigawa N., Matsuki M., et. al.: Evaluation of lymph node metastases of breast cancer using ultrasmall superparamagnetic iron oxide-enhanced magnetic resonance imaging. Eur J Radiol 2007 Sep; 63: pp. 401-407.