
Rationale and Objectives
The aim of this study was to optimize and validate projection-space denoising (PSDN) strategies for application to 80-kV computed tomographic (CT) data to achieve 50% dose reduction.
Materials and Methods
Image data obtained at 80 kV (mean CT dose index volume, 7.9 mGy) from dual-source, dual-energy CT enterographic (CTE) exams in 42 patients were used. For each exam, nine 80 kV image data sets were reconstructed using PSDN (three levels of intensity) with or without image-based denoising and compared to commercial reconstruction kernels. For optimization, qualitative analysis selected optimal denoising strategies, with quantitative analysis measuring image contrast, noise, and sharpness (full width at half maximum bowel wall thickness, maximum CT number gradient). For validation, two radiologists examined image quality, comparing low-dose 80-kV optimally denoised images to full-dose mixed-voltage images.
Results
PSDN algorithms generated the best 80-kV image quality (41 of 42 patients), while the commercial kernels produced the worst (39 of 42) ( P < .001). Overall, 80-kV PSDN approaches resulted in higher contrast (mean, 332 vs 290 Hounsfield units), slightly less noise (mean, 20 vs 26 Hounsfield units), but slightly decreased image sharpness (relative bowel wall thickness, 1.069 vs 1.000) compared to full-dose mixed-voltage images. Mean image quality scores for full-dose CTE images were 4.9 compared to 4.5 for optimally denoised half-dose 80-kV CTE images and 3.1 for nondenoised 80-kV CTE images ( P < .001).
Conclusion
Optimized denoising strategies improve the quality of 80-kV CTE images such that CT data obtained at 50% of routine dose levels approaches the image quality of full-dose exams.
Rapid technical innovations in computed tomographic (CT) technology have caused a dramatic growth in the annual volume of CT scans, with CT imaging now delivering almost half of the estimated collective dose of radiation exposure in the United States . Public health concerns have consequently arisen because of the small theoretical risk for radiation-induced malignancies . Despite the controversies over the actual risk for widespread but low-level radiation used in medical imaging, radiologists must adhere to the principle of keeping doses as low as reasonably achievable.
There are several available methods to reduce CT radiation dose, including the optimized and individualized tailoring of the acquisition parameters (tube current–time product [mAs] and tube voltage) to minimize dose and maximize diagnostic information. Although reductions of both mAs and voltage produce decreases in radiation dose, low-voltage scanning has additional advantages. Because the signal of iodinated contrast material is higher at lower energies, low-voltage CT acquisition can also be used as a method to increase disease conspicuity . In our practice, we have seen dramatic potential for low-voltage scanning in performing dual-energy CT enterographic (CTE) examintations, because iodine signal is increased by a factor of 1.7 at 80 kV (as opposed to 120 kV). Increased iodine signal highlights segmental mural hyperenhancement, which is correlated with active inflammation on small bowel biopsy . Because Crohn’s disease is the most common indication for CTE imaging, and because this disease affects young patients, who will possibly undergo multiple studies during symptomatic exacerbations throughout their lifetimes, radiation dose reduction in this group of patients would be particularly beneficial.
Get Radiology Tree app to read full this article<
Materials and methods
Patients and Scanning Technique
Get Radiology Tree app to read full this article<
Get Radiology Tree app to read full this article<
Noise Reduction Algorithm
Get Radiology Tree app to read full this article<
Get Radiology Tree app to read full this article<
Get Radiology Tree app to read full this article<
Get Radiology Tree app to read full this article<
Image Analysis
Get Radiology Tree app to read full this article<
Optimization of Denoising Strategies: Qualitative Analysis
Get Radiology Tree app to read full this article<
Optimization of Denoising Strategies: Quantitative Analysis
Get Radiology Tree app to read full this article<
Get Radiology Tree app to read full this article<
Validation of the Best Denoising Strategies
Get Radiology Tree app to read full this article<
Get Radiology Tree app to read full this article<
Get Radiology Tree app to read full this article<
Results
Patients and Scanning Technique
Get Radiology Tree app to read full this article<
Optimization of Denoising Strategies
Qualitative Analysis
Get Radiology Tree app to read full this article<
Table 1
Summary of Qualitative and Quantitative Comparison of Denoising Strategies by Contrast, Noise, and Image Sharpness (FWHM of Ileal Wall and Maximum Image Gradient Across Ileal Wall)
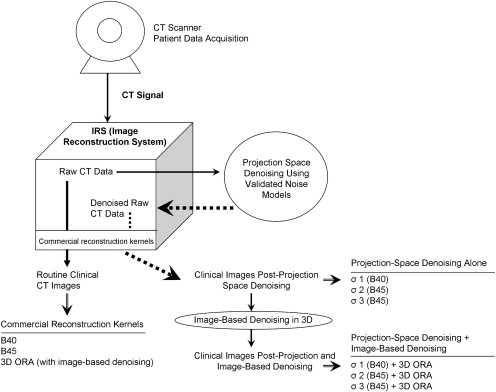
Qualitative Analysis Quantitative Analysis Denoising Strategy Number of Patients Denoising Strategy in Top 2 by Image Quality Contrast, Renal Cortex ( P ) Noise, Subcutaneous Fat ( P ) Relative FWHM vs Full Dose ( P ) Maximum Gradient Across Bowel Wall ( P ) Half dose, 80 kV, B40 0 340 (<.0001) 33 (2.38 −6 ) 0.997 (.800) 134 (<.0001) Half dose, 80 kV, 3D ORA, B40 1 339 (<.0001) 28 (.113) 1.019 (.107) 128 (<.0001) Half dose, 80 kV, B25 0 344 (<.0001) 29 (.046) 1.018 (.094) 125 (.006) Full dose, mixed voltage, B40 NA 290 26 1.000 120 Half dose, 80 kV, denoising (σ = 1) with 3D ORA, B40 14 335 (<.0001) 20 (<.0001) 1.055 (.0002) 103 (<.0001) Half dose, 80 kV, denoising (σ = 1) alone, B40 14 336 (<.0001) 21 (<.0001) 1.051 (.001) 107 (<.0001) Half dose, 80 kV, denoising (σ = 2) with 3D ORA, B45 12 331 (<.0001) 19 (<.0001) 1.063 (.001) 100 (<.0001) Half dose, 80 kV, denoising (σ = 2) alone, B45 15 330 (<.0001) 23 (.112) 1.056 (.0004) 102 (<.0001) Half dose, 80 kV, denoising (σ = 3) with 3D ORA, B45 11 329 (<.0001) 17 (<.0001) 1.094 (.0001) 93 (<.0001) Half dose, 80 kV, denoising (σ = 3) alone, B45 17 331 (<.0001) 20 (<.0001) 1.094 (<.0001) 96 (<.0001)
FWHM, full width at half maximum; NA, not applicable.
Rows above the full-dose, mixed-voltage scan display data for half-dose, 80-kV data sets using commercially available kernels (B40, routine; B25 and 3D ORA [Siemens Medical Solutions, Forchheim, Germany], with three-dimensional image-space denoising). Rows below the full-dose, mixed-voltage scan display data for half-dose, 80-kV data sets using projection-space denoising algorithms, with or without commercial kernels using image-space denoising. P values refer to the results of paired t tests comparing each denoising strategy to full-dose images.
Get Radiology Tree app to read full this article<
Get Radiology Tree app to read full this article<
Get Radiology Tree app to read full this article<
Quantitative Analysis
Get Radiology Tree app to read full this article<
Validation of the Best Denoising Strategies
Get Radiology Tree app to read full this article<
Table 2
Summary of Image Preference and IQ Scores for Full-dose CTE Exams and Optimally Denoised CTE Exams by the Two Validation Readers
Variable Reader 1
(% of Patients) Reader 2
(% of Patients) IQ assessment IQ score, full-dose data sets 4.9 4.8 IQ score, best denoising strategy for each patient 4.1 4.4 IQ score, best denoising strategy for size group 4.0 4.0 IQ score, nondenoised 80-kV data set 3.1 3.4 IQ score = 5 for full-dose data set 41 (97.6%) 34 (81%) IQ score ≥ 4 for best denoising strategy for the patient 40 (95.2%) 37 (88.1%) IQ score ≥ 4 to the best denoising strategy for the patient size group 39 (92.9%) 33 (78.6%) Same IQ score to the full-dose and best denoising strategy 8 (19%) 26 (62%) Same IQ score to the best denoising strategies for the patient and size group 38 (90.5%) 28 (66.7%) Image preference comparison Full-dose data set preferred 41 (97.6%) 37 (88.1%)
CTE, computed tomographic enterographic; IQ, image quality.
IQ was rated using a five-point scale (1 = nondiagnostic due to excessive noise or severe artifacts; 2 = severe artifacts or excessive noise, confidence degraded, diagnosis questionable; 3 = diagnostic, but excessive noise or moderate bowel wall blurriness; 4 = mild noise level or minimal bowel wall blurriness, no change in diagnostic confidence; and 5 = minimal noise with “crisp” bowel wall sharpness).
Get Radiology Tree app to read full this article<
Get Radiology Tree app to read full this article<
Discussion
Get Radiology Tree app to read full this article<
Get Radiology Tree app to read full this article<
Get Radiology Tree app to read full this article<
Get Radiology Tree app to read full this article<
Get Radiology Tree app to read full this article<
Get Radiology Tree app to read full this article<
Get Radiology Tree app to read full this article<
Acknowledgments
Get Radiology Tree app to read full this article<
Get Radiology Tree app to read full this article<
References
1. Mettler F.A., Thomadsen B.R., Bhargavan M., et. al.: Medical radiation exposure in the U.S. in 2006: preliminary results. Health Phys 2008; 95: pp. 502-507.
2. Berrington de Gonzalez A., Darby S.: Risk of cancer from diagnostic X-rays: estimates for the UK and 14 other countries. Lancet 2004; 363: pp. 345-351.
3. Nakayama Y., Awai K., Funama Y., et. al.: Abdominal CT with low tube voltage: preliminary observations about radiation dose, contrast enhancement, image quality, and noise. Radiology 2005; 237: pp. 945-951.
4. Szucs-Farkas Z., Verdun F.R., von Allmen G., Mini R.L., Vock P.: Effect of X-ray tube parameters, iodine concentration, and patient size on image quality in pulmonary computed tomography angiography: a chest-phantom-study. Invest Radiol 2008; 43: pp. 374-381.
5. Bodily K.D., Fletcher J.G., Solem C.A., et. al.: Crohn disease: mural attenuation and thickness at contrast-enhanced CT enterography—correlation with endoscopic and histologic findings of inflammation. Radiology 2006; 238: pp. 505-516.
6. Siegel M.J., Schmidt B., Bradley D., Suess C., Hildebolt C.: Radiation dose and image quality in pediatric CT: effect of technical factors and phantom size and shape. Radiology 2004; 233: pp. 515-522.
7. Hsieh J.: Adaptive streak artifact reduction in computed tomography resulting from excessive x-ray photon noise. Med Phys 1998; 25: pp. 2139-2147.
8. Kalra M.K., Maher M.M., Blake M.A., et. al.: Detection and characterization of lesions on low-radiation-dose abdominal CT images postprocessed with noise reduction filters. Radiology 2004; 232: pp. 791-797.
9. Kalra M.K., Maher M.M., Sahani D.V., et. al.: Low-dose CT of the abdomen: evaluation of image improvement with use of noise reduction filters pilot study. Radiology 2003; 228: pp. 251-256.
10. La Riviere P.J., Bian J., Vargas P.A.: Penalized-likelihood sinogram restoration for computed tomography. IEEE Trans Med Imaging 2006; 25: pp. 1022-1036.
11. Rizzo S.M., Kalra M.K., Schmidt B., et. al.: CT images of abdomen and pelvis: effect of nonlinear three-dimensional optimized reconstruction algorithm on image quality and lesion characteristics. Radiology 2005; 237: pp. 309-315.
12. Wang J.L.T., Lu H., Liang Z.: Penalized weighted least-squares approach to sinogram noise reduction and image reconstruction for low-dose x-ray computed tomography. IEEE Trans Med Imaging 2006; 25: pp. 1272-1283.
13. Manduca A., Yu L., Trzasko J.D., et. al.: Projection space denoising with bilateral filtering and CT noise modeling for dose reduction in CT. Med Phys 2009; 36: pp. 4911-4919.
14. Perona P., Malik J.: Scale-space and edge detection using anisotropic diffusion. IEEE Trans Patt Anal Mach Intell 1990; 12: pp. 629-639.
15. Anscombe J.: The transformation of Poisson, binomial and negative binomial data. Biometrika 1948; 15: pp. 246-254.
16. Whiting B.R., Massoumzadeh P., Earl O.A., O’Sullivan J.A., Snyder D.L., Williamson J.F.: Properties of preprocessed sinogram data in x-ray computed tomography. Med Phys 2006; 33: pp. 3290-3303.
17. Haaga J.R.: Radiation dose management: weighing risk versus benefit. AJR Am J Roentgenol 2001; 177: pp. 289-291.
18. Kalra M.K., Maher M.M., Prasad S.R., et. al.: Correlation of patient weight and cross-sectional dimensions with subjective image quality at standard dose abdominal CT. Korean J Radiol 2003; 4: pp. 234-238.
19. Peloquin J.M., Pardi D.S., Sandborn W.J., et. al.: Diagnostic ionizing radiation exposure in a population-based cohort of patients with inflammatory bowel disease. Am J Gastroenterol 2008; 103: pp. 2015-2022.
20. La Riviere P.J.: Penalized-likelihood sinogram smoothing for low-dose CT. Med Phys 2005; 32: pp. 1676-1683.
21. Kachelriess M., Watzke O., Kalender W.A.: Generalized multi-dimensional adaptive filtering for conventional and spiral single-slice, multi-slice, and cone-beam CT. Med Phys 2001; 28: pp. 475-490.
22. Schindera S.T., Nelson R.C., DeLong D.M., et. al.: Multi-detector row CT of the small bowel: peak enhancement temporal window—initial experience. Radiology 2007; 243: pp. 438-444.
23. Yu L., Li H., Fletcher J.G., McCollough C.H.: Automatic selection of tube potential for radiation dose reduction in CT: a general strategy. Med Phys 2010; 37: pp. 234-243.