
Rationale and Objectives
To evaluate the feasibility of micro computed tomography (CT) to assess the fine structure of breast tissue.
Methods and Materials
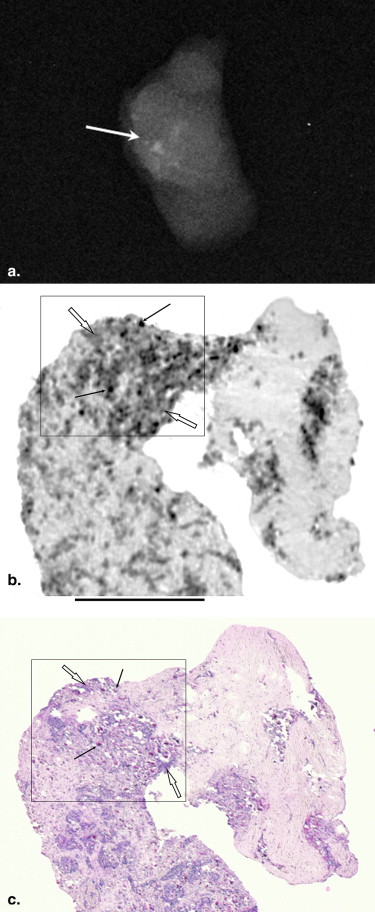
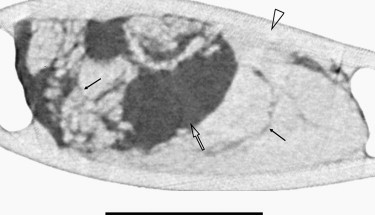
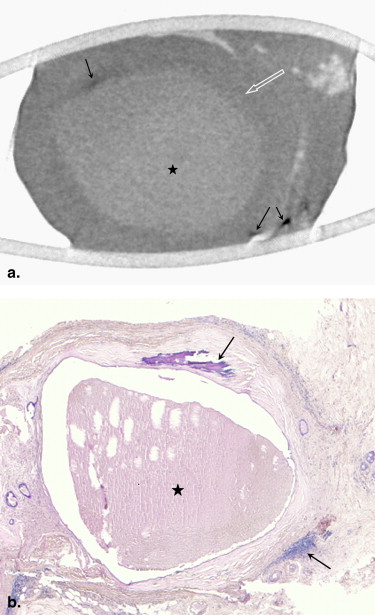
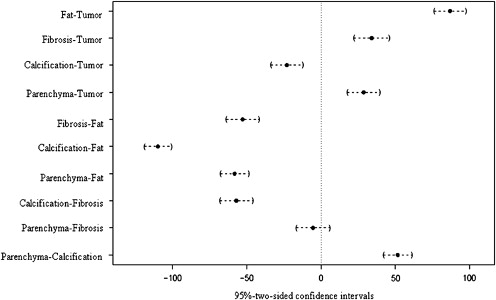
Breast core needle biopsy specimens (0.8 to 1.2 mm diameter) from fifteen women with clustered microcalcifications were examined using micro CT with isotropic voxels of 8.4 μm. Reconstructed two- and three-dimensional images were compared with the corresponding histological slices. Gray-scale measurements were performed in adipose tissue, fibroglandular tissue, fibrous tissue, microcalcifications, and tumor. The Tukey-Kramer method was applied to test the statistically significant differences between gray-scale attenuation values of breast tissue components.
Results
Soft-tissue architecture appearance at micro CT closely approximated that obtained by light microscopy at low power field. The Tukey-Kramer method revealed statistically significant differences for attenuation values for all combinations of breast tissue components with the exception of fibroglandular tissue versus fibrous tissue.
Conclusions
Micro CT is feasible for the differentiation of breast tissue components from core needle specimens.
Micro computed tomography (micro CT) is an in vitro and in vivo tomographic method to examine tissue specimens and small animals at micrometer resolution . Contrary to the gold standard of histological serial sectioning, this imaging method provides two- and three-dimensional information and new insights into the micro structure of tissues without destruction of the specimen.
Micro CT has been employed to analyze the architecture of the bone in osteoporosis, osteopenia, malformations, and tumors . Many studies have been published showing excellent correlation between three-dimensional micro CT stereological parameters and standard two-dimensional histomorphometry . Soft-tissue imaging with micro CT, however, is challenging because of the low intrinsic contrast between the different tissue components. By using sophisticated preparative and staining techniques, it is possible to image the terminal air spaces, subendocardial capillary network, vasa vasorum of the aorta, coronary artery plaque lesions, and microvascular architecture of the kidneys .
Get Radiology Tree app to read full this article<
Materials and methods
Get Radiology Tree app to read full this article<
Specimen Workup and Micro CT Imaging
Get Radiology Tree app to read full this article<
Get Radiology Tree app to read full this article<
Get Radiology Tree app to read full this article<
Get Radiology Tree app to read full this article<
Comparison of Micro CT images with Histopathological Sections
Get Radiology Tree app to read full this article<
Get Radiology Tree app to read full this article<
Statistical Analysis
Get Radiology Tree app to read full this article<
Results
Get Radiology Tree app to read full this article<
Get Radiology Tree app to read full this article<
Get Radiology Tree app to read full this article<
Get Radiology Tree app to read full this article<
Get Radiology Tree app to read full this article<
Discussion
Get Radiology Tree app to read full this article<
Get Radiology Tree app to read full this article<
Get Radiology Tree app to read full this article<
Get Radiology Tree app to read full this article<
Get Radiology Tree app to read full this article<
Get Radiology Tree app to read full this article<
Get Radiology Tree app to read full this article<
Conclusion
Get Radiology Tree app to read full this article<
References
1. Flannery B.P., Deckman W.G., Roberge W.G., et. al.: Three dimensional x-ray microtomography. Science 1987; 273: pp. 1439-1444.
2. Ritman E.L.: Molecular imaging in small animals—roles for micro CT. J Cell Biochem 2002; 39: pp. 116-124.
3. Jorgensen S.M., Demirkaya O., Ritman E.L.: Three-dimensional imaging of vasculature and parenchyma in intact rodent organs with x-ray micro CT. Am J Physiol Heart Circ Physiol 1998; 275: pp. H1103-H1114.
4. Borah B., Grass G.J., Dufresne T.E., et. al.: Three dimensional microimaging (MRmicrol and microCT), finite element modelling, and rapid prototyping provide unique insights into bone architecture in osteoporosis. Anat Rec 2001; 265: pp. 101-110.
5. McLaughlin F., Mackintosh J., Hayes B.P., et. al.: Glucocorticoid-induced osteopenia in the mouse as assessed by histomorphometry, micro computed tomography, and biochemical markers. Bone 2002; 30: pp. 924-930.
6. Fritz V., Louis-Plence P., Apparailly F., et. al.: Micro CT combined with bioluminescence imaging: a dynamic approach to detect early tumor-bone interaction in a tumor osteolysis murine model. Bone 2007; 40: pp. 1032-1040.
7. Nagase T., Sasazaki Y., Kikuchi T., et. al.: Rapid 3-dimensional imaging of embryonic craniofacial morphology using microscopic computed tomography. J Comput Assist Tomogr 2008; 32: pp. 816-821.
8. Müller R., Van Campenhout H., Van Damme B., et. al.: Morphometric analysis of human bone biopsies: a quantitative structural comparison of histological sections and micro computed tomography. Bone 1998; 23: pp. 59-66.
9. Litzlbauer H.D., Neuhaeuser C., Moell A., et. al.: Three-dimensional imaging and morphometric analysis of alveolar tissue from microfocal x-ray-computed tomography. Am J Physiol Lung Cell Mol Physiol 2006; 291: pp. 535-545.
10. Fortepiani L.A., Ruiz M.C.O., Passardi F., et. al.: Effect of losartan on renal microvasculature during chronic inhibition of nitric oxide visualized by micro-CT. Am J Renal Physiol 2003; 285: pp. 852-860.
11. Moritz R., Eaker D.R., Langheinrich A.C., et. al.: Quantification of vasa vasorum density in multi-slice computed tomography coronary angiogram: role of computed tomographic image voxel size. J Comput Assist Tomogr 2010; 34: pp. 273-278.
12. Langheinrich A.C., Bohle R.M., Greschus S., et. al.: Atherosclerotic lesions at micro CT: feasibility for analysis of coronary artery wall in autopsy specimen. Radiology 2004; 231: pp. 675-681.
13. Garcia-Sanz A., Rodriguez-Barbero A., Bentley M.D., et. al.: Three dimensional microcomputed tomography of renal vasculature in rats. Hypertension 1998; 31: pp. 440-444.
14. Wan S.Y., Kiraly A.P., Ritman E.L., et. al.: Extraction of the hepatic vasculature in rats using 3-D micro CT images. IEEE Trans Med Imaging 2000; 19: pp. 964-971.
15. Feldkamp L.A., Davis L.C., Dress J.W.: Practical cone-beam algorithm. J Opt Soc Am A 1984; 1: pp. 612-619.
16. Bravin A., Keyriläinen J., Fernández M., et. al.: High-resolution CT by diffraction-enhanced x-ray imaging: mapping of breast tissue samples and comparison with their histopathology. Phys Med Biol 2007; 52: pp. 2197-2211.
17. Nishide H., Kasuga T., Miyadi T.: [Report on the 89th Scientific Assembly and Annual Meeting of the Radiological Society of North America] Microfocus x-ray CT imaging of breast specimens with microcalcifications. Nippon Hoshasen Gijutsu Gakkai Zasshi 2004; 60: pp. 1662-1663.
18. Gromoll B., Salomon P.: Microcomputed tomography (micro CT): a possible useful technique in assessment of breast tumor specimen. Anal Quant Cytol Histol 2008; 30: pp. 60-61.
19. Kumaraswamy V., Carder P.J.: Examination of breast needle core biopsy specimens performed for screen-detected microcalcifications. J Clin Pathol 2007; 60: pp. 681-684.
20. Chen L.M., Forget P., Toth R., et. al.: Laser-based intense hard x-ray source for mammography. Proc SPIE 2003; 5030: pp. 923-928.
21. Beckmann F., Heise K., Kolsch B., et. al.: Three-dimensional imaging of nerve tissue by x-ray phase-contrast microtomography. Biophys J 1999; 76: pp. 98-102.
22. Ritman E.L.: Micro-computed tomography—current status and developments. Annu Rev Biomed Eng 2004; 6: pp. 185-208.
23. Metscher B.D.: Micro-CT for comparative morphology: simple staining methods allow high contrast 3D imaging of diverse non-mineralized animal tissue. BMC Physiol 2009; 9: pp. 11.