
Rationale and Objectives
To evaluate the effect of the temporal interval (TI) between scan acquisitions on the radiation dose and vascular parameters of computed tomography perfusion (CTP) in small peripheral lung cancers.
Materials and Methods
With 7 excluded, 40 patients with peripheral lung cancer (diameter ≤4 cm) prospectively underwent a 30-second CTP study. Vascular parameters were calculated for TI datasets of 0, 1, 1.5, 2, 2.5, and 3.5 seconds. With the TI and tumor diameter as fixed effects, univariate general linear model analysis was used to compare the vascular parameters at interval datasets with the reference CTP of 0 seconds.
Results
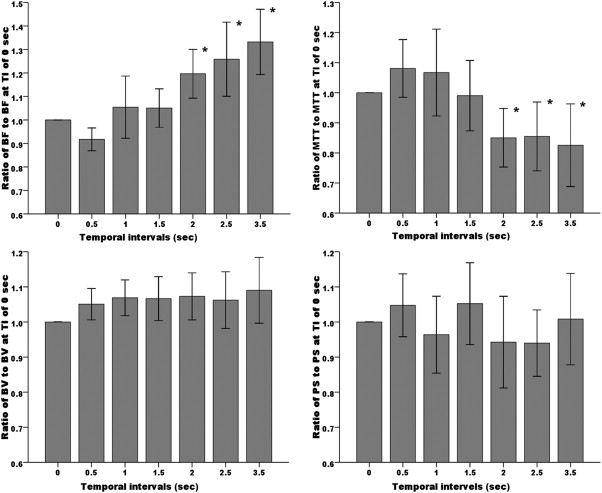
The TI had an impact on the blood flow and transit time ( P < .001 for both) but not on the blood volume and permeability surface area. The diameter influenced four vascular parameters ( P < .001 for all). Compared to the reference, no statistical differences were found in the four parameters at intervals of 0.5, 1, and 1.5 seconds ( P > .05 for all). In addition, blood flow was overestimated and transit was underestimated with increasing intervals of 2, 2.5, and 3.5 seconds ( P < .05 for all), but not the remaining parameters. An increased TI of 0.5–1.5 seconds resulted in an estimated radiation dose reduction of 50–73%.
Conclusion
The TI of 1.5 seconds between scan acquisitions in first-pass phase of CTP could be used to optimally balance the radiation dose and quantitative estimation in small peripheral lung cancers.
The assessment of tumoral neovascularization can be approximated by computed tomography perfusion (CTP) , dynamic contrast-enhanced magnetic resonance imaging (DCE-MRI) , and DCE ultrasound (DCE-US) . Based on the highly linear and predictable contrast pharmacodynamics of CT , the high temporal resolution of the scan acquisitions, the benefits of wide availability, and the relatively low cost, the significance of CTP had been explored and verified in clinical oncology studies . In the chest, CTP has also been increasingly promoted for use in the differential diagnosis or neovascularization of local pulmonary lesions, especially after the introduction of the volume or whole tumor mode .
When CTP is used, the temporal interval (TI) in the scan protocol should be set to a dedicated level for the accurate estimation of vascular parameters and radiation dose. Several authors evaluated the TI in the CTP use of flow phantom for tumors in sites with less respiratory-motion artifacts, such as the retroperitoneal and pelvic cavities . Recently, Miles et al proposed that the temporal sampling interval should not be less frequent than one image every 2 seconds for the measurement of tumoral blood flow (BF). However, to our knowledge, an appropriate TI in the first-pass phase of CTP in lung cancer, which involves intrinsic respiratory motion, that could be used to estimate the vascular parameters and to substantially reduce the radiation dose has not been studied in a major academic journal. The purpose of our study was to determine this verified TI in a perfusion scan protocol in first-pass CTP used to characterize small peripheral lung cancers.
Materials and methods
Patients
Get Radiology Tree app to read full this article<
Dynamic and Routine CT Studies
Get Radiology Tree app to read full this article<
Get Radiology Tree app to read full this article<
Get Radiology Tree app to read full this article<
CTP Data Processing and Analysis
Get Radiology Tree app to read full this article<
Get Radiology Tree app to read full this article<
Radiation Dose
Get Radiology Tree app to read full this article<
Statistical Analysis
Get Radiology Tree app to read full this article<
Results
Clinical Features and Histopathologic Results
Get Radiology Tree app to read full this article<
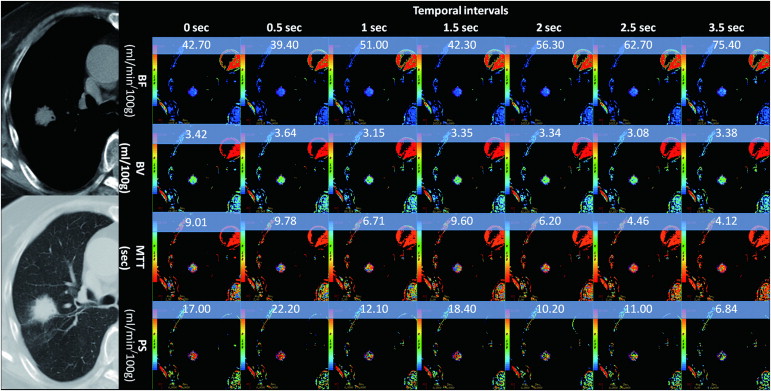
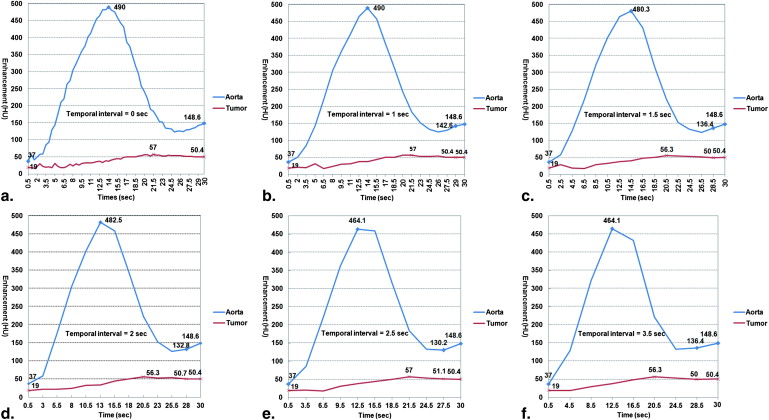
Dynamic Image Quality and Vascular Parameters at Sampling TIs
Get Radiology Tree app to read full this article<
Table 1
Vascular Parameters of Small Peripheral Lung Cancers at Sampling Temporal Intervals between CTP Acquisitions ( N = 40)
Parameter Temporal Intervals 0 sec 0.5 sec 1 sec 1.5 sec 2 sec 2.5 sec 3.5 sec BF
(mL/min / 100 g) Mean ± SD 71.58 ± 33.01 65.03 ± 32.00 73.83 ± 41.15 72.83 ± 33.53 81.96 ± 36.99 85.56 ± 42.03 89.38 ± 37.29 95% CI 61.02–82.14 54.80–75.26 60.67–86.98 62.11–83. 5 6 70.13–93.79 72.12–99.00 77.46–101.31P NA .337 1.000 1.000.035.026.002 BV
(mL/100 g) Mean ± SD 4.26 ± 1.66 4.40 ± 1.55 4.49 ± 1.72 4.43 ± 1.57 4.38 ± 1.38 4.36 ± 1.59 4.42 ± 1.50 95% CI 3.73–4.79 3.90–4.89 3.94–5.04 3.93–4.93 3.94–4.83 3.86–4.87 3.95–4.90P NA .943 .648 .489 .65 .987 .902 MTT
(sec) Mean ± SD 6.43 ± 2.94 6.57 ± 2.69 6.10 ± 2.29 5.80 ± 2.34 4.92 ± 1.81 4.79 ± 1.69 4.64 ± 1.91 95% CI 5.49–7.37 5.71–7.43 5.37–6.84 5.05–6.55 4.35–5.50 4.25–5.33 4.03–5.25P NA .999 .922 .428.001<.001<.001 PS
(mL/min / 100 g) Mean ± SD 18.22 ± 8.03 17.88 ± 7.27 16.77 ± 9.00 18.10 ± 8.20 16.36 ± 9.30 16.15 ± 7.08 18.34 ± 11.37 95% CI 15.66–20.79 15.55–20.20 13.89–19.64 15.48–20.72 13.39–19.33 13.89–18.42 14.71–21.98P NA 1.000 .863 .985 .315 .906 1.000
NA, not applicable; BF, blood flow; BV, blood volume; MTT, mean transit time; PS, capillary permeability–surface area product; CI, confidence interval.
The statistical analysis used a univariate general linear model with a randomized block design and post-hoc Dunnett analysis (with the temporal interval dataset of 0 second set as the control category).
Get Radiology Tree app to read full this article<
Difference of Vascular Parameters
Get Radiology Tree app to read full this article<
Get Radiology Tree app to read full this article<
Estimated Radiation Dose Reduction
Get Radiology Tree app to read full this article<
Discussion
Get Radiology Tree app to read full this article<
Get Radiology Tree app to read full this article<
Get Radiology Tree app to read full this article<
Get Radiology Tree app to read full this article<
Get Radiology Tree app to read full this article<
Get Radiology Tree app to read full this article<
Get Radiology Tree app to read full this article<
Get Radiology Tree app to read full this article<
Get Radiology Tree app to read full this article<
Get Radiology Tree app to read full this article<
Get Radiology Tree app to read full this article<
References
1. Miles K., Lee T.Y., Goh V., et. al.: Current status and guidelines for the assessment of tumour vascular support with dynamic contrast-enhanced computed tomography. Eur Radiol 2012; 22: pp. 1430-1441.
2. Ohno Y., Hatabu H., Takenaka D., et. al.: Solitary pulmonary nodules: potential role of dynamic MR imaging in management initial experience. Radiology 2002; 224: pp. 503-511.
3. Padhani A.R., Miles K.A.: Multiparametric imaging of tumor response to therapy. Radiology 2010; 256: pp. 348-364.
4. Lee T.Y., Purdie T.G., Stewart E.: CT imaging of angiogenesis. Q J Nucl Med 2003; 47: pp. 171-187.
5. Ohno Y., Koyama H., Matsumoto K., et. al.: Differentiation of malignant and benign pulmonary nodules with quantitative first-Pass 320-detector row perfusion CT versus FDG PET/CT. Radiology 2011; 258: pp. 599-609.
6. Sitartchouk I., Roberts H.C., Pereira A.M., et. al.: Computed tomography perfusion using first pass methods for lung nodule characterization. Invest Radiol 2008; 43: pp. 349-358.
7. Ma S.H., Le H.B., Jia B.H., et. al.: Peripheral pulmonary nodules: relationship between multi-slice spiral CT perfusion imaging and tumor angiogenesis and VEGF expression. BMC Cancer 2008; 8: pp. 186.
8. Lee Y.H., Kwon W., Kim M.S., et. al.: Lung perfusion CT: the differentiation of cavitary mass. Eur J Radiol 2010; 73: pp. 59-65.
9. Tacelli N., Remy-Jardin M., Copin M.C., et. al.: Assessment of non-small cell lung cancer perfusion: pathologic-CT correlation in 15 patients. Radiology 2010; 257: pp. 863-871.
10. Lind J.S., Meijerink M.R., Dingemans A.M., et. al.: Dynamic contrast-enhanced CT in patients treated with sorafenib and erlotinib for non-small cell lung cancer: a new method of monitoring treatment?. Eur Radiol 2010; 20: pp. 2890-2898.
11. Shan F., Zhang Z., Xing W., et. al.: Differentiation between malignant and benign solitary pulmonary nodules: Use of volume first-pass perfusion and combined with routine computed tomography. Eur J Radiol 2012; 81: pp. 3598-3605.
12. Haberland U., Klotz E., Abolmaali N.: Performance assessment of dynamic spiral scan modes with variable pitch for quantitative perfusion computed tomography. Invest Radiol 2010; 45: pp. 378-386.
13. Goh V., Liaw J., Bartram C.I., et. al.: Effect of temporal interval between scan acquisitions on quantitative vascular parameters in colorectal cancer: implications for helical volumetric perfusion CT techniques. AJR Am J Roentgenol 2008; 191: pp. W288-W292.
14. Kambadakone A.R., Sharma A., Catalano O.A., et. al.: Protocol modifications for CT perfusion (CTp) examinations of abdomen-pelvic tumors: impact on radiation dose and data processing time. Eur Radiol 2011; 21: pp. 1293-1300.
15. Lee C.H., Goo J.M., Ye H.J., et. al.: Radiation dose modulation techniques in the multidetector CT era: from basics to practice. Radiographics 2008; 28: pp. 1451-1459.
16. Kämena A., Streitparth F., Grieser C., et. al.: Dynamic perfusion CT: optimizing the temporal resolution for the calculation of perfusion CT parameters in stroke patients. Eur J Radiol 2007; 64: pp. 111-118.
17. Nakayama Y., Awai K., Funama Y., et. al.: Abdominal CT with low tube voltage: preliminary observations about radiation dose, contrast enhancement, image quality, and noise. Radiology 2005; 237: pp. 945-951.
18. Petralia G., Bonello L., Viotti S., et. al.: CT perfusion in oncology: how to do it. Cancer Imaging 2010; 10: pp. 8-19.
19. Wintermark M., Maeder P., Verdun F.R., et. al.: Using 80 kVp versus 120 kVp in perfusion CT measurement of regional cerebral blood flow. AJNR Am J Neuroradiol 2000; 21: pp. 1881-1884.
20. Li Y., Yang Z.G., Chen T.W., et. al.: Peripheral lung carcinoma: correlation of angiogenesis and first-pass perfusion parameters of 64-detector row CT. Lung Cancer 2008; 61: pp. 44-53.
21. Kiessling F., Boese J., Corvinus C., et. al.: Perfusion CT in patients with advanced bronchial carcinomas: a novel chance for characterization and treatment monitoring?. Eur Radiol 2004; 14: pp. 1226-1233.
22. Li Y., Yang Z.G., Chen T.W., et. al.: Whole tumour perfusion of peripheral lung carcinoma: evaluation with first-pass CT perfusion imaging at 64-detector row CT. Clin Radiol 2008; 63: pp. 629-635.
23. Miles K.A.: Perfusion CT for the assessment of tumour vascularity: which protocol?. Br J Radiol 2003; 76: pp. S36-S42.