
Rationale and Objectives
Visual search is an inhomogeneous yet efficient sampling process accomplished by the saccades and the central (foveal) vision. Areas that attract the central vision have been studied for errors in interpretation of medical imaging. In this study, we extend existing visual search studies to understand what characterizes areas that receive direct visual attention and elicit a mark by the radiologist (True and False Positive decisions) from those that elicit a mark but were captured by the peripheral vision. We also investigate if there are any differences between these areas and those that are never fixated by radiologists.
Materials and Methods
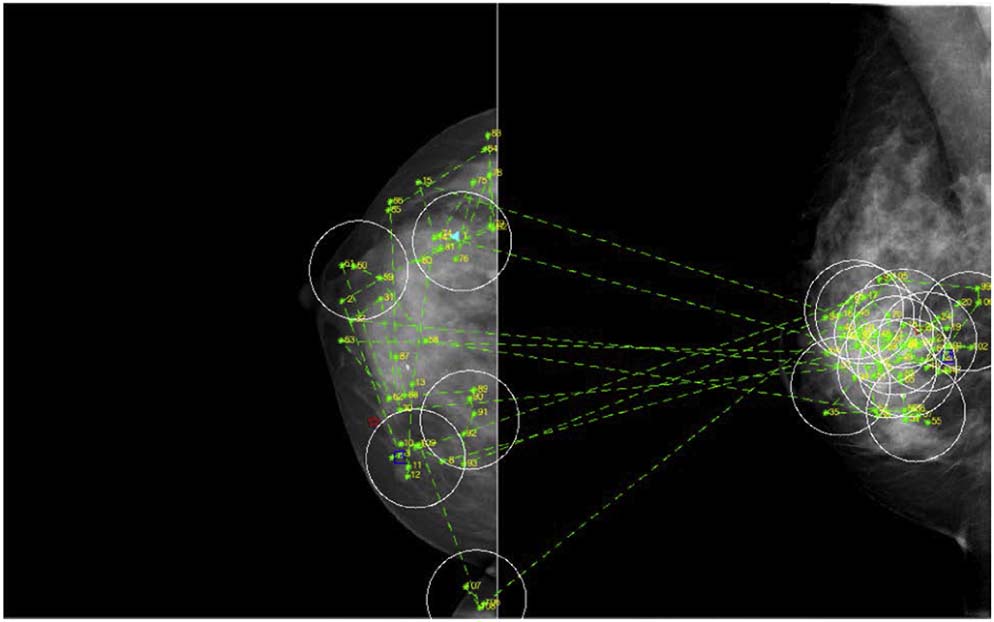
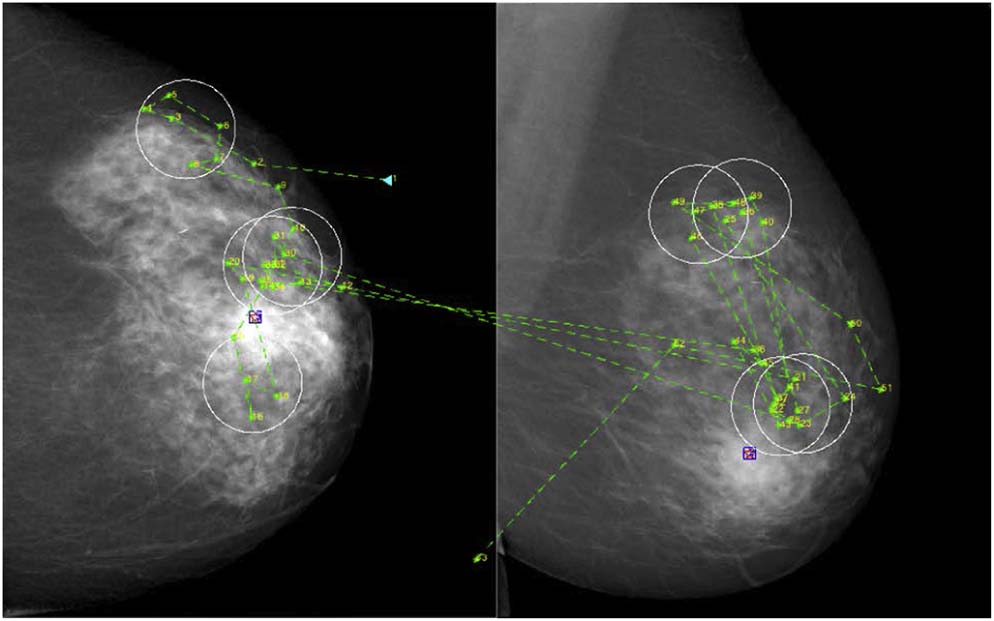
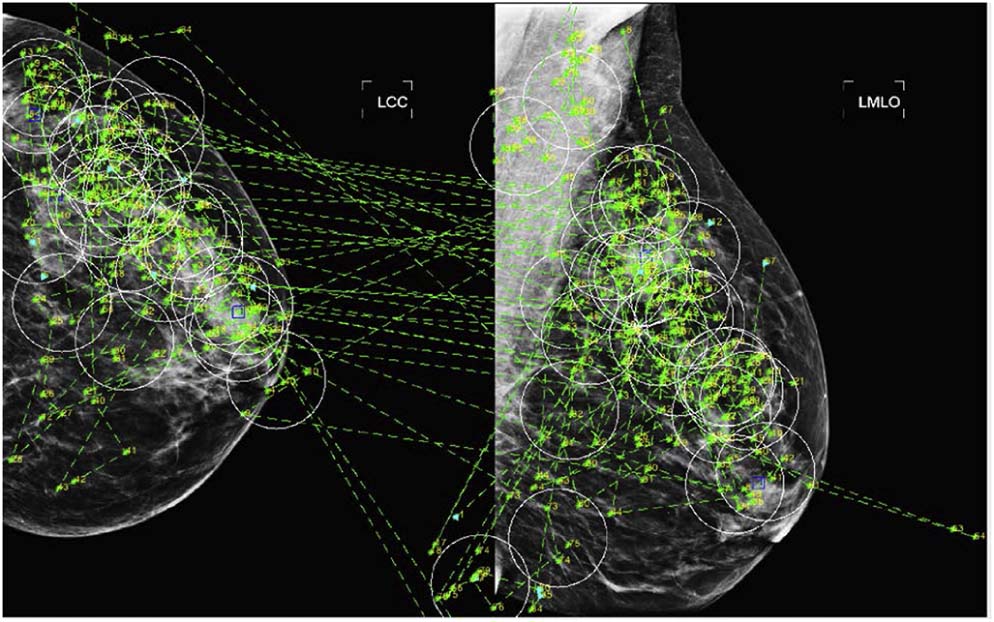
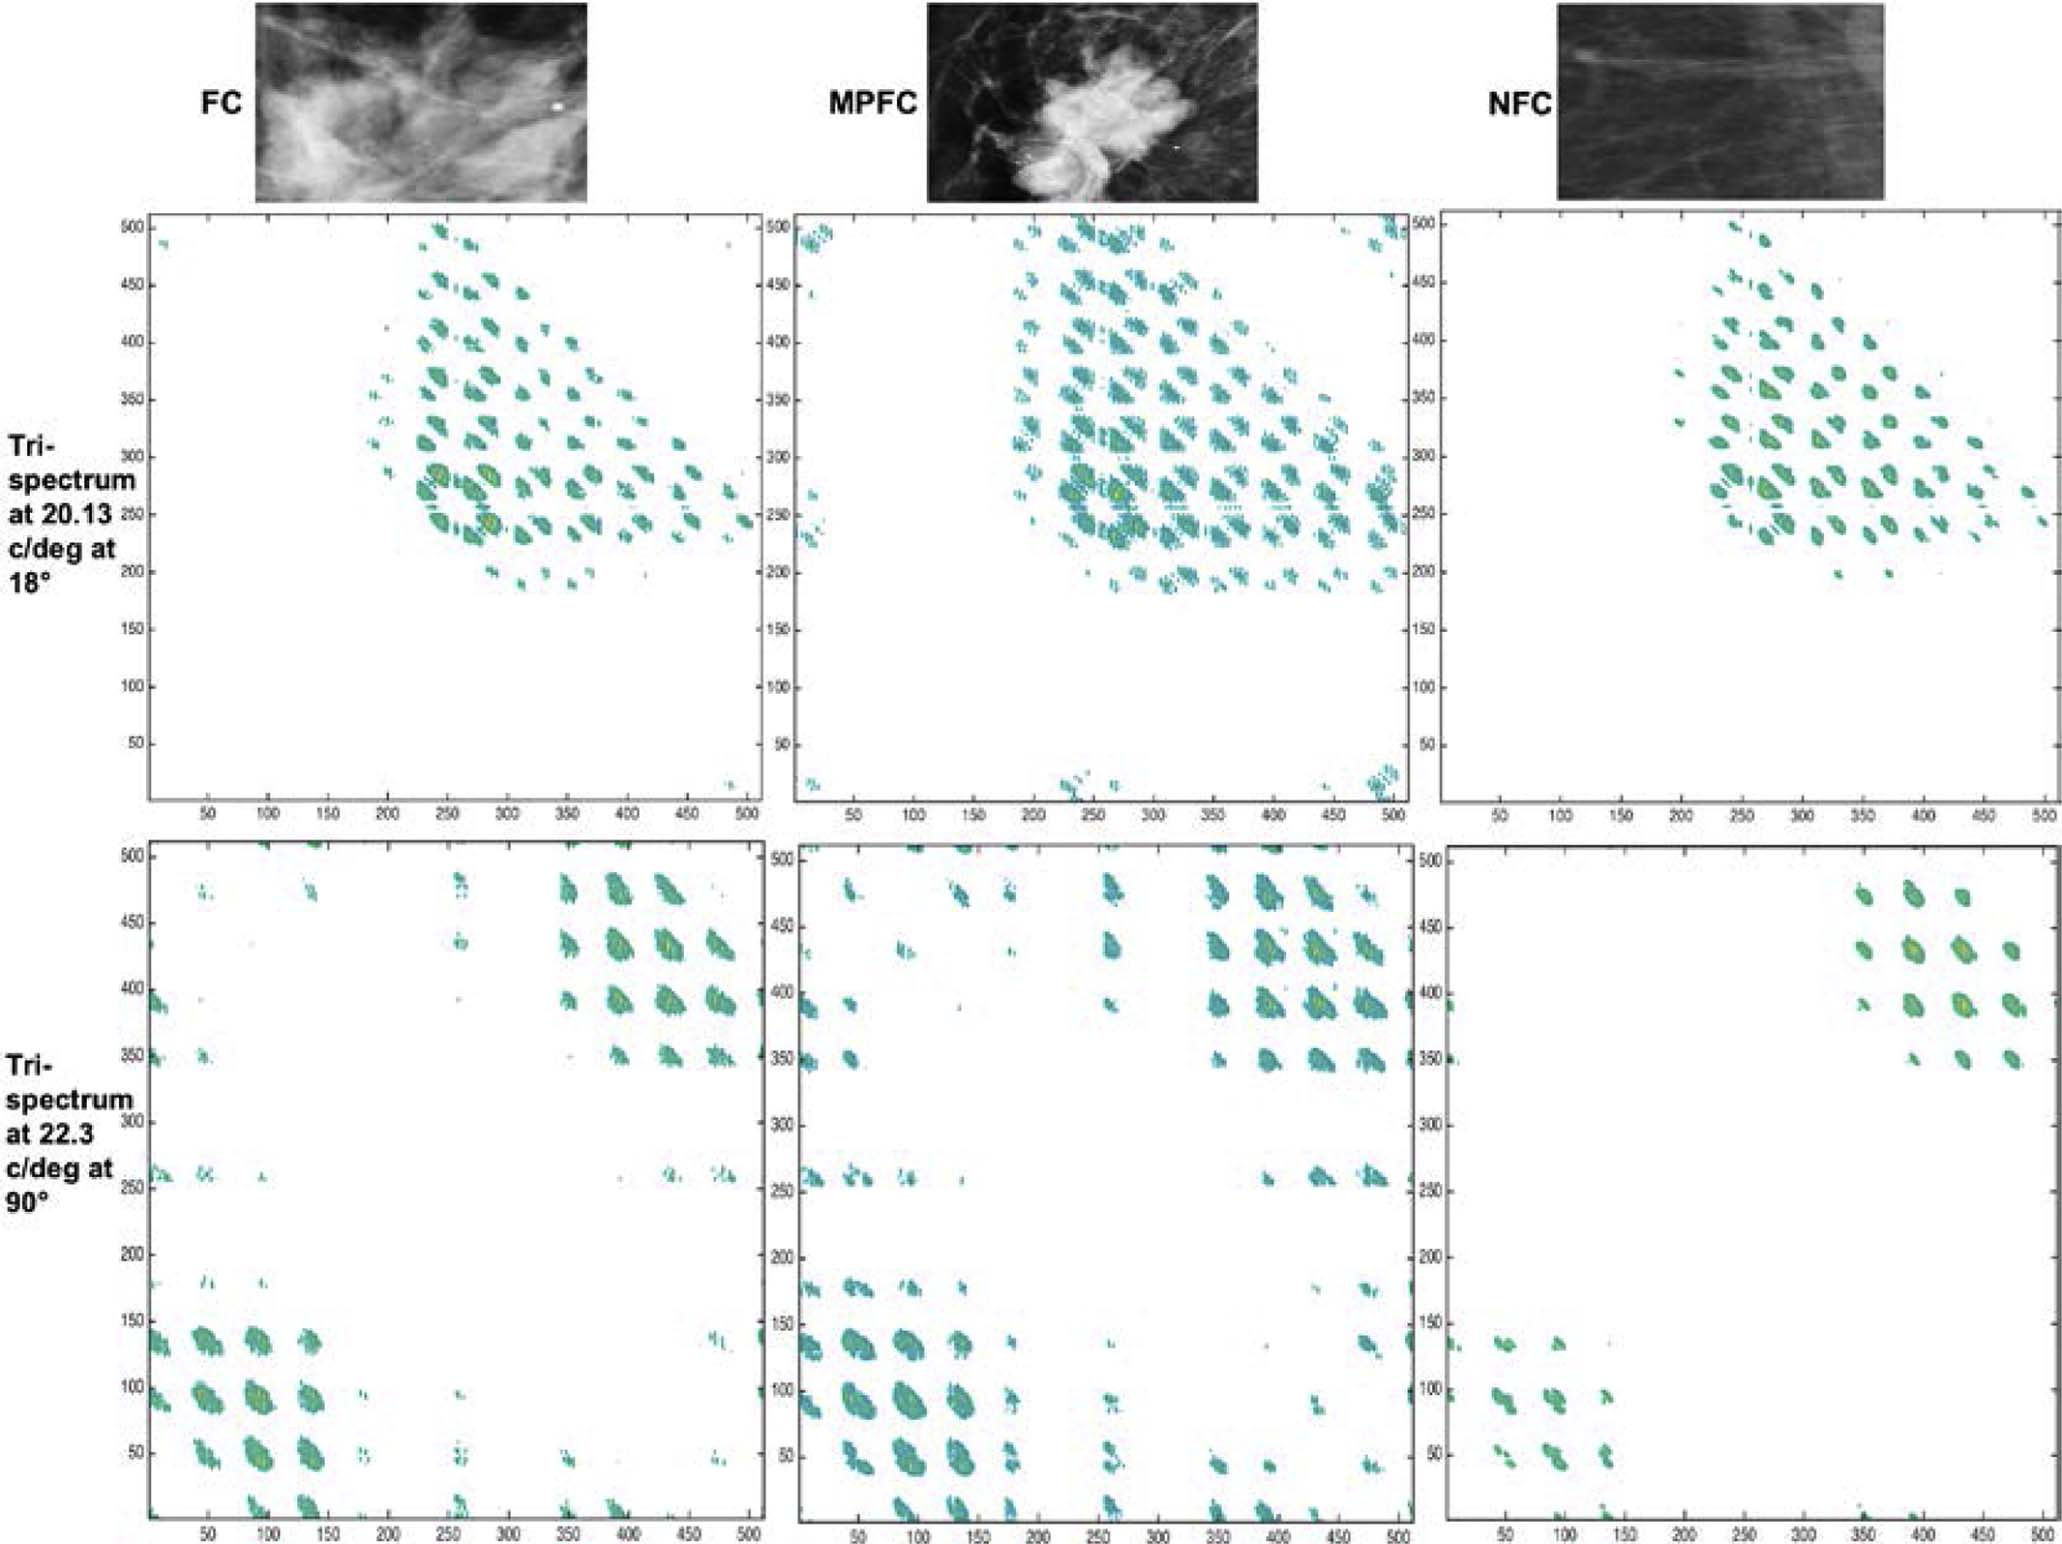
Eight radiologists participated in this fully crossed multi-reader multi-case visual search study of digital mammography (DM) involving 120 two-view cases (59 cancers). From these DM images, 3 types of areas, namely Fixated Clusters (FC), Marked Peripherally Fixated Clusters (MPFC) and Never Fixated Clusters (NFC), were extracted and analysed using statistical information theory (in the form of third and fourth-order cumulants and polyspectrum [specifically bispectrum and trispectrum]) in addition to traditional second-order statistics (in the form of power spectrum) and other nonspectral features to characterize these types of areas.
Results
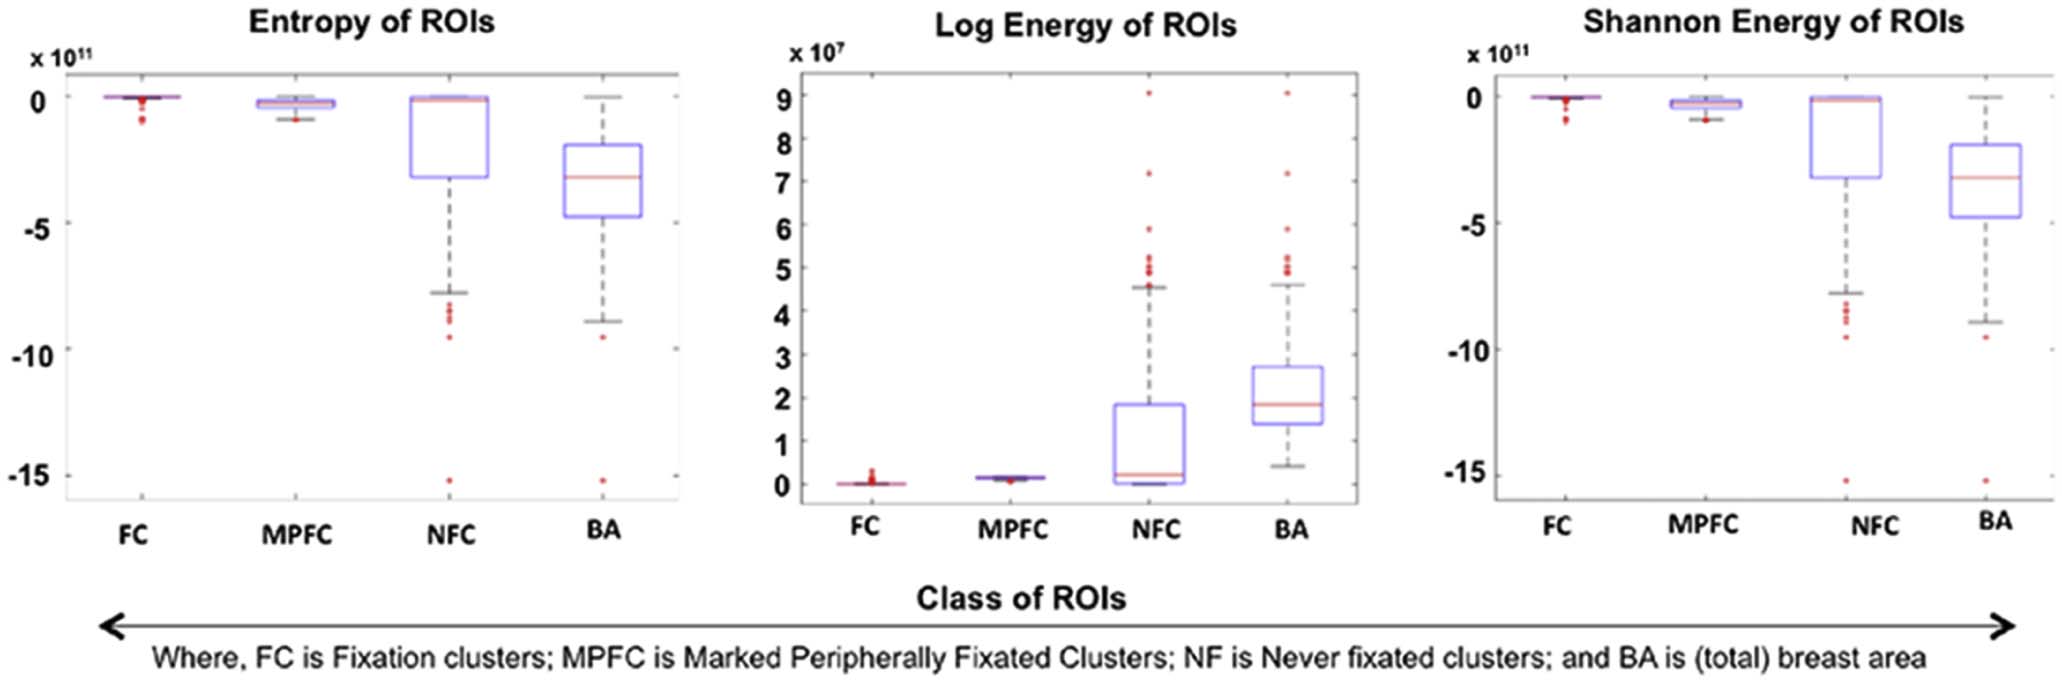
Our results suggest that energy profiles of FC, MPFC, and NFC areas are distinct. We found evidence that energy profiles and dwell time of these areas influence radiologists’ decisions (and confidence in such decisions). We also noted that foveated areas are selected on the basis of being most informative.
Conclusion
We show that properties of these areas influence radiologists’ decisions and their confidence in the decisions made.
Introduction
Because of the large complexity of the world that surrounds us, and the impossibility of sampling it all with a high-resolution lens, the human visual system has evolved to apply inhomogeneous sampling to any given scene. In this system, high detail is supported in the central vision, the fovea centralis , and resolution decays rapidly as one moves toward the periphery (with visual acuity dropping by 50% at about 10° of visual angle ). To be able to avoid missing important information in the world, the eyes move in a ballistic fashion from one point to the next, in a process called saccades , reaching speeds of 700°/sec . This allows the deployment of the foveal vision to all parts of a given scene, and efficient sampling of data to be carried out. Although many aspects of this system are well understood (such as its timing parameters, motor control, etc ), the selection of the regions to which the foveal vision is deployed is still an active area of research. This is a critical problem not only for understanding human behavior but also for developing efficient and effective computer-based search strategies.
Moreover, in the human visual system, the visual stimuli of various spatial locations and orientations are processed by three different types of cortical cells—classified as simple, complex, and hypercomplex . Hypercomplex cells are known to process signals of different orientations and length and are considered of high order as opposed to simple cells that process signals linearly . To simulate the processing of hypercomplex cells, we aimed to perform high-order statistical analysis. Higher-order statistics can also reveal complex differences such as structural properties (eg, corners, junctions, curved lines, curved edges) of a region that cannot be described by properties such as luminance, contrast, or spatial variance (obtained through autocorrelation or power spectrum).
Get Radiology Tree app to read full this article<
Get Radiology Tree app to read full this article<
Materials and Methods
Get Radiology Tree app to read full this article<
Study Design
Get Radiology Tree app to read full this article<
Get Radiology Tree app to read full this article<
Study Protocol
Get Radiology Tree app to read full this article<
Get Radiology Tree app to read full this article<
Get Radiology Tree app to read full this article<
Get Radiology Tree app to read full this article<
Data Processing
Get Radiology Tree app to read full this article<
Get Radiology Tree app to read full this article<
Extraction of Regions of Interest
Get Radiology Tree app to read full this article<
Get Radiology Tree app to read full this article<
Get Radiology Tree app to read full this article<
Get Radiology Tree app to read full this article<
Get Radiology Tree app to read full this article<
Get Radiology Tree app to read full this article<
Get Radiology Tree app to read full this article<
Assignment of Decision Outcome to ROIs
Get Radiology Tree app to read full this article<
Get Radiology Tree app to read full this article<
Background Suppression
Get Radiology Tree app to read full this article<
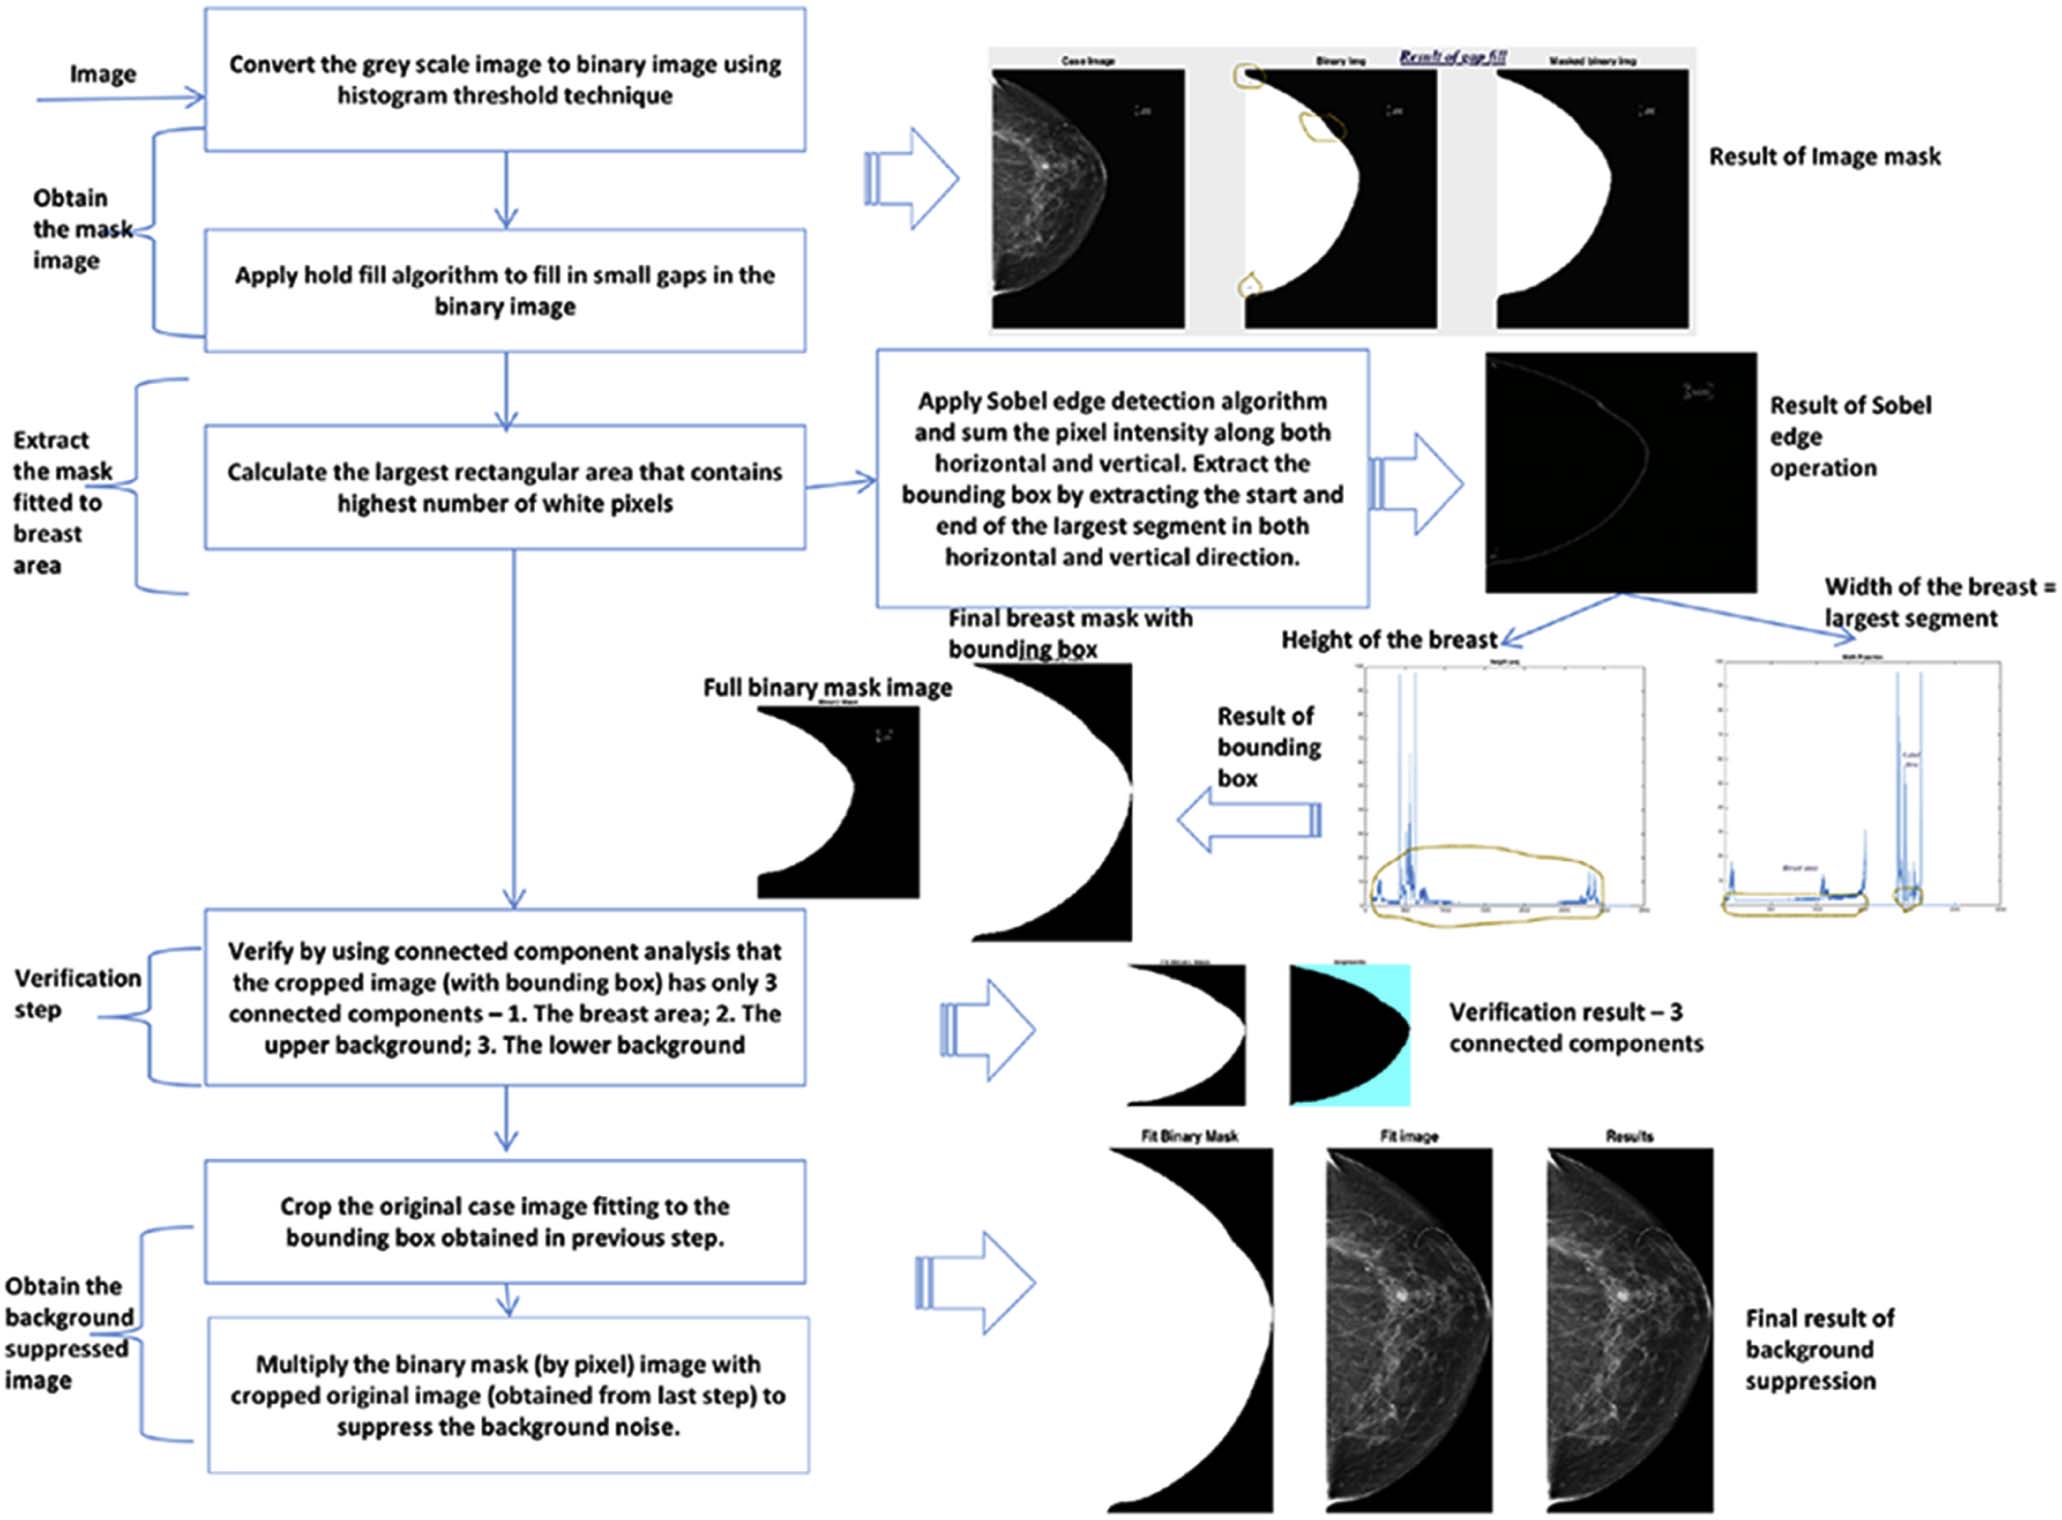
Get Radiology Tree app to read full this article<
Data Analysis
Get Radiology Tree app to read full this article<
Feature Extraction
Get Radiology Tree app to read full this article<
1. Get Radiology Tree app to read full this article<
a. Get Radiology Tree app to read full this article<
TABLE 1
Details of Local and Global Features that were Extracted from Various Breast Image ROIs
Global Features (Gray Level Co-occurrence Matrix Properties) Local Features (Spectral and Nonspectral Properties) Entropy Entropy of power spectrum \* Shannon energy Shannon energy of power spectrum \* Log energy Log energy of power spectrum \* Autocorrelation Cumulants of polyspectrum \* (first, second, and third order) Contrast Entropy of polyspectrum of third and fourth order \* (ie, bispectrum and trispectrum) Correlation Shannon energy of polyspectrum of third and fourth order \* (ie, bispectrum and trispectrum) Energy Log energy of polyspectrum of third and fourth order \* (ie, bispectrum and trispectrum) Homogeneity Dwell time † Sum of variance Number of fixation points in cluster † Difference of variance Average distance between fixation points in cluster † Sum of square of variance Sum of entropy Difference of entropy Average sum Dissimilarity Normalized inverse difference Normalized moment inverse difference
ROI, region of interest.
Get Radiology Tree app to read full this article<
Get Radiology Tree app to read full this article<
Get Radiology Tree app to read full this article<
Feature Analysis
Get Radiology Tree app to read full this article<
Get Radiology Tree app to read full this article<
Results
Descriptive Statistics
Get Radiology Tree app to read full this article<
TABLE 2
Details of Number of ROIs (Fixated Clusters, Marked Peripherally Fixated Clusters, and Never Fixated Clusters) Obtained in this Study per Radiologist and for All Radiologists Combined
Radiologist/Feature Total Marks Total Number of Fixation Clusters Total Number of Fixated Clusters that were Marked Total Number of Marked Peripherally Fixated Clusters Number of Never Fixated Clusters Number of Views All radiologists (combined) 1508 10458 390 1196 240 240 1 \* 131 773 77 56 2 191 1839 43 153 3 147 1846 39 123 4 \* 149 1120 69 117 5 401 2500 58 355 6 \* 187 1055 36 155 7 196 1048 32 165 8 \* 106 277 36 72
ROI, region of interest.
Get Radiology Tree app to read full this article<
Get Radiology Tree app to read full this article<
Get Radiology Tree app to read full this article<
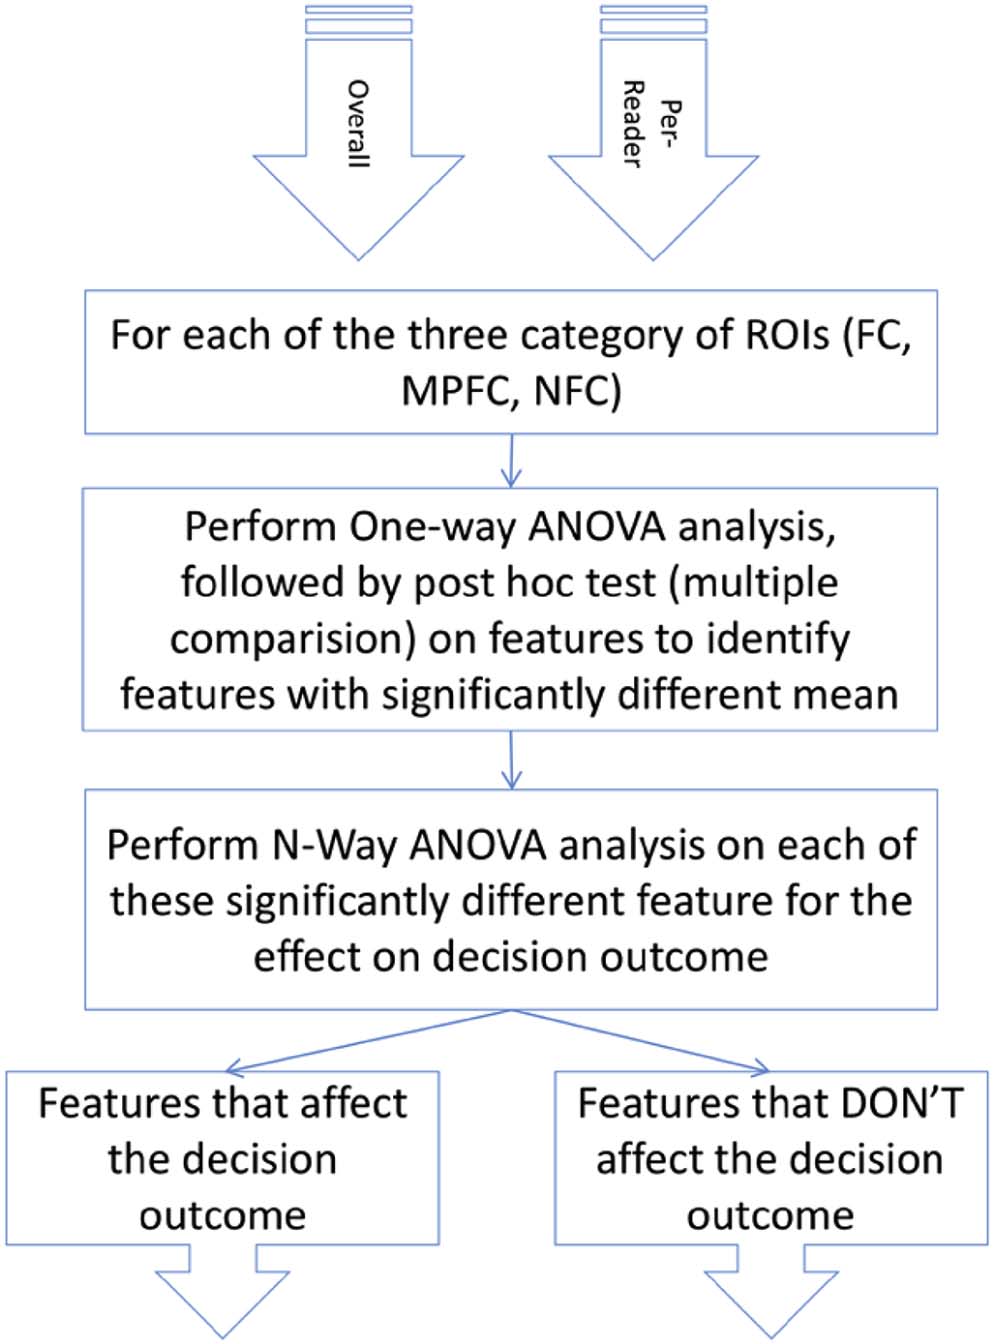
Feature Analysis
Get Radiology Tree app to read full this article<
FCs
Decision outcome
Get Radiology Tree app to read full this article<
TABLE 3
N-way ANOVA of Effect of Statistically Significantly Different Features (Identified During One-Way ANOVA, Figure 6 ) of Fixation Clusters on the Decision Outcome of Radiologists
Radiologist/Feature Global Feature Local Feature Entropy ( P Value) Shannon Energy ( P Value) Log Energy ( P Value) Dwell Time ( P Value) Log Energy of Trispectrum at 20.13 Cycle/Degree Frequency and 18° Orientation ( P Value) Log Energy of Trispectrum at 20.13 Cycle/Degree Frequency and 126° Orientation ( P Value) Log Energy of Trispectrum at 22.3 Cycle/Degree Frequency and 18° Orientation ( P Value) Log Energy of Trispectrum at 22.3 Cycle/Degree Frequency and 90° Orientation ( P Value) Log Energy of Trispectrum at 22.3 Cycle/Degree Frequency and 126° Orientation ( P Value) Log Energy of Trispectrum at 22.3 Cycle/Degree Frequency and 144° Orientation ( P Value) Log Energy of Trispectrum at 22.3 Cycle/Degree Frequency and 180° Orientation ( P Value) All radiologists (combined) Yes(0) Yes(0) Yes(0) Yes(0) No(0.997) No(0.9952) 1 Yes(0) Yes(0.0002) Yes(0.0001) Yes(0) No(0.9886) No(0.9856) No(0.918) No(0.9471) 2 No(0.2001) No(0.3976) No(0.8557) Yes(0) No(0.99630) No(0.9991) 3 No(0.183) Yes(0.0114) No(0.157) No(0.6317) No(0.9982) No(0.9964) 4 No(0.0889) Yes(0) No(0.8193) Yes(0) No(0.9717) No(0.9915) No(0.994) 5 Yes(0) Yes(0.0031) No(0.101) Yes(0) No(0.9985) 6 Yes(0.0161) No(0.279) No(0.9653) Yes(0.0002) No(0.996) No(0.9945) 7 Yes(0.0394) No(0.616) No(0.2519) No(0.256) No(0.9966) 8 Yes(0.0382) No(0.4222) No(0.5456) Yes(0.0312) No(0.9837)
ANOVA, analysis of variance.
Includes both all radiologists and per-radiologist analysis. The empty cells in this table are the features that were not found to have a statistically significantly different mean during one-way ANOVA of specified radiologist data, and hence the effect of this feature on decision outcome was not studied.
Get Radiology Tree app to read full this article<
Confidence scores
Get Radiology Tree app to read full this article<
TABLE 4
N-way ANOVA of Effect of Statistically Significantly Different Features (Identified During One-Way ANOVA, Figure 6 ) of Fixation Clusters on the Confidence Score of Radiologists
Radiologist/Feature Global Feature Local Feature Entropy ( P Value) Shannon Energy ( P Value) Log Energy ( P Value) Dwell Time ( P Value) Log Energy of Trispectrum at 20.13 Cycle/Degree Frequency and 18° Orientation ( P Value) Log Energy of Trispectrum at 22.3 Cycle/Degree Frequency and 18° Orientation ( P Value) Log Energy of Trispectrum at 22.3 Cycle/Degree Frequency and 90° Orientation ( P Value) Log Energy of Trispectrum at 22.3 Cycle/Degree Frequency and 126° Orientation ( P Value) Log Energy of Trispectrum at 22.3 Cycle/Degree Frequency and 144° Orientation ( P Value) Log Energy of Trispectrum at 22.3 Cycle/Degree Frequency and 180° Orientation ( P Value) All radiologists (combined) Yes(0.0016) Yes(0) Yes(0.0048) No(0.4284) No(0.709) No(0.58) No(0.6192) No(0.8587) No(0.1738) No(0.1738) 1 Yes(0.0484) Yes(0.0021) No(0.278) No(0.2972) No(0.6792) No(0.2222) No(0.3223) No(0.7005) No(0.0741) No(0.1757) 2 No(0.3095) No(0.3973) No(0.0845) No(0.6153) No(0.7572) No(0.9779) No(0.8591) No(0.7014) No(0.9504) No(0.8127) 3 No(0.1682) No(0.3656) No(0.0764) No(0.4612) No(0.1568) No(0.5144) No(0.1885) No(0.7558) No(0.7956) No(0.7717) 4 Yes(0.0448) Yes(0.0372) No(0.1085) No(0.5671) No(0.5803) No(0.5683) No(0.9109) Yes(0.0012) No(0.8233) Yes(0.0114) 5 No(0.8097) No(0.4946) Yes(0.0475) Yes(0.0052) No(0.7983) No(0.1153) No(0.9459) No(0.1595) Yes(0.0001) No(0.8279) 6 No(0.573) Yes(0.0099) No(0.3569) No(0.7739) No(0.8548) No(0.8302) No(0.8317) No(0.2024) No(0.5891) No(0.9634) 7 No(0.2424) Yes(0.0219) No(0.3774) No(0.4609) No(0.1996) No(0.5193) No(0.8166) Yes(0.0139) No(0.8173) No(0.9333) 8 No(0.1904) No(0.623) No(0.5029) No(0.4042) Yes(0.0144) No(0.8327) No(0.1385) No(0.629) No(0.629) No(0.3251)
ANOVA, analysis of variance.
Includes both all radiologists and per-radiologist analysis.
Get Radiology Tree app to read full this article<
MPFCs
Decision outcome
Get Radiology Tree app to read full this article<
TABLE 5
N-Way ANOVA of Effect of Statistically Significantly Different Features (Identified During One-Way ANOVA, Figure 6 ) of Marked Peripherally Fixated Clusters on the Decision Outcome and Confidence Score
Radiologist/Feature Effect of the Factor Global Feature Local Feature Entropy ( P Value) Shannon Energy ( P Value) Log Energy ( P Value) Log Energy of Power Spectrum at 0.6 Cycle/Degree Frequency and 0° Orientation ( P Value) Log Energy of Trispectrum at 20.13 Cycle/Degree Frequency and 126° Orientation ( P Value) Log Energy of Trispectrum at 22.3 Cycle/Degree Frequency and 18° Orientation ( P Value) Log Energy of Trispectrum at 22.3 Cycle/Degree Frequency and 90° Orientation ( P Value) Log Energy of Trispectrum at 22.3 Cycle/Degree Frequency and 126° Orientation ( P Value) Log Energy of Trispectrum at 22.3 Cycle/Degree Frequency and 180° Orientation ( P Value) All radiologists (combined) Decision outcome No(0.8163) No(0.2985) Yes(0.0066) One-way ANOVA of this feature group was not statistically significant, hence the study of the effect of decision outcome was not possible Confidence score Yes(0.0000) No(0.1489) No(0.2962) 1 Decision outcome No(0.5362) No(0.8000) No(0.7731) No(0.6902) No(0.9800) Confidence score No(0.3007) No(0.0510) No(0.2106) No(0.2593) No(0.8500) 2 Decision outcome No(0.6759) No(0.6500) No(0.3413) No(0.7820) No(0.9700) No(0.9700) Confidence score Yes(0.0008) No(0.6690) No(0.9751) No(0.4400) No(0.7500) No(0.8000) 3 Decision outcome No(0.5643) No(0.2800) No(0.0650) No(0.8520) No(0.4500) No(0.9800) No(0.5100) No(0.9991) Confidence score Yes(0.0194) No(0.5450) No(0.1903) No(0.4001) No(0.7200) No(0.3100) No(0.2100) No(0.3300) 4 Decision outcome No(0.3318) No(0.4100) No(0.6293) No(0.5533) No(0.9800) Confidence score No(0.1483) No(0.2400) No(0.2200) No(0.0680) No(0.6000) 5 Decision outcome No(0.5848) No(0.4500) No(0.3088) One-way ANOVA of this feature group was not statistically significant, hence the study of the effect of decision outcome was not possible Confidence score Yes(0.0045) No(0.0600) No(0.3088) 6 Decision outcome No(0.4300) No(0.6500) No(0.2431) No(0.0620) No(0.9800) Confidence score No(0.0908) Yes(0.0007) No(0.0710) No(0.0820) No(0.6100) 7 Decision outcome No(0.0843) Yes(0.0200) No(0.1097) Yes(0.0200) No(0.3900) No(0.8800) Confidence score Yes(0.0076) No(0.5000) No(0.4696) No(0.2000) Yes(0.0500) No(0.4600) 8 Decision outcome No(0.2435) No(0.5570) No(0.7646) No(0.0750) No(0.9639) Confidence score Yes(0.0314) Yes(0.0021) No(0.1141) Yes(0.0178) No(0.5083)
ANOVA, analysis of variance.
Includes both all radiologists and per-radiologist analysis. The empty cells in this table are the features that were not found to be of statistically significantly different mean during one-way ANOVA of specific radiologist data, and hence the effect of these features on decision outcome was not studied.
Get Radiology Tree app to read full this article<
Confidence scores
Get Radiology Tree app to read full this article<
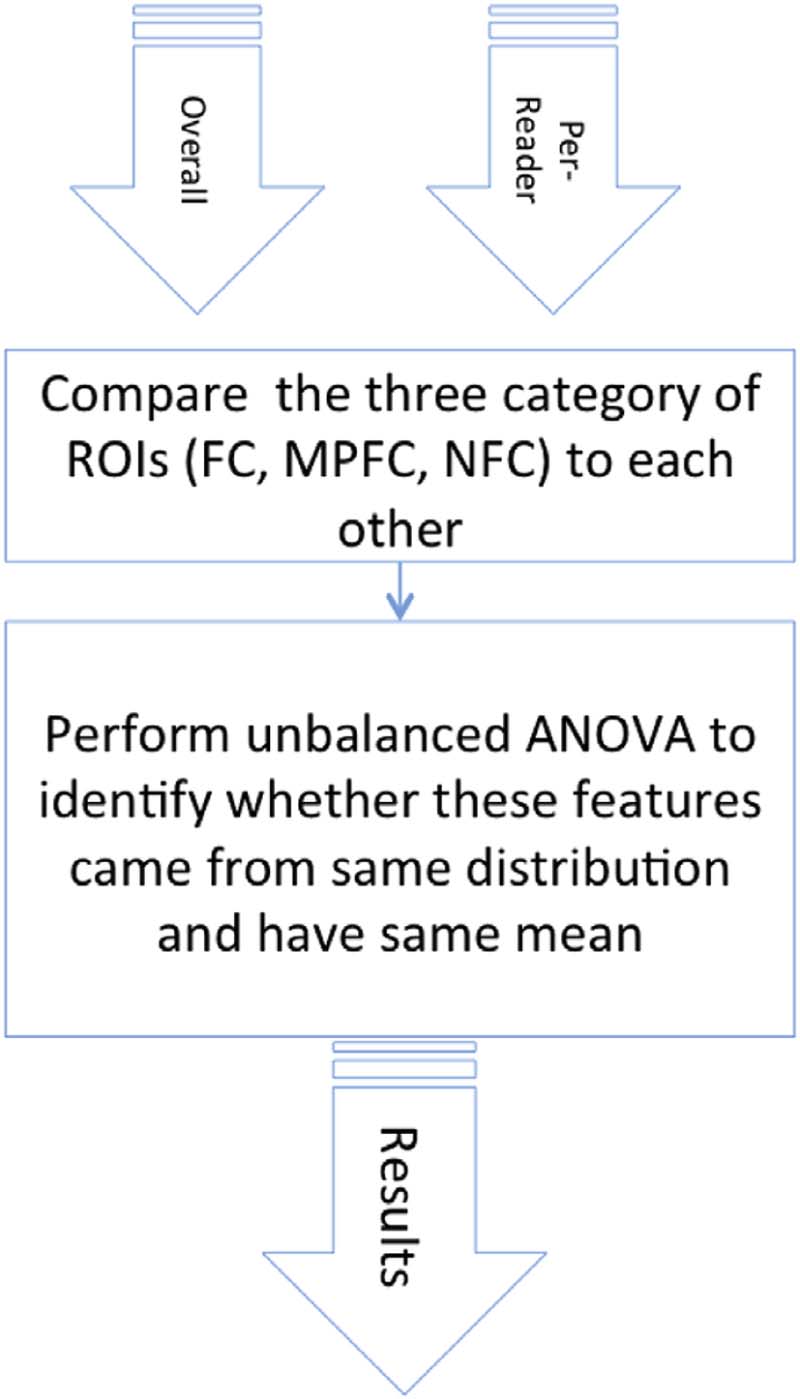
Pairwise Comparison of ROIs
Get Radiology Tree app to read full this article<
TABLE 6
Pairwise Comparison of Differences Between Features of Fixation Cluster (FC), Marked Peripherally Fixated Cluster (MPFC), and Never Fixated Cluster (NFC)
Radiologists Pairwise Clusters Global Feature Local Feature Entropy ( P Value) Shannon Energy ( P Value) Log Energy ( P Value) Gabor Log Energy of Power Spectrum Analysis at 0.6 Cycle/Degree Frequency Scale and 0° Orientation ( P Value) Log Energy of Trispectrum at 22.3 Cycle/Degree Frequency and 18° Orientation ( P Value) ANOVA ( P Value) ANOVA ( P Value) ANOVA ( P Value) ANOVA ( P Value) ANOVA ( P Value) All radiologists (combined) FC vs MPFC Yes(0) Yes(0) Yes(0) Yes(0) No(1) FC vs NFC No(0.0522) Yes(0) Yes(0) No(1) No(1) MPFC vs NFC Yes(0) Yes(0) Yes(0) Yes(0) No(1) 1 FC vs MPFC Yes(0) Yes(0.0467) Yes(0.0837) Yes(0) No(1) FC vs NFC Yes(0) Yes(0) Yes(0) Yes(0) No(0.176) MPFC vs NFC Yes(0) Yes(0) Yes(0) Yes(0) No(1) 2 FC vs MPFC Yes(0) Yes(0.0011) Yes(0) Yes(0) No(1) FC vs NFC Yes(0.0498) Yes(0) Yes(0.0499) Yes(0) Yes(0.0093) MPFC vs NFC Yes(0) Yes(0) Yes(0) Yes(0) No(0.128) 3 FC vs MPFC Yes(0) Yes(0.00384) Yes(0.0309) Yes(0) No(1) FC vs NFC No(0.128) Yes(0) Yes(0) Yes(0)) Yes(0.0095) MPFC vs NFC Yes(0) Yes(0) Yes(0) Yes(0) No(0.18) 4 FC vs MPFC Yes(0) Yes(0.0208) No(0.116) Yes(0) No(0.0644) FC vs NFC Yes(0.0003) Yes(0) Yes(0) Yes(0) MPFC vs NFC Yes(0) Yes(0) Yes(0) Yes(0) 5 FC vs MPFC Yes(0) Yes(0) Yes(0) Yes(0) No(1) FC vs NFC No(0.12) Yes(0) Yes(0) Yes(0) Yes(0.0012) MPFC vs NFC Yes(0) Yes(0) Yes(0) Yes(0) Yes(0.0113) 6 FC vs MPFC Yes(0) Yes(0.0114) No(0.0748) Yes(0) No(0.0697) FC vs NFC Yes(0.012) Yes(0) Yes(0) Yes(0) MPFC vs NFC Yes(0) Yes(0) Yes(0) Yes(0) 7 FC vs MPFC Yes(0) Yes(0.00173) Yes(0.0575) Yes(0) No(0.0716) FC vs NFC No(0.081) Yes(0) Yes(0) Yes(0) MPFC vs NFC Yes(0) Yes(0) Yes(0) Yes(0) 8 FC vs MPFC No(0.337) No(1) No(1) Yes(0) No(0.6744) FC vs NFC Yes(0) Yes(0) Yes(0) Yes(0) MPFC vs NFC Yes(0) Yes(0.0001) Yes(0) Yes(0)
ANOVA, analysis of variance.
Get Radiology Tree app to read full this article<
Get Radiology Tree app to read full this article<
High-Order Feature Analysis
Get Radiology Tree app to read full this article<
Get Radiology Tree app to read full this article<
Discussion
Get Radiology Tree app to read full this article<
Get Radiology Tree app to read full this article<
Deployment of Foveal Vision
Get Radiology Tree app to read full this article<
Get Radiology Tree app to read full this article<
ROIs and Their Features
Descriptive Statistics of ROIs
Get Radiology Tree app to read full this article<
Feature Analysis Results
Get Radiology Tree app to read full this article<
Get Radiology Tree app to read full this article<
Effect of high-order features
Get Radiology Tree app to read full this article<
Get Radiology Tree app to read full this article<
Get Radiology Tree app to read full this article<
Difference between FC and MPFC
Get Radiology Tree app to read full this article<
Limitations
Get Radiology Tree app to read full this article<
Get Radiology Tree app to read full this article<
Conclusion
Get Radiology Tree app to read full this article<
Get Radiology Tree app to read full this article<
Acknowledgments
Get Radiology Tree app to read full this article<
References
1. Kundel H.L., Nodine C.F., Thickman D., et. al.: Searching for lung nodules—a comparison of human-performance with random and systematic scanning models. Invest Radiol 1987; 22: pp. 417-422.
2. Yarbus A.L., Riggs L.A.: Eye movements and vision.1967.PlenumNew York
3. Baloh R.W., Sills A.W., Kumley W.E., et. al.: Quantitative measurement of saccade amplitude, duration, and velocity. Neurology 1975; 25: pp. 1065-1070.
4. Krieger G., Rentschler I., Hauske G., et. al.: Object and scene analysis by saccadic eye-movements: an investigation with higher-order statistics. Spat Vis 2000; 13: pp. 201-214.
5. Ursino M., La Cara G.E.: A model of contextual interactions and contour detection in primary visual cortex. Neural Netw 2004; 17: pp. 719-735.
6. Hubel D.H., Wiesel T.N.: Receptive fields, binocular interaction and functional architecture in the cat’s visual cortex. J Physiol 1962; 160: pp. 106-154. 2
7. Hubel D.H., Wiesel T.N.: Receptive fields and functional architecture in two nonstriate visual areas (18 and 19) of the cat. J Neurophysiol 1965; 28: pp. 229.
8. Zetzsche C.: Natural scene statistics and salient visual features.2005.Academic Presspp. 226-232.
9. Kundel H.L.: Peripheral vision, structured noise and film reader error. Radiology 1975; 114: pp. 269-273.
10. Kundel H.L., Nodine C.F., Carmody D.: Visual scanning, pattern recognition and decision-making in pulmonary nodule detection. Invest Radiol 1978; 13: pp. 175-181.
11. Carmody D.P., Nodine C.F., Kundel H.L.: An analysis of perceptual and cognitive factors in radiographic interpretation. Perception 1980; 9: pp. 339-344.
12. Mello-Thoms C., Nodine C.F., Kundel H.L.: Relating image based features to mammogram interpretation. Medical Imaging 2002 Conference. 2002 2002Feb 24–28; San Diego, Ca2002.
13. Mello-Thoms C., Dunn S.M., Nodine C.F., et. al.: The perception of breast cancers—a spatial frequency analysis of what differentiates missed from reported cancers. IEEE Trans Med Imaging 2003; 22: pp. 1297-1306.
14. Mello-Thoms C., Dunn S., Nodine C.F., et. al.: The perception of breast cancer: what differentiates missed from reported cancers in mammography?. Acad Radiol 2002; 9: pp. 1004-1012.
15. Mount D., Arya S., Kemp S.E., et. al.: Fast nearest neighbour search (Wraps Arya and Mount’s ANN: a library for approximate nearest neighbor searching). Available at: https://cran.r-project.org/web/packages/RANN/RANN.pdf https://www.cs.umd.edu/~mount/ANN/ Accessed November 17, 2015
16. Otsu N.: A threshold selection method from gray-level histograms. IEEE Trans Syst Man Cybern 1979; 9: pp. 62-66.
17. Daugman J.G.: Two-dimensional spectral analysis of cortical receptive field profiles. Vision Res 1980; 20: pp. 847-856.
18. Daugman J.G.: Uncertainty relation for resolution in space, spatial frequency, and orientation optimized by two-dimensional visual cortical filters. J Opt Soc Am A 1985; 2: pp. 1160.
19. Jones J.P., Palmer L.A.: An evaluation of the two-dimensional Gabor filter model of simple receptive fields in cat striate cortex. J Neurophysiol 1987; 58: pp. 1233.
20. Jones J.P., Palmer L.A.: The two-dimensional spatial structure of simple receptive fields in cat striate cortex. J Neurophysiol 1987; 58: pp. 1187.
21. Nikias C.L., Mendel J.M.: Signal processing with higher-order spectra. IEEE Signal Proc Mag 1993; 8: pp. 10-37.
22. Nikias C.L., Petropulu A.P.: Higher-order spectra analysis: a nonlinear signal processing framework.1993.PTR Prentice Hall
23. Rajashekar U., van der Linde I., Bovik A.C., et. al.: Foveated analysis of image features at fixations. Vision Res 2007; 47: pp. 3160-3172.
24. Reinagel P., Zador A.M.: Natural scene statistics at the centre of gaze. Network 1999; 10: pp. 341-350.
25. Kundel H.L., Nodine C.F., Toto L.: Searching for lung nodules. The guidance of visual scanning. Invest Radiol 1991; 26: pp. 777-781.
26. Kundel H.L., Nodine C.F.: Interpreting chest radiographs without visual search. Radiology 1975; 116: pp. 527.
27. Nodine C.F., Mello-Thoms C., Kundel H.L., et. al.: Time course of perception and decision making during mammographic interpretation. AJR Am J Roentgenol 2002; 179: pp. 917-923.
28. Alberdi E.P.A., Strigini L., Ayton P.: CAD: risks and benefits for radiologists’ decision.2010.Cambridge University PressCambridge:pp. p326-p330.
29. Muralidhar G.S., Haygood T.M., Stephens T.W., et. al.: Computer-aided detection of breast cancer—have all bases been covered?. Breast Cancer (Auckl) 2008; 2: pp. 5-9.
30. Manning D., Ethell S., Donovan T., et. al.: How do radiologists do it? The influence of experience and training on searching for chest nodules. Radiography 2006; 12: pp. 134-142.
31. Kok E.M., Jarodzka H., de Bruin A.B.H., et. al.: Systematic viewing in radiology: seeing more, missing less?. Adv Health Sci Educ Theory Pract 2016; 21: pp. 189-205.