
Rationale and Objectives
Tumor vascular heterogeneity is a recognized biomarker for cancer progression. Our purpose was to assess the tumor perfusion heterogeneity during antiangiogenic therapy in hepatocellular carcinoma (HCC) by means of fractal analysis on computed tomography perfusion (CTP) images.
Materials and Methods
Twenty-two patients (15 men and 7 women; mean age: 61.5 years) with advanced HCC underwent CTP at baseline and 2 weeks after administration of bevacizumab. Perfusion maps of blood flow (BF) were generated by the adiabatic approximation to the tissue homogeneity model with a motion registration, and fractal analyses were applied to gray-scale perfusion maps using a plugin tool on ImageJ software (NIH, Bethesda, MD). A differential box-counting method was applied, and the fractal dimension (FD) was calculated as a heterogeneity parameter.
Results
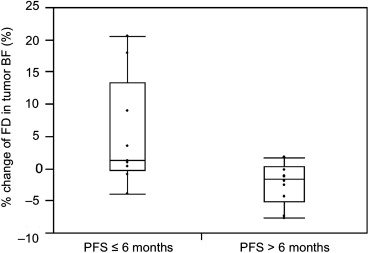
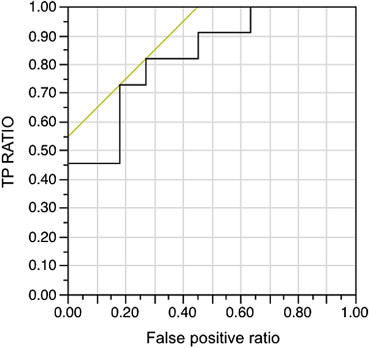
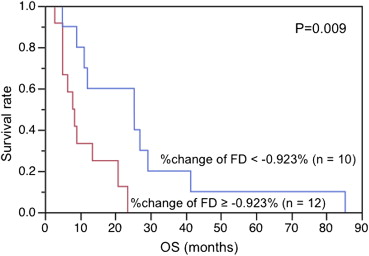
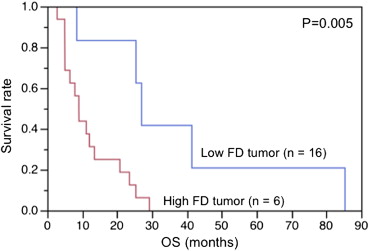
Patients were grouped into favorable progression-free survival (PFS) group (PFS>6 months, 11 patients) and unfavorable PFS group (PFS≤6, 11 patients). After 2 weeks of antiangiogenic therapy, the BF decreased significantly ( P < .0001), whereas the FD showed no significant change ( P = .69). The percent change of the FD in tumor BF was significantly different between patients with favorable PFS and those without (−2.52% vs. 3.72%, P = .01), whereas the change of tumor BF showed no significant difference between them (−28.93% vs. −25.47%, P = .64). In Kaplan–Meier analysis, patients with greater reduction in the percent change of FD and lower baseline FD in tumor BF showed significantly longer overall survival ( P = .009, P = .005).
Conclusions
Fractal analysis of tumor BF can be a biomarker for antiangiogenic therapy.
Despite various therapeutic options, hepatocellular carcinoma (HCC) is still the third most common cause of cancer-related mortality worldwide . HCC is a highly vascularized tumor with an elevated level of vascular endothelial growth factor (VEGF) and high microvessel density (MVD) . Greater expression of VEGF, which leads to focal leaks in tumor vessels, causing nonuniform blood flow (BF) and heterogeneous delivery of drugs and oxygen , has been associated with shorter survival in patients with HCC . Therefore, inhibition of angiogenesis represents a potential therapeutic target in HCC, and a large number of antiangiogenic agents are currently being tested for the treatment of HCC . For example, the Sorafenib HCC Assessment Randomized Protocol trials showed an improved overall survival (OS) in patients with advanced HCC on treatment with the antiangiogenic and antiproliferative agent sorafenib .
These responses are currently assessed by Response Evaluation Criteria in Solid Tumors (RECIST) . However, RECIST has been recognized for their limitation in assessing the antitumor activity of antiangiogenic therapies, because antiangiogenic agents suppress tumor growth by downregulating angiogenesis without causing much morphologic change . In this context, functional vascular imaging techniques such as computed tomography perfusion (CTP) or dynamic contrast-enhanced magnetic resonance imaging (MRI) are highly promising . In HCC, significant decreases in tumor blood perfusion measured by CTP or DCE-MRI after antiangiogenic treatments have been reported . These perfusion changes are consistent with the vascular normalization induced by antiangiogenic therapy . The reduction of heterogeneity in tumor perfusion has also been reported to be the process of vascular normalization during antiangiogenic therapy in in vitro studies . However, this heterogeneity change in tumor perfusion during antiangiogenic therapy has not yet been demonstrated in in vivo studies.
Get Radiology Tree app to read full this article<
Materials and methods
Patient Population
Get Radiology Tree app to read full this article<
Treatment
Get Radiology Tree app to read full this article<
Imaging Studies
Get Radiology Tree app to read full this article<
Image Processing
CTP technique
Get Radiology Tree app to read full this article<
Fractal Analysis
Get Radiology Tree app to read full this article<
Get Radiology Tree app to read full this article<
Statistical Analysis
Get Radiology Tree app to read full this article<
Results
Patient Characteristics
Get Radiology Tree app to read full this article<
Changes of Tumor BF and FD in Tumor BF after 2 Weeks of Bevacizumab
Get Radiology Tree app to read full this article<
Table 1
Tumor BF and FD in Tumor BF at Baseline and 2 Weeks after Antiangiogenic Therapy
Baseline After 2 Weeks_P_ BF 28.33 ± 9.60 20.65 ± 10.24 <.0001 FD 1.07 ± 0.12 1.07 ± 0.12 .69
BF, blood flow; FD, fractal dimension.
Get Radiology Tree app to read full this article<
Tumor BF and FD in Tumor BF at Baseline and after 2 Weeks of Bevacizumab between Favorable and Unfavorable PFS Groups of HCC
Get Radiology Tree app to read full this article<
Table 2
Baseline Magnetic Resonance–derived Parameters and Clinical Features
Baseline After 2 Weeks PFS ≤ 6 Months PFS > 6 Months_P_ PFS ≤ 6 Months PFS > 6 Months_P_ BF 29.54 ± 9.93 27.11 ± 9.57 .55 20.87 ± 10.36 20.43 ± 10.61 .94 FD 1.05 ± 0.13 1.08 ± 0.12 .39 1.09 ± 0.13 1.05 ± 0.12 .47
BF, blood flow; FD, fractal dimension; PFS, progression-free survival.
Get Radiology Tree app to read full this article<
Correlations of the Changes of Tumor BF and FD in Tumor BF with PFS and OS
Get Radiology Tree app to read full this article<
Table 3
Correlation between Percent Changes of BF and FD and PFS
PFS ≤ 6 Months PFS > 6 Months_P_ ΔBF (%) −25.47 ± 30.79 −28.93 ± 15.06 .64 ΔFD (%) 3.72 ± 6.24 −2.51 ± 3.21.01
ΔBF, percent change of BF; ΔFD, percent change of FD in tumor BF; PFS, progression-free survival.
Get Radiology Tree app to read full this article<
Correlation between Baseline FD in Tumor BF and OS
Get Radiology Tree app to read full this article<
Get Radiology Tree app to read full this article<
Discussion
Get Radiology Tree app to read full this article<
Get Radiology Tree app to read full this article<
Get Radiology Tree app to read full this article<
Conclusions
Get Radiology Tree app to read full this article<
References
1. Ferlay J., Shin H.R., Bray F., et. al.: Estimates of worldwide burden of cancer in 2008: GLOBOCAN 2008. Int J Cancer 2010; 127: pp. 2893-2917.
2. Miura H., Miyazaki T., Kuroda M., et. al.: Increased expression of vascular endothelial growth factor in human hepatocellular carcinoma. J Hepatol 1997; 27: pp. 854-861.
3. Yamaguchi R., Yano H., Iemura A., et. al.: Expression of vascular endothelial growth factor in human hepatocellular carcinoma. Hepatology 1998; 28: pp. 68-77.
4. Zhu A.X., Duda D.G., Sahani D.V., et. al.: HCC and angiogenesis: possible targets and future directions. Nat Rev Clin Oncol 2011; 8: pp. 292-301.
5. Poon R.T., Ho J.W., Tong C.S., et. al.: Prognostic significance of serum vascular endothelial growth factor and endostatin in patients with hepatocellular carcinoma. Br J Surg 2004; 91: pp. 1354-1360.
6. Chao Y., Li C.P., Chau G.Y., et. al.: Prognostic significance of vascular endothelial growth factor, basic fibroblast growth factor, and angiogenin in patients with resectable hepatocellular carcinoma after surgery. Ann Surg Oncol 2003; 10: pp. 355-362.
7. Llovet J.M., Ricci S., Mazzaferro V., et. al.: Sorafenib in advanced hepatocellular carcinoma. N Engl J Med 2008; 359: pp. 378-390.
8. Muntane J., De la Rosa A.J., Docobo F., et. al.: Targeting tyrosine kinase receptors in hepatocellular carcinoma. Curr Cancer Drug Targets 2013; 13: pp. 300-312.
9. Therasse P., Arbuck S.G., Eisenhauer E.A., et. al.: New guidelines to evaluate the response to treatment in solid tumors. European Organization for Research and Treatment of Cancer, National Cancer Institute of the United States, National Cancer Institute of Canada. J Natl Cancer Inst 2000; 92: pp. 205-216.
10. Desar I.M., van Herpen C.M., van Laarhoven H.W., et. al.: Beyond RECIST: molecular and functional imaging techniques for evaluation of response to targeted therapy. Cancer Treat Rev 2009; 35: pp. 309-321.
11. Zhu A.X., Holalkere N.S., Muzikansky A., et. al.: Early antiangiogenic activity of bevacizumab evaluated by computed tomography perfusion scan in patients with advanced hepatocellular carcinoma. Oncologist 2008; 13: pp. 120-125.
12. Zhu A.X., Sahani D.V., Duda D.G., et. al.: Efficacy, safety, and potential biomarkers of sunitinib monotherapy in advanced hepatocellular carcinoma: a phase II study. J Clin Oncol 2009; 27: pp. 3027-3035.
13. Sahani D.V., Jiang T., Hayano K., et. al.: Magnetic resonance imaging biomarkers in hepatocellular carcinoma: association with response and circulating biomarkers after sunitinib therapy. J Hematol Oncol 2013; 6: pp. 51. 8722-6-51
14. Jain R.K., Duda D.G., Willett C.G., et. al.: Biomarkers of response and resistance to antiangiogenic therapy. Nat Rev Clin Oncol 2009; 6: pp. 327-338.
15. Jain R.K.: Normalizing tumor vasculature with anti-angiogenic therapy: a new paradigm for combination therapy. Nat Med 2001; 7: pp. 987-989.
16. Jain R.K.: Normalization of tumor vasculature: an emerging concept in antiangiogenic therapy. Science 2005; 307: pp. 58-62.
17. Goel S., Duda D.G., Xu L., et. al.: Normalization of the vasculature for treatment of cancer and other diseases. Physiol Rev 2011; 91: pp. 1071-1121.
18. Mandelbrot B.B.: The fractal geometry of nature.1982.W.H.Freeman and CompanyNew York
19. Kido S., Kuriyama K., Higashiyama M., et. al.: Fractal analysis of small peripheral pulmonary nodules in thin-section CT: evaluation of the lung-nodule interfaces. J Comput Assist Tomogr 2002; 26: pp. 573-578.
20. Huang Y.L., Chen J.H., Shen W.C.: Diagnosis of hepatic tumors with texture analysis in nonenhanced computed tomography images. Acad Radiol 2006; 13: pp. 713-720.
21. Hung S.H., Lin C.Y., Lee J.Y., et. al.: Computed tomography image characteristics of metastatic lymph nodes in patients with squamous cell carcinoma of the head and neck. Auris Nasus Larynx 2012; 39: pp. 606-610.
22. Cui C., Cai H., Liu L., et. al.: Quantitative analysis and prediction of regional lymph node status in rectal cancer based on computed tomography imaging. Eur Radiol 2011; 21: pp. 2318-2325.
23. Jiang T., Kambadakone A., Kulkarni N.M., et. al.: Monitoring response to antiangiogenic treatment and predicting outcomes in advanced hepatocellular carcinoma using image biomarkers, CT perfusion, tumor density, and tumor size (RECIST). Invest Radiol 2012; 47: pp. 11-17.
24. Zhu A.X., Blaszkowsky L.S., Ryan D.P., et. al.: Phase II study of gemcitabine and oxaliplatin in combination with bevacizumab in patients with advanced hepatocellular carcinoma. J Clin Oncol 2006; 24: pp. 1898-1903.
25. Zhu F., Carpenter T., Rodriguez Gonzalez D., et. al.: Computed tomography perfusion imaging denoising using gaussian process regression. Phys Med Biol 2012; 57: pp. N183-N198.
26. Ibanez L., Schroeder W., Ng L., et. al.: The ITK software guide.2003.Kitware Inc.Clifton Park, NY
27. St Lawrence K.S., Lee T.Y.: An adiabatic approximation to the tissue homogeneity model for water exchange in the brain: I. Theoretical derivation. J Cereb Blood Flow Metab 1998; 18: pp. 1365-1377.
28. Sahani D.V., Holalkere N.S., Mueller P.R., et. al.: Advanced hepatocellular carcinoma: CT perfusion of liver and tumor tissue—initial experience. Radiology 2007; 243: pp. 736-743.
29. Goh V., Liaw J., Bartram C.I., et. al.: Effect of temporal interval between scan acquisitions on quantitative vascular parameters in colorectal cancer: implications for helical volumetric perfusion CT techniques. AJR Am J Roentgenol 2008; 191: pp. W288-W292.
30. Leung D.W., Cachianes G., Kuang W.J., et. al.: Vascular endothelial growth factor is a secreted angiogenic mitogen. Science 1989; 246: pp. 1306-1309.
31. Gillies R.J., Schornack P.A., Secomb T.W., et. al.: Causes and effects of heterogeneous perfusion in tumors. Neoplasia 1999; 1: pp. 197-207.
32. Gullino P.M.: Tumor pathophysiology: the perfusion model. Antibiot Chemother 1980; 28: pp. 35-42.
33. Vaupel P., Kallinowski F., Okunieff P.: Blood flow, oxygen consumption and tissue oxygenation of human tumors. Adv Exp Med Biol 1990; 277: pp. 895-905.
34. Willett C.G., Boucher Y., di Tomaso E., et. al.: Direct evidence that the VEGF-specific antibody bevacizumab has antivascular effects in human rectal cancer. Nat Med 2004; 10: pp. 145-147.
35. Carmeliet P., Jain R.K.: Molecular mechanisms and clinical applications of angiogenesis. Nature 2011; 473: pp. 298-307.
36. Matsumoto S., Batra S., Saito K., et. al.: Antiangiogenic agent sunitinib transiently increases tumor oxygenation and suppresses cycling hypoxia. Cancer Res 2011; 71: pp. 6350-6359.
37. Hayano K., Shuto K., Koda K., et. al.: Quantitative measurement of blood flow using perfusion CT for assessing clinicopathologic features and prognosis in patients with rectal cancer. Dis Colon Rectum 2009; 52: pp. 1624-1629.
38. Goh V., Sanghera B., Wellsted D.M., et. al.: Assessment of the spatial pattern of colorectal tumour perfusion estimated at perfusion CT using two-dimensional fractal analysis. Eur Radiol 2009; 19: pp. 1358-1365.
39. Rose C.J., Mills S., O’Connor J.P., et. al.: Quantifying heterogeneity in dynamic contrast-enhanced MRI parameter maps. Med Image Comput Comput Assist Interv 2007; 10: pp. 376-384.
40. Agrawal G., Su M.Y., Nalcioglu O., et. al.: Significance of breast lesion descriptors in the ACR BI-RADS MRI lexicon. Cancer 2009; 115: pp. 1363-1380.
41. Rose C.J., Mills S.J., O’Connor J.P., et. al.: Quantifying spatial heterogeneity in dynamic contrast-enhanced MRI parameter maps. Magn Reson Med 2009; 62: pp. 488-499.