
Rationale and Objectives
To evaluate fractal-based computerized image analyses of mammographic parenchymal patterns in the task of differentiating between women at high risk and women at low risk for developing breast cancer.
Materials and Methods
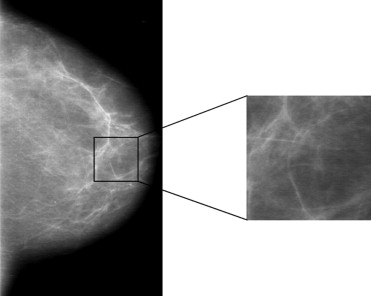
The fractal-based texture analyses are based on a box-counting method and a Minkowski dimension, and were performed within the parenchymal regions of normal mammograms. Four approaches were evaluated: 1) a conventional box-counting method, 2) a modified box-counting technique using linear discriminant analysis (LDA), 3) a global Minkowski dimension, and 4) a modified Minkowski technique using LDA. These fractal based texture features were extracted from regions of interest to assess the mammographic parenchymal patterns of the images. Receiver operating characteristic analysis was used to evaluate the performance of these features in the task of differentiating between the two groups of women.
Results
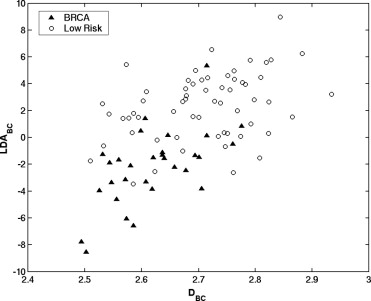
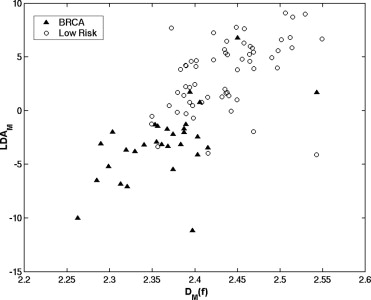
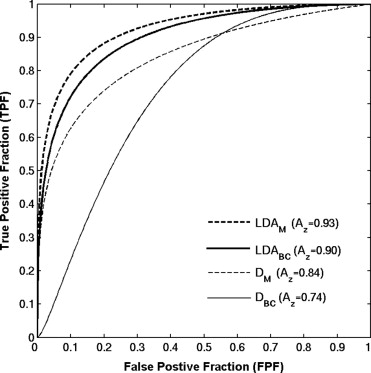
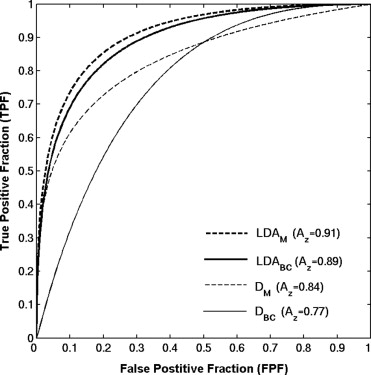
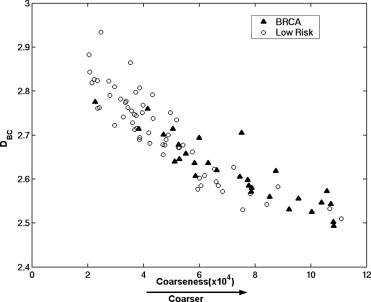
Receiver operating characteristic analysis yielded an A z value of 0.74 based on the conventional box-counting technique and an A z value of 0.84 based on the global Minkowski dimension in the task of distinguishing between the two groups. By using LDA to assess the characteristics of mammograms, A z values of 0.90 and 0.93 were obtained in differentiating the two groups, for the modified box-counting and Minkowski techniques, respectively. Statistically significant improvement was achieved ( P < .05) with the new techniques compared to the conventional fractal analysis methods. A simulation study, which used the slope and intercept extracted from the least square fit of the experimental data with the LDA approaches, yielded A z values similar to those obtained with the conventional approaches in the task of differentiating between the two groups.
Conclusions
The proposed LDA approach improved significantly the separation between the two groups based on experimental data. Because this approach was used as a linear classifier rather than as a regression function, it combined the fractal analysis with the knowledge of the high- and low-risk patterns, and thus better characterized the multifractal nature of the parenchymal patterns. We believe that the proposed analyses based on the LDA technique to characterize mammographic parenchymal patterns may potentially yield radiographic markers for assessing breast cancer risk.
Breast cancer is the most frequently diagnosed non–skin cancer and the second leading cause of death among women living in North America. An estimated 212,920 new invasive cases, 61,980 new noninvasive cases, and 40,970 deaths are anticipated from breast cancer for the year 2006 in the United States ( ). Several studies show that mammography is the most valuable imaging technique for early detection of breast cancer ( ). The decrease in breast cancer mortality has been largely attributed to the regular use of screening mammography ( ). In addition, women who inherit susceptibility genes, BRCA1 or BRCA2, face a 35%–87% lifetime risk of developing breast cancer ( ). These deleteriously mutated genes account for approximately 5%–10% of all breast cancer cases ( ). Correct and precise estimates of cancer risks associated with these gene mutation carriers are expected to be relevant to screening, early cancer detection, chemoprevention, and risk reduction surgery.
Mammographic parenchymal patterns have been extensively studied for several decades. Visual assessment of such patterns has been performed using Wolfe patterns, which classify the mammographic parenchyma into N1, P1, P2, and DY categories according to the relationship between the prominent duct pattern and breast cancer risk ( ). Breast Imaging Reporting and Data System notation has also been recommended by the American College of Radiology to relate breast density with risk ( ). Because of large variability in the visual assessment in risk estimation, semiquantitative, and quantitative methods have been introduced to characterize mammographic density and their association with breast cancer risks ( ). Computerized texture features that are used to quantify the density and texture of the breast have been also investigated and related to the breast cancer risk ( ). Such studies have shown that there is an increased risk of developing breast cancer associated with increased mammographic density ( ).
Get Radiology Tree app to read full this article<
Materials and methods
Database
Get Radiology Tree app to read full this article<
Get Radiology Tree app to read full this article<
Get Radiology Tree app to read full this article<
Get Radiology Tree app to read full this article<
Get Radiology Tree app to read full this article<
Get Radiology Tree app to read full this article<
Fractal-Based Computer-Extracted Features
Get Radiology Tree app to read full this article<
Get Radiology Tree app to read full this article<
Get Radiology Tree app to read full this article<
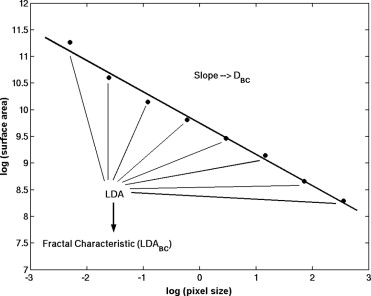
DBC=2−limε→0log[A(ε)]log[ε], D
B
C
=
2
−
lim
ε
→
0
log
[
A
(
ε
)
]
log
[
ε
]
,
where A ( ε ) is the surface area of the ROI at effective pixel size ε and is calculated using equation ( 2 ), where i ε ( x,y ) is the gray level at location ( x,y ) in a digitized image.
A(ε)=∑x,yε2+∑x,yε(|iε(x,y)−iε(x,y+1)|+|iε(x,y)−iε(x+1,y)|). A
(
ε
)
=
∑
x
,
y
ε
2
+
∑
x
,
y
ε
(
|
i
ε
(
x
,
y
)
−
i
ε
(
x
,
y
+
1
)
|
+
|
i
ε
(
x
,
y
)
−
i
ε
(
x
+
1
,
y
)
|
)
.
Get Radiology Tree app to read full this article<
Get Radiology Tree app to read full this article<
Get Radiology Tree app to read full this article<
Get Radiology Tree app to read full this article<
Get Radiology Tree app to read full this article<
Get Radiology Tree app to read full this article<
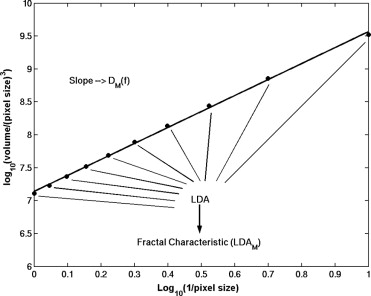
DM(f)=limr→0log[Vg(r)/r3]log[1/r], D
M
(
f
)
=
lim
r
→
0
log
[
V
g
(
r
)
/
r
3
]
log
[
1
/
r
]
,
where V g ( r ) is the “volume” between two processed versions of the ROI image f using morphologic operators at scale r . The volume V g ( r ) is computed by
Get Radiology Tree app to read full this article<
Get Radiology Tree app to read full this article<
Vg(r)=∑256i=1∑256j=1{(f⊕rg)−(f⊗rg)}, V
g
(
r
)
=
∑
i
=
1
256
∑
j
=
1
256
{
(
f
⊕
r
g
)
−
(
f
⊗
r
g
)
}
,
where ( f⊕ rg ) and ( f⊗ rg ) are the dilated version and the eroded version, respectively, of the image obtained using a structuring element g at scale r ( ). A square structuring element of 3 × 3 pixels and r values between 0.1 mm and 1.0 mm were used in this study.
Get Radiology Tree app to read full this article<
Get Radiology Tree app to read full this article<
Get Radiology Tree app to read full this article<
Get Radiology Tree app to read full this article<
Performance Evaluation and Statistical Analysis
Get Radiology Tree app to read full this article<
Results
Correlation Between the Fractal-Based Features
Get Radiology Tree app to read full this article<
Get Radiology Tree app to read full this article<
Performance of the Fractal-Based Features
Get Radiology Tree app to read full this article<
Table 1
Performance of Fractal-Based Computer-Extracted Features in Differentiating Between BRCA1/BRCA2 Gene-Mutation Carriers and Low-Risk Cases in Terms of A z

LDA: linear discriminant analysis.
\* P value is calculated with Z -score test and used to indicate the significance of the difference in terms of A z between fractal feature extracted using the conventional method and fractal feature extracted using the LDA method.
Get Radiology Tree app to read full this article<
Get Radiology Tree app to read full this article<
Get Radiology Tree app to read full this article<
Get Radiology Tree app to read full this article<
Get Radiology Tree app to read full this article<
Get Radiology Tree app to read full this article<
Discussion
Get Radiology Tree app to read full this article<
Get Radiology Tree app to read full this article<
Get Radiology Tree app to read full this article<
Table 2
Performance of Fractal-Based Computer-Extracted Features in Differentiating Between BRCA1/BRCA2 Gene-Mutation Carriers and Low-Risk Cases in Terms of A z with Both Experimental and Simulation Data

LDA: linear discriminant analysis.
\* P value is calculated with Z -score test and used to indicate the significance of the difference in terms of A z between fractal feature extracted using the conventional method and fractal feature extracted using the LDA method.
Bold face type indicates results were generated using simulation data.
Get Radiology Tree app to read full this article<
Get Radiology Tree app to read full this article<
Conclusion
Get Radiology Tree app to read full this article<
Acknowledgments
Get Radiology Tree app to read full this article<
Get Radiology Tree app to read full this article<
References
1. American Cancer Society. Cancer facts & figures–2006. New York: American Cancer Society.
2. Clay M.G., Hishop G., Kan L., et. al.: Screening mammography in British Columbia 1988–1993. Am J Surg 1994; 167: pp. 490-492.
3. Fletcher S.W., Black W., Harris R., et. al.: Report of the international workshop on screening for breast cancer. J Natl Cancer Inst 1993; 85: pp. 1644-1656.
4. Kopans D.B.: The most recent breast cancer screening controversy about whether mammographic screening benefits women at any age: nonsense and nonscience. Am J Roentgenol 2003; 180: pp. 21-26.
5. Tabar L., Vitak B., Tony H.H., et. al.: Beyond randomized controlled trials: organized mammographic screening substantially reduces breast carcinoma mortality. Cancer 2001; 91: pp. 1724-1731.
6. Kopans D.B.: Beyond randomized, controlled trials: organized mammographic screening substantially reduces breast carcinoma mortality. Cancer 2002; 94: pp. 580-581.
7. Smith R.A.: Screening women aged 40–49: where are we today?. J Natl Cancer Inst 1995; 87: pp. 1198-1200.
8. Euhus D.M., Smith K.C., Robinson L., et. al.: Pretest prediction of BRCA1 or BRCA2 mutation by risk counselors and the computer model BRCAPRO. J Natl Cancer Inst 2002; 94: pp. 844-851.
9. Thompson D., Easton D.F.: Cancer incidence in BRCA1 mutation carriers. J Natl Cancer Inst 2002; 94: pp. 1358-1365.
10. Brose M.S., Rebbeck T.R., Calzone K.A., et. al.: Cancer risk estimates for BRCA1 mutation carriers identified in a risk evaluation program. J Natl Cancer Inst 2002; 94: pp. 1365-1372.
11. Guillem J.G., Wood W.C., Moley J.F., et. al.: ASCO/SSO reviews of current role of risk-reducing surgery in common hereditary cancer syndromes. J Clin Oncol 2006; 24: pp. 4642-4660.
12. Wolfe J.N.: Breast patterns as an index of risk for developing breast cancer. Am J Roentgenol 1976; 126: pp. 1130-1139.
13. Brisson J., Verreault R., Morrison A.S., et. al.: Diet, mammographic features of breast tissue, and breast cancer risk. Am J Epidemiol 1989; 130: pp. 14-24.
14. Saftlas A.F., Hoover R.N., Brinton L.A., et. al.: Mammographic densities and risk of breast cancer. Cancer 1991; 67: pp. 2833-2838.
15. Boyd N.F., O’Sullivan B., Campbell J.E., et. al.: Mammographic patterns and bias in breast cancer detection. Radiology 1982; 143: pp. 671-674.
16. Boyd N.F., O’Sullivan B., Fishell E., et. al.: Mammographic patterns and breast cancer risk: methodologic standards and contradictory results. J Natl Cancer Inst 1984; 72: pp. 1253-1259.
17. Beam C.A., Conant E.F., Sickles E.A.: Factors affecting radiologist inconsistency in screening mammography. Acad Radiol 2002; 9: pp. 531-540.
18. American College of Radiology: ed. 31998.American College of RadiologyReston, Va
19. Byng J.W., Yaffe M.J., Lockwood G.A., et. al.: Automated analysis of mammographic densities and breast carcinoma risk. Cancer 1997; 80: pp. 66-74.
20. Yaffe M.J., Boyd N.F., Byng J.W., et. al.: Breast cancer risk and measured mammographic density. European J Cancer Prev 1998; 7: pp. S47-S55.
21. Heine J.J., Velthuizen R.P.: A statistical methodology for mammographic density detection. Med Phys 2000; 27: pp. 2644-2651.
22. Zhou C., Chan H.P., Petrick N., et. al.: Computerized image analysis: estimation of breast density on mammograms. Med Phys 2001; 28: pp. 1056-1069.
23. Wang X.H., Good W.F., Chapman B.E., et. al.: Automated assessment of the composition of breast tissue revealed on tissue-thickness-corrected mammography. Am J Roentgenol 2003; 180: pp. 257-262.
24. Saha P.K., Udupa J.K., Conant E.F., et. al.: Breast tissue density quantification via digitized mammograms. IEEE Trans Med Imag 2001; 20: pp. 792-803.
25. Kaufhold J., Thomas J.A., Eberhard J.W., et. al.: A calibration approach to glandular tissue composition estimation in digital mammography. Med Phys 2002; 29: pp. 1867-1880.
26. Huo Z., Giger M.L., Wolverton D.E., et. al.: Computerized analysis of mammographic parenchymal patterns for breast cancer risk assessment: feature selection. Med Phys 2000; 27: pp. 4-12.
27. Huo Z., Giger M.L., Olopade O.I., et. al.: Computerized analysis of digitized mammograms of BRCA1 and BRCA2 gene mutation carriers. Radiology 2002; 225: pp. 519-526.
28. Magnin I.E., Cluzeau F., Odet C.L.: Mammographic texture analysis: an evaluation of risk for developing breast cancer. Opt Eng 1986; 25: pp. 780-784.
29. Taylor P., Hajnal S., Dilhuydy M.H., et. al.: Measuring image texture to separate “difficult” from “easy” mammograms. Br J Radiol 1994; 67: pp. 456-463.
30. Tahoces P.G., Correa J., Souto M., et. al.: Computer-assisted diagnosis: the classification of mammographic breast parenchymal patterns. Phys Med Biol 1995; 40: pp. 103-117.
31. Heine J.J., Malhotra P.: Mammographic tissue, breast cancer risk, serial image analysis, and digital mammography. Acad Radiol 2002; 9: pp. 298-316.
32. Boyd N.F., Lockwood G.A., Byng J.W., et. al.: Mammographic densities and breast cancer risk. Cancer Epidemiol Biomarkers Prev 1998; 7: pp. 113-1144.
33. Byrne C., Schairer C., Wolfe J., et. al.: Mammographic features and breast cancer risk: effects with time, age, and menopause status. J Natl Cancer Inst 1995; 87: pp. 1622-1629.
34. Maragos P.W.: Fractal signal analysis using mathematical morphology.Hawkes P.W.1994.Harcourt Brace and CompanyNY, NY Academic Press:pp. 199-246.
35. Barnsley M.F., Devancy Rl, Mandelbrot B.B.: 1988.Springer-VerlagNew York
36. Caldwell C.B., Stapleton S.J., Holdsworth D.W., et. al.: Characterization of mammographic parenchymal pattern by fractal dimension. Phys Med Biol 1990; 35: pp. 235-247.
37. Vittitoe N.F., Baker J.A., Floyd C.E.: Fractal texture analysis in computer-aided diagnosis of solitary pulmonary nodules. Acad Radiol 1994; 4: pp. 96-101.
38. Caligiuri P., Giger M.L., Favus M.: Multifractal radiographic analysis of osteoporosis. Med Phys 1994; 21: pp. 503-508.
39. Jiang C., Giger M.L., Chinander M.R., et. al.: Characterization of bone quality using computer-extracted radiographic features. Med Phys 1999; 26: pp. 872-879.
40. Eagiar A.N., Naguib R.N.G., Sharif B.S., et. al.: Fractal analysis in the detection of colonic cancer images. IEEE Trans Info Tech Biomed 2002; 6: pp. 54-58.
41. Rybaczuk M., Kedzia A., Paradowski L.: Fractal characteristics of brain vessel microangioarchitecture during the fetal period. Med Sci Monit 2002; 8: pp. 145-152.
42. Horng M.H., Sun Y.N., Lin X.Z.: Texture feature coding method for classification of liver sonography. Comput Med Imag Graph 2002; 26: pp. 33-42.
43. Soille P., Rivest J.F.: On the validity of fractal dimension measurements in image analysis. J Visual Commun Image Representation 1996; 7: pp. 217-229.
44. Veenland J.F., Grashuis J.L., van der Meer F., et. al.: Estimation of fractal dimension in radiographs. Med Phys 1996; 23: pp. 585-594.
45. Gail M.H., Brinton L.A., Byar D.P., et. al.: Projecting individualized probabilities of developing breast cancer for white females who are being examined annually. J Natl Cancer Inst 1989; 81: pp. 1879-1886.
46. Gail M.H., Costantino J.P.: Validating and improving models for projecting the absolute risk of breast cancer. J Natl Cancer Inst 2001; 93: pp. 334-335.
47. Li H., Giger M.L., Huo Z., et. al.: Computerized analysis of mammographic parenchymal patterns for assessing breast cancer risk: effect of ROI size and location. Med Phys 2004; 31: pp. 549-555.
48. Penn A.I., Loew M.H.: Estimating fractal dimension with fractal interpolation function models. IEEE Trans Med Imag 1997; 16: pp. 930-937.
49. Huberty C.J.: 1994.John Wiley & Sons
50. Lachenbruch P.A.: 1975.Hafner PressNY, New York
51. Metz C.E.: ROC methodology in radiologic imaging. Invest Radiol 1986; 21: pp. 720-733.
52. Metz C.E.: Some practical issues of experimental design and data analysis in radiological ROC studies. Invest Radiol 1989; 24: pp. 234-245.
53. Metz C.E., Herman B.A., Shen J.: Maximum-likelihood estimation of receiver operating characteristic (ROC) curves from continuously-distributed data. Stat Med 1998; 17: pp. 1033-1053.
54. Lachenbruch P.A., Mickey M.R.: Estimation of error rates in discriminant analysis. Technometrics 1968; 10: pp. 1-11.
55. Metz C.E., Herman B.A., Roe C.A.: Statistical comparison of two ROC-curve estimates obtained from partially-paired datasets. Med Decis Making 1998; 18: pp. 110-121.
56. Byng J.W., Boyd N.F., Fishell E., et. al.: Automated analysis of mammographic densities. Phys Med Biol 1996; 41: pp. 909-923.