
Rationale and Objectives
We have conducted a fractal analysis of low-dose digital chest phantom radiographs and evaluated the relationship between the fractal-feature distance and the tube current-exposure time product.
Materials and Methods
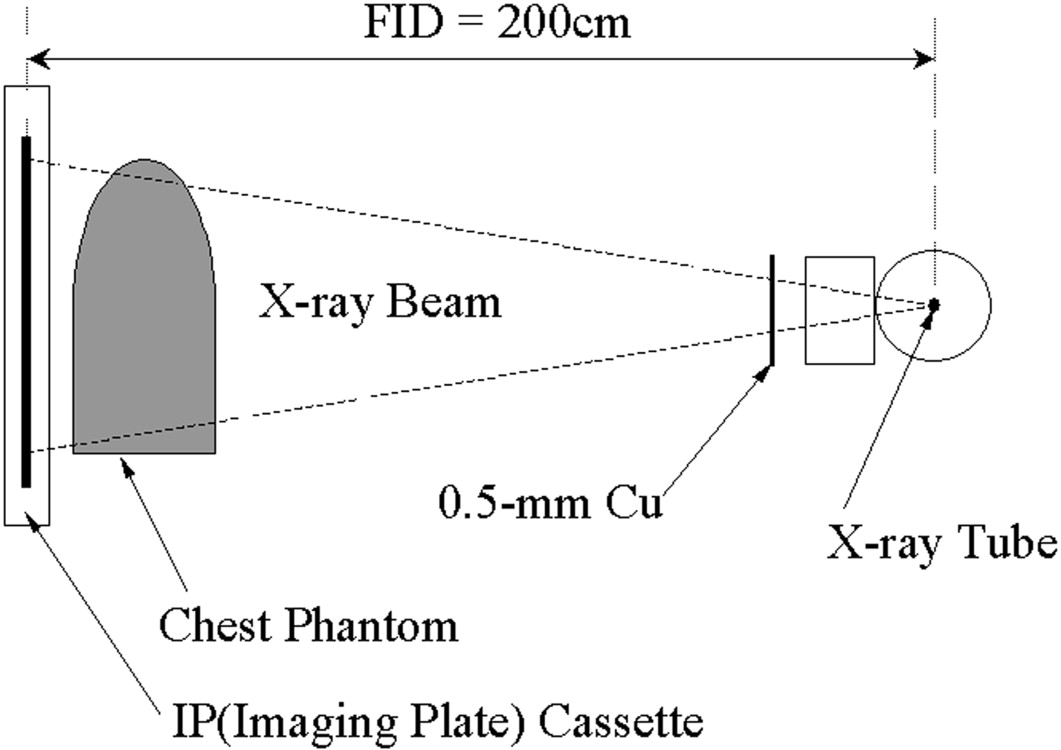
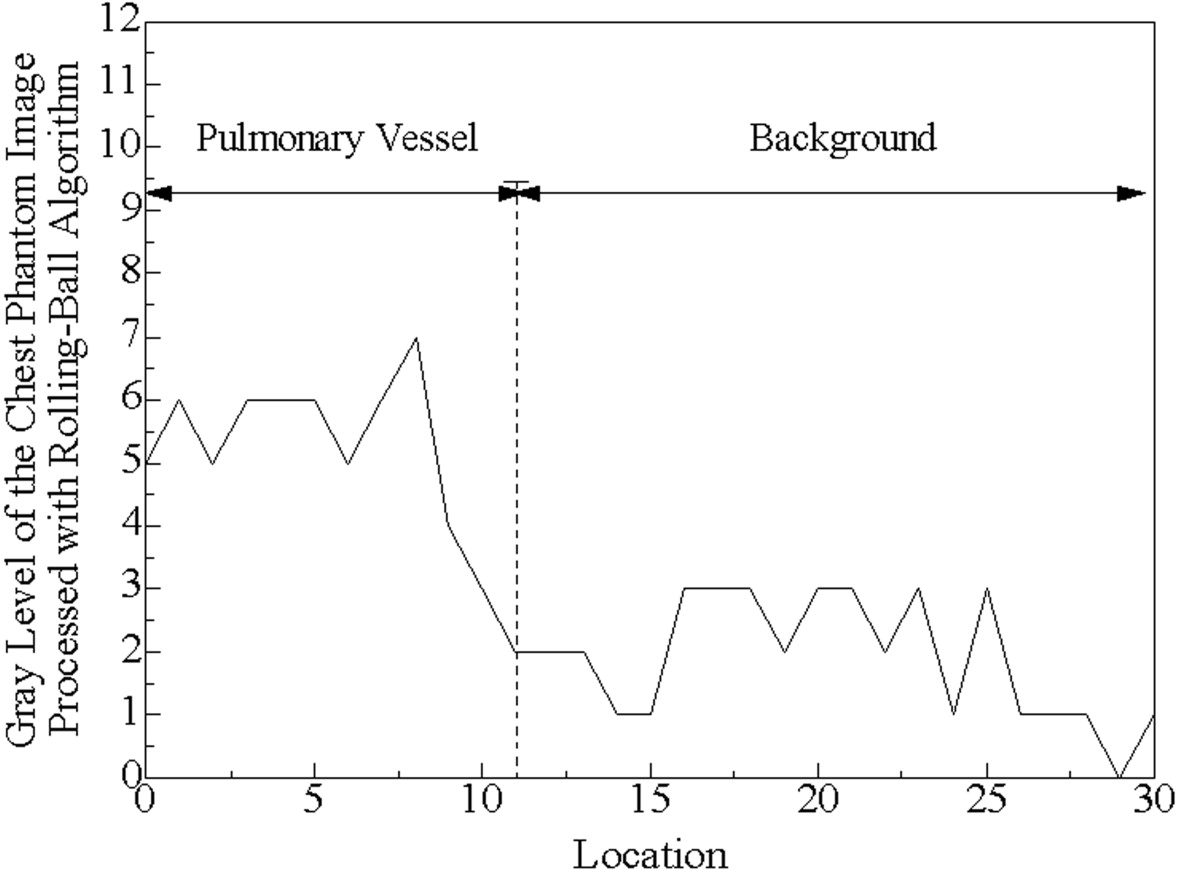
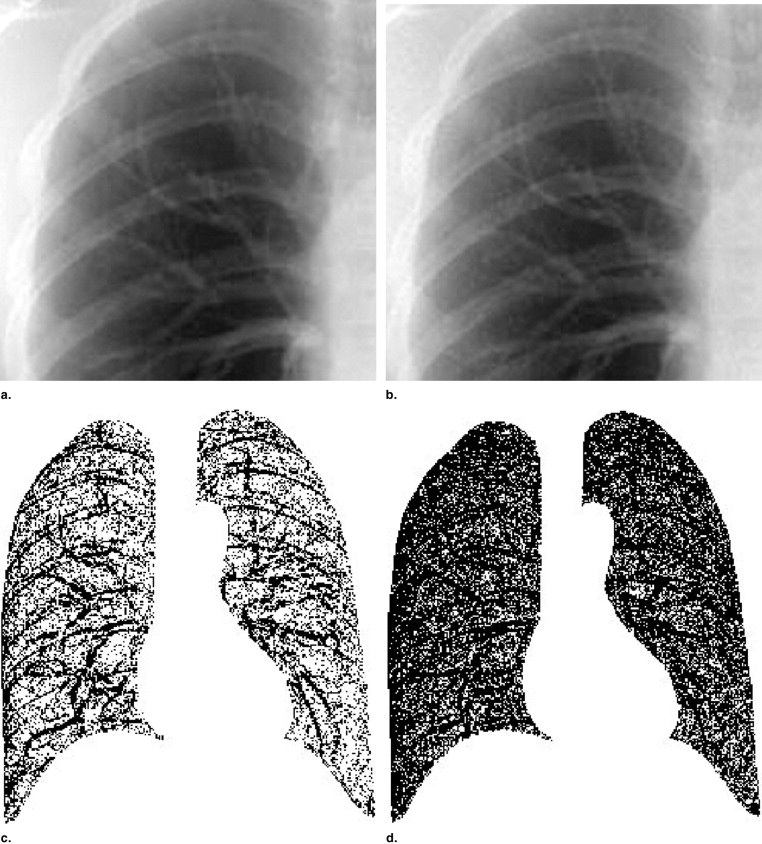
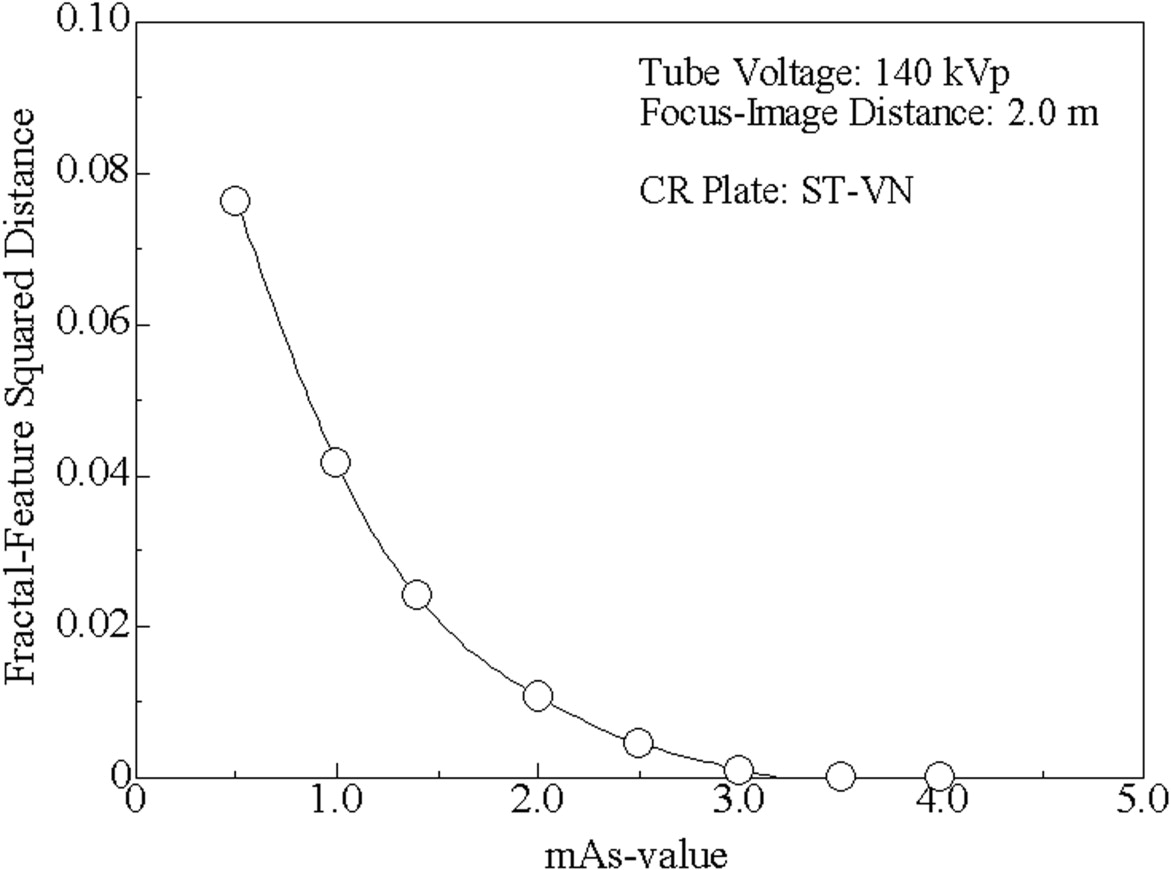
Chest phantom radiographs were obtained at various mAs values (0.5–4.0 mAs) and 140 kVp with a computed radiography system, and the reference images were acquired at 13 mAs. The lung field images were converted to binary images after processing them using the rolling-ball technique; a fractal analysis was conducted using the box-counting method for these binary images. The fractal-feature distances between the low-dose and reference images were calculated using the fractal dimension and the complexity.
Results
For all binary images of lung fields, the relationship between the length of the square boxes and the number of boxes needed to cover the positive pixels of the binary image was linear on a log-log scale ( r ≥ 0.99). For mAs ≥ 3.0, the fractal-feature distances were almost constant, whereas for mAs ≤ 2.5, they increased depending on the reduction in mAs values.
Conclusion
We have shown that a binary image of the lung field obtained from a chest phantom radiograph can be analyzed by the box-counting method and that its fractal-feature distance grows as the radiation dose declines.
Since digital technology has been introduced into medical images, a variety of digital imaging modalities have been developed. Types of digital radiography such as computed radiography (CR) and flat-panel digital radiography provide a wide-exposure latitude and high-contrast resolution compared with conventional screen-film radiography; moreover, their contrast, exposure latitude, and optical density can be controlled over a wide range of radiation exposure doses. These systems still have the potential to allow even further reductions in radiation dosage for patients; a dose-reduction level that provides a satisfactory diagnostic image has been investigated intensively ( ).
In general, evaluations of medical-image quality are performed based on measurements of physical indices such as signal-to-noise ratio ( ) and detective quantum efficiency ( ) and are confirmed by observer performance studies such as receiver operating characteristics (ROC) ( ) and contrast-detail (C-D) analysis ( ). However, because human observer studies are so time consuming to perform, many have attempted to determine the physical indices that would be equivalent to the observer performance index [such as area under the ROC curve in ROC analysis ( ) and image quality figure in C-D analysis ( )] or to produce a model observer that emulates human performance ( ). However, the results of these attempts have proved controversial.
Get Radiology Tree app to read full this article<
Get Radiology Tree app to read full this article<
Get Radiology Tree app to read full this article<
Materials and methods
Digital Chest Phantom Radiography Acquisition
Get Radiology Tree app to read full this article<
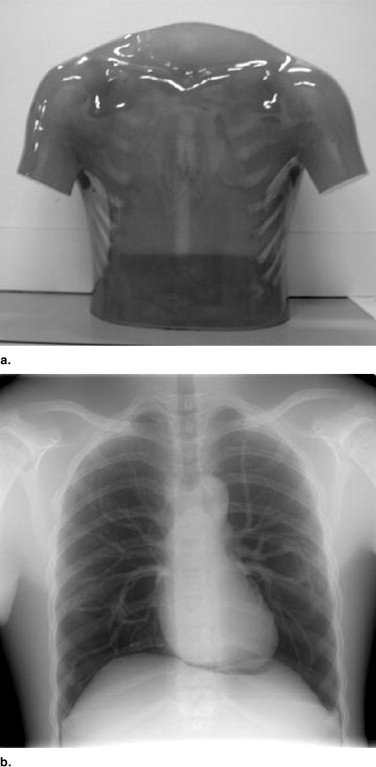
Table 1
Parameters for image processing of chest and C-D phantoms
0.5 mAs 1.0 mAs 1.4 mAs 2.0 mAs 2.5 mAs 3.0 mAs 3.5 mAs 4.0 mAs S-value 1787 1052 817 620 540 459 400 400 L-value 1.60 1.60 1.61 1.61 1.61 1.61 1.61 1.61
Get Radiology Tree app to read full this article<
Fractal Analysis and Fractal-Feature Distance
Get Radiology Tree app to read full this article<
Get Radiology Tree app to read full this article<
Get Radiology Tree app to read full this article<
Get Radiology Tree app to read full this article<
Get Radiology Tree app to read full this article<
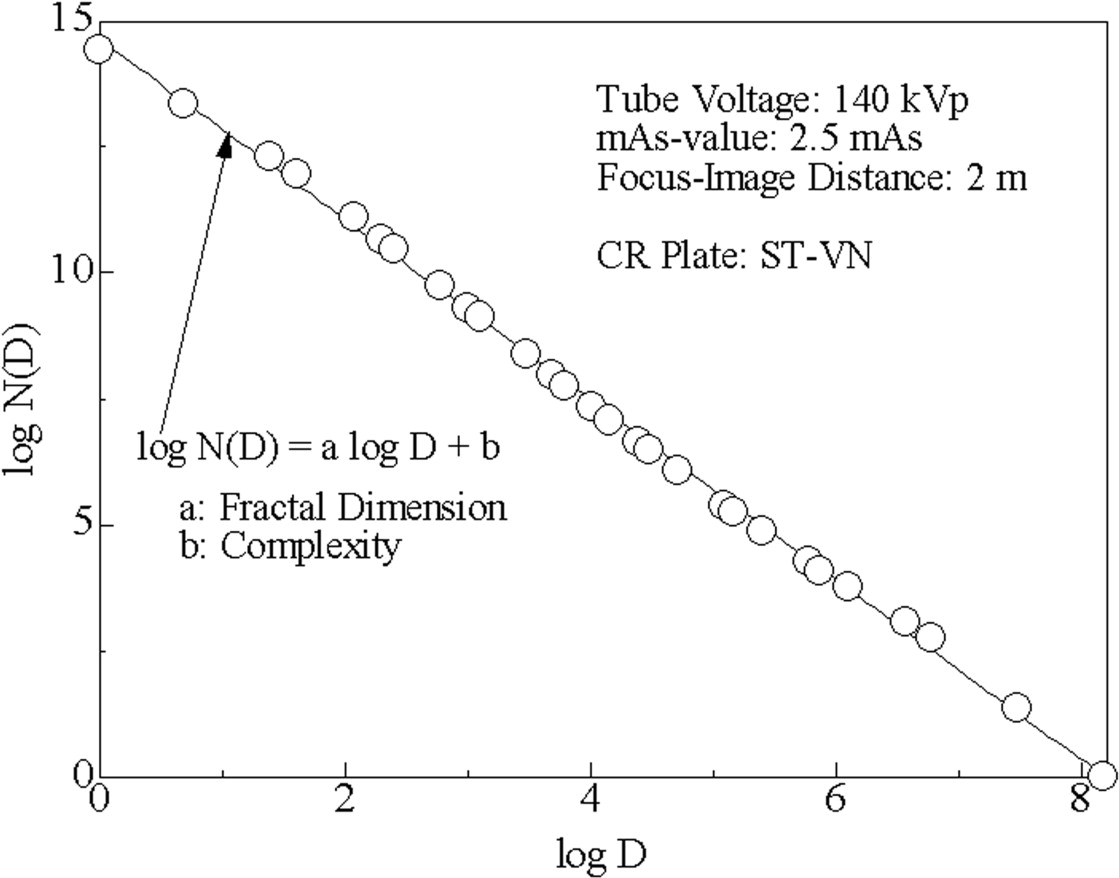
N(D)=μD−a, N
(
D
)
=
μD
−
a
,
where μ and a are constants, and a is called a fractal dimension. The relation between N ( D ) and D is linear on a log-log scale; that is, log 10 N ( D ) = – a log 10 D + log 10 μ .
Get Radiology Tree app to read full this article<
Get Radiology Tree app to read full this article<
d=(a−aref)2+(log10μ−log10μref)2−−−−−−−−−−−−−−−−−−−−−−−−−−√ d
=
(
a
−
a
ref
)
2
+
(
log
10
μ
−
log
10
μ
ref
)
2
The fractal-feature distance will show the similarity of image textures between the considered and reference images from a fractal analysis viewpoint, and the longer the fractal-feature distance, the greater is the difference between these two image textures. Given that all images were acquired from the same chest phantom, the difference in the fractal-feature distance must have originated from image degradation mainly due to a reduction in the exposure dose.
Get Radiology Tree app to read full this article<
Get Radiology Tree app to read full this article<
Results
Get Radiology Tree app to read full this article<
Get Radiology Tree app to read full this article<
Get Radiology Tree app to read full this article<
Get Radiology Tree app to read full this article<
Get Radiology Tree app to read full this article<
Get Radiology Tree app to read full this article<
Discussion
Get Radiology Tree app to read full this article<
Get Radiology Tree app to read full this article<
Get Radiology Tree app to read full this article<
Get Radiology Tree app to read full this article<
Get Radiology Tree app to read full this article<
References
1. Rapp-Bernhardt U., Roehl F.W., Gibbs R.C., Schmidl H., Krause U.W., Bernhardt T.M.: Flat-panel x-ray detector based on amorphous silicon versus asymmetric screen-film system: Phantom study of dose reduction and depiction of simulated findings. Radiology 2003; 227: pp. 484-492.
2. Strotzer M., Völk M., Frund R., Hamer O., Zorger N., Feuerbach S.: Routine chest radiography using a flat-panel detector: Image quality at standard detector dose and 33% dose reduction. AJR Am J Roentgenol 2002; 178: pp. 169-171.
3. van Heesewijk H.P.M., van der Graaf Y., de Valois J.C., Feldberg M.A.M.: Effects of dose reduction on digital chest imaging using a selenium detector: A study of detecting simulated diffuse interstitial pulmonary disease. AJR Am J Roentgenol 1996; 167: pp. 403-408.
4. Völk M., Hamer O.W., Feuerbach S., Strotzer M.: Dose reduction in skeletal and chest radiography using a large-area flat-panel detector based on amorphous silicon and thallium-doped cesium iodide: Technical background, basic image quality parameters, and review of the literature. Eur Radiol 2004; 14: pp. 827-834.
5. Chotas H.G., Floyd C.E., Dobbins J.T., Ravin C.E.: Digital chest radiography with photostimulable storage phosphors: Signal-to-noise ratio as a function of kilovoltage with matched exposure risk. Radiology 1993; 186: pp. 395-398.
6. Schaefer C.M., Greene R., Llewellyn H.J., et. al.: Interstitial lung disease: Impact of postprocessing in digital storage phosphor imaging. Radiology 1991; 178: pp. 733-738.
7. Sund P., Båth M., Kheddache S., Månsson L.G.: Comparison of visual grading analysis and determination of detective quantum efficiency for evaluating system performance in digital chest radiography. Eur Radiol 2004; 14: pp. 48-58.
8. Hillen W., Schiebel U., Zaengel T.: Imaging performance of a digital storage phosphor system. Med Phys 1987; 14: pp. 744-751.
9. Strotzer M., Völk M., Wild T., von Landenberg P., Feuerbach S.: Simulated bone erosions in a hand phantom: Detection with conventional screen-film technology versus cesium iodide-amorphous silicon flat-panel detector. Radiology 2000; 215: pp. 512-515.
10. Fischbach F., Ricke J., Freund T., et. al.: Flat panel digital radiography compared with storage phosphor computed radiography: Assessment of dose versus image quality in phantom studies. Invest Radiol 2002; 37: pp. 609-614.
11. Suryanarayanan S., Karellas A., Vedantham S., Ved H., Baker S.P., D’Orsi C.J.: Flat-panel digital mammography system: Contrast-detail comparison between screen-film radiographs and hard-copy images. Radiology 2002; 225: pp. 801-807.
12. Bacher K., Smeets P., Bonnarens K., De Hauwere A., Verstraete K., Thierens H.: Dose reduction in patients undergoing chest imaging: Digital amorphous silicon flat-panel detector radiography versus conventional film-screen radiography and phosphor-based computed radiography. AJR Am J Roentgenol 2003; 181: pp. 923-929.
13. Hanley J.A., McNeil B.J.: The meaning and use of the area under a receiver operating characteristic (ROC) curve. Radiology 1982; 143: pp. 29-36.
14. Thijssen M.A., Thijssen H.O., Merx J.L., van Woensel M.P.: Quality analysis of DSA equipment. Neuroradiology 1988; 30: pp. 561-568.
15. Revesz G.: Conspicuity and uncertainty in the radiographic detection of lesions. Radiology 1985; 154: pp. 625-628.
16. Kundel H.L., Revesz G.: Lesion conspicuity, structured noise, and film reader error. AJR Am J Roentgenol 1976; 126: pp. 1233-1238.
17. Burgess A.E., Wagner R.F., Jennings R.J., Barlow H.B.: Efficiency of human visual signal discrimination. Science 1981; 214: pp. 93-94.
18. Khurd P., Gindi G.: LROC model observers for emission tomographic reconstruction. Proc SPIE Med Imaging 2004; 5372: pp. 509-520.
19. Pentland A.P.: Fractal-based description of natural scenes. IEEE Trans Pattern Analysis Machine Intelligence 1984; pp. 661-674. PAMI-6
20. Mandelbrot B.B.: 1977.WH Freeman and CompanyNew York
21. Floyd C.E., Patz E.F., Lo J.Y., Vittitoe N.F., Stambaugh L.E.: Diffuse nodular lung disease on chest radiographs: A pilot study of characterization by fractal dimension. AJR Am J Roentgenol 1996; 167: pp. 1185-1187.
22. Mochizuki T., Fujii M., Takayuki I.: Image retrieval using a new fractal feature and robust structural information [in Japanese]. ITE 2003; 57: pp. 719-728.
23. Carvalho L.M.V., Silva Dias M.A.F.: An application of fractal box dimension to recognition of mesoscale cloud patterns in infrared satellite images. J Appl Meteorology 1998; 37: pp. 1265-1282.
24. Sternberg S.: Grayscale morphology. Comput Vision Graphics Image Process 1986; 35: pp. 333-355.