
Rationale and Objectives
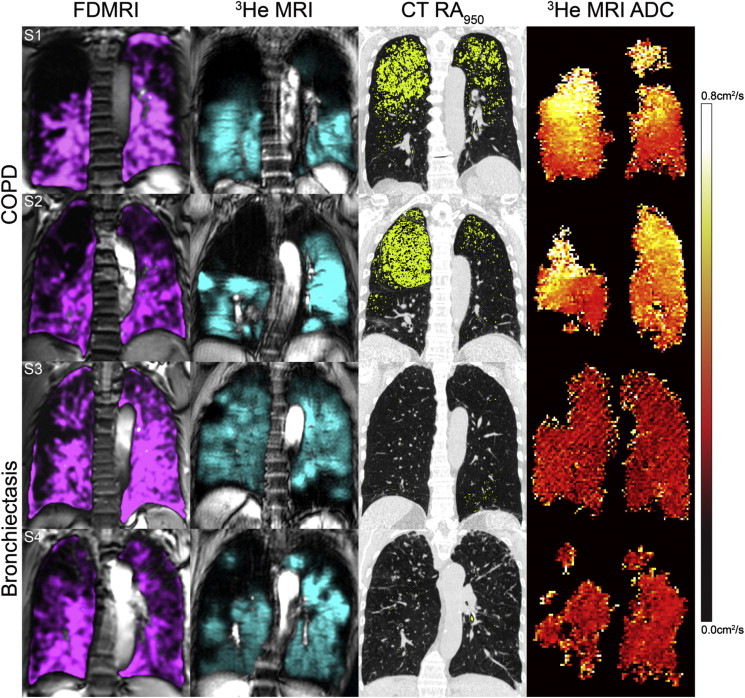
In this proof-of-concept demonstration, we aimed to quantitatively and qualitatively compare pulmonary ventilation abnormalities derived from Fourier decomposition of free-breathing 1 H magnetic resonance imaging (FDMRI) to hyperpolarized 3 He MRI in subjects with chronic obstructive pulmonary disease (COPD) and bronchiectasis.
Materials and Methods
All subjects provided written informed consent to a protocol approved by a local research ethics board and Health, Canada, and they underwent MRI, computed tomography (CT), spirometry, and plethysmography during a single 2-hour visit. Semiautomated segmentation was used to generate ventilation defect measurements derived from FDMRI and 3 He MRI, and these were compared using analysis of variance and Pearson correlations.
Results
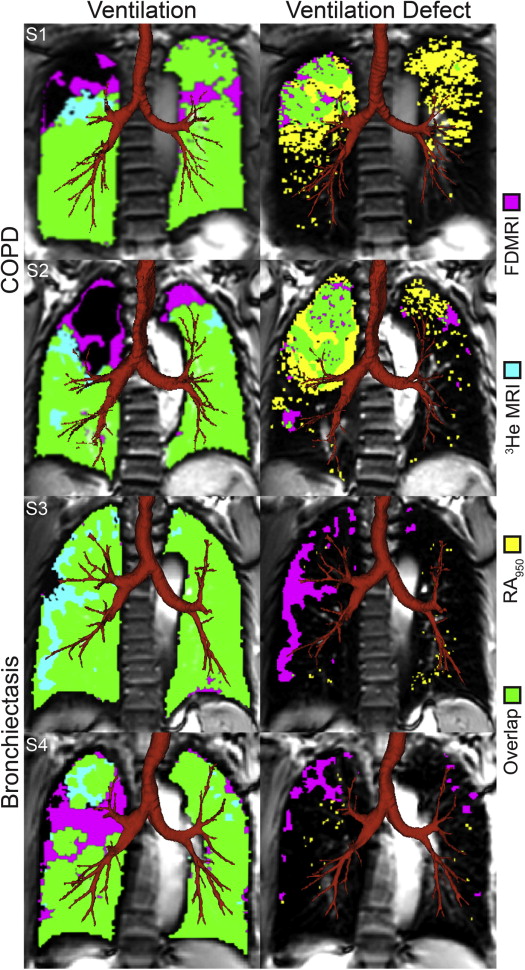
Twenty-six subjects were evaluated including 12 COPD subjects (67 ± 9 years) and 14 bronchiectasis subjects (70 ± 11 years). For COPD subjects, FDMRI and 3 He MRI ventilation defect percent (VDP) was 7 ± 6% and 24 ± 14%, respectively ( P < .001; bias = −16 ± 9%). In COPD subjects, FDMRI was significantly correlated with 3 He MRI VDP (r = .88; P = .0001), 3 He MRI apparent diffusion coefficient (r = .71; P < .05), airways resistance (r = .60; P < .05), and RA 950 (r = .80; P < .01). In subjects with bronchiectasis, FDMRI VDP (5 ± 3%) and 3 He MRI VDP (18 ± 9%) were significantly different ( P < .001) and not correlated ( P > .05). The Dice similarity coefficient (DSC) for FDMRI and 3 He MRI ventilation was 86 ± 7% for COPD and 86 ± 4% for bronchiectasis subjects ( P > .05); the DSC for FDMRI ventilation defects and CT RA 950 was 19 ± 20% in COPD and 2 ± 3% in bronchiectasis subjects ( P < .01).
Conclusions
FDMRI and 3 He MRI VDP were strongly related in COPD but not in bronchiectasis subjects. In COPD only, FDMRI ventilation defects were spatially related with 3 He ventilation defects and emphysema.
Chronic obstructive pulmonary disease (COPD) is diagnosed and disease severity stratified based on irreversible airflow obstruction measured using spirometry. Airflow obstruction, symptoms, and exercise capacity measurements in COPD are related to both parenchyma destruction (emphysema) and airway remodeling (airways disease and bronchiectasis) . Although spirometry is relatively easy to implement, reproducible, and inexpensive, it can only provide a global measure of lung function and is weakly predictive of COPD progression, as well as insensitive to early disease stages . The limitations of spirometry measurements of COPD have motivated the development of thoracic imaging approaches to provide direct and regional measurements of the underlying pathologic features of COPD—airways disease and emphysema.
High-resolution computed tomography is the clinical imaging tool of choice for visualizing and quantifying airways disease and emphysema in patients with COPD. Emphysema can be quantified automatically based on thresholds of the CT density histogram (<−950 Hounsfield units [HU]) . Thoracic CT estimates of airways disease can also be generated using measurements of airway wall area percent (WA%) and lumen area (LA). Indirect measurements of airways disease include CT measurements of gas trapping using densitometry thresholds (−856 HU) on expiratory CT images or parametric response maps using coregistered inspiratory and expiratory CT . Finally, bronchiectasis can be readily observed in thoracic CT in up to 50% of patients with severe COPD , and this is typically identified by enlarged bronchial diameters and evidence of significant mucous plugging.
Get Radiology Tree app to read full this article<
Get Radiology Tree app to read full this article<
Materials and methods
Study Subjects
Get Radiology Tree app to read full this article<
Pulmonary Function Tests
Get Radiology Tree app to read full this article<
Image Acquisition
Get Radiology Tree app to read full this article<
Get Radiology Tree app to read full this article<
Get Radiology Tree app to read full this article<
Get Radiology Tree app to read full this article<
Image Analysis
Get Radiology Tree app to read full this article<
Get Radiology Tree app to read full this article<
Get Radiology Tree app to read full this article<
Statistics
Get Radiology Tree app to read full this article<
Results
Get Radiology Tree app to read full this article<
Table 1
Subject Demographic and Pulmonary Function Measurements
Mean (±SD) All ( n = 26) Bronchiectasis ( n = 14) COPD ( n = 12) Significant Difference ( P Value) Age, years 69 (10) 70 (11) 67 (9) .5 Male, n 11 4 7 — BMI, (kg·m −2 ) 25 (4) 23 (4) 27 (4) .02 Pack years 31 (40) 4 (10) 63 (39) <.001 FEV 1 , % pred 64 (22) 68 (22) 60 (23) .4 FVC, % pred 82 (22) 73 (20) 91 (22) .04 FEV 1 /FVC, % 60 (16) 70 (12) 50 (14) .001 TLC, % pred 107 (18) 98 (14) 117 (16) .003 RV/TLC, % 51 (10) 54 (11) 49 (9) .3 R aw , % pred 138 (41) 135 (48) 141 (33) .7 DL CO , % pred 57 (19) 60 (18) 53 (21) .3
BMI, body mass index; COPD, chronic obstructive pulmonary disease; DL CO , diffusing capacity of lung for carbon monoxide; FEV 1 , forced expiratory volume in 1 second; FVC, forced vital capacity; % pred , percent of predicted value; R aw , airways resistance; RV, residual volume; SD, standard deviation; TLC, total lung capacity.
Significant difference between subgroups ( P < .05) determined by the analysis of variance.
Get Radiology Tree app to read full this article<
Get Radiology Tree app to read full this article<
Get Radiology Tree app to read full this article<
Get Radiology Tree app to read full this article<
Table 2
Imaging Measurements
Mean (±SD) All ( n = 26) Bronchiectasis ( n = 14) COPD ( n = 12) Significant Difference ( P Value) FDMRI Ventilation, % 94 (4) 95 (3) 93 (6) .3 3 He MRI Ventilation, % 79 (12) 82 (9) 76 (14) .2 FDMRI VDP, % 6 (4) 5 (3) 7 (6) .3 3 He MRI VDP, % 21 (12) 18 (9) 24 (14) .2 3 He MRI ADC, cm 2 /s 0.35 (0.13) 0.27 (0.05) 0.43 (0.12) <.001 CT RA 950 , % 5 (7) 2 (3) 9 (8) .005 CT WA, % 57 (2) 58 (2) 56 (2) .009 CT LA, mm 2 46 (14) 40 (10) 53 (15) .01
ADC, apparent diffusion coefficient; COPD, chronic obstructive pulmonary disease; CT, computed tomography; FDMRI, free-breathing 1 H magnetic resonance imaging; LA, lumen area; MRI, magnetic resonance imaging; RA 950 , relative area of the lung with attenuation values <−950 HU; SD, standard deviation; VDP, ventilation defect percent; WA, wall area.
Significant difference between groups ( P < .05) determined by the analysis of variance.
Get Radiology Tree app to read full this article<
Get Radiology Tree app to read full this article<
![Figure 2, Correlations for free-breathing 1 H magnetic resonance imaging (FDMRI) with 3 He MRI and computed tomography (CT) relative area of the lung with attenuation values <−950 HU (RA 950 ). (a) FDMRI ventilation defect percent (VDP) linear regression with 3 He MRI VDP (chronic obstructive pulmonary disease [COPD], r = 0.88; r 2 = 0.78; P = .0001; y = 0.35x – 1.07 and bronchiectasis, r = −0.1; r 2 = 0.009; P > .05; y = −0.03x + 5.92), (b) Bland–Altman analysis of agreement for FDMRI and 3 He MRI VDP (COPD, bias = −16 ± 9%; lower limit = −35%; upper limit = 2% and bronchiectasis, bias = −13 ± 10%; lower limit = −32%; upper limit = 6%), (c) FDMRI VDP linear regression with CT RA 950 (COPD, r = .80; r 2 = .64; P = .002; y = 0.59x + 2.10 and bronchiectasis, r = −0.23; r 2 = 0.05; P > .05; y = −.21x + 5.85), (d) FDMRI VDP linear regression with 3 He MRI apparent diffusion coefficient (COPD, r = 0.71; r 2 = 0.51; P = .01; y = 28x + 5 and bronchiectasis, r = .16; r 2 = .03; P > .05; y = 9.4x + 2.9). Dotted lines = 95% confidence intervals. ADC, apparent diffusion coefficient; COPD, chronic obstructive pulmonary disease; CT, computed tomography; FDMRI, free-breathing 1 H magnetic resonance imaging; MRI, magnetic resonance imaging; RA 950 , relative area of the lung with attenuation values <−950 HU; VDP, ventilation defect percent.](https://storage.googleapis.com/dl.dentistrykey.com/clinical/FreebreathingPulmonary1HandHyperpolarized3HeMRI/1_1s20S1076633214003869.jpg)
Get Radiology Tree app to read full this article<
Get Radiology Tree app to read full this article<
Table 3
Quantitative Spatial Relationships for FDMRI Ventilation and Ventilation Defects
Mean DSC (±SD) All ( n = 26) Bronchiectasis ( n = 14) COPD ( n = 12) Significant Difference ( P Value) Ventilation FDMRI– 3 He MRI, % 86 (5) 86 (4) 86 (7) .8 FDMRI–RA >950 , % 92 (3) 93 (2) 92 (3) .5 Ventilation defects FDMRI– 3 He MRI, % 16 (13) 14 (9) 20 (17) .2 FDMRI–RA 950 , % 10 (16) 2 (3) 19 (20) .005
ADC, apparent diffusion coefficient; DSC, Dice similarity coefficient; FDMRI, free-breathing 1 H magnetic resonance imaging; MRI, magnetic resonance imaging; RA 950 , relative area <−950 HU; RA >950 , relative area >−950 HU; VDP, ventilation defect percent.
Significant difference between groups ( P < .05) determined by the analysis of variance.
Get Radiology Tree app to read full this article<
Get Radiology Tree app to read full this article<
Get Radiology Tree app to read full this article<
Table 4
Pearson Correlations for FDMRI and 3 He MRI
FDMRI VDP % 3 He MRI VDP % Fisher z′ Bronchiectasis ( n = 14) COPD ( n = 12) Bronchiectasis ( n = 14) COPD ( n = 12) B C r/ P Value r/ P Value r/ P Value r/ P Value_P_ Value_P_ Value FEV 1 , % pred 0.41/.1 −0.22/.5 −0.73/.003 −0.42/.2 .001 .6 FVC, % pred 0.31/.3 0.20/.5 −0.60/.02 −0.04/.9 .02 .7 RV/TLC, % −0.31/.3 −0.19/.6 0.65/.02 −0.07/.8 .01 .8 R aw , % pred −0.23/.4 0.60/.04 0.47/.09 0.56/.06 .08 .9 DL CO , % pred 0.08/.8 −0.57/.05 −0.36/.2 −0.61/.04 .3 .9 FDMRI ventilation, % ∼−1/<.001 ∼−1/<.001 0.1/.7 −0.88/<.001 <.001 <.001 FDMRI VDP, % —/— —/— −0.1/.7 0.88/<.001 — — 3 He MRI ventilation, % 0.1/.7 −0.88/<.001 ∼−1/<.001 ∼−1/<.001 <.001 <.001 3 He MRI VDP, % −0.10/.7 0.88/<.001 —/— —/— — — 3 He MRI ADC, cm 2 /s 0.16/.6 0.71/.01 0.35/.2 0.76/.004 .6 .8 CT RA 950 , % −0.23/.4 0.80/.002 −0.04/.9 0.72/.008 .6 .7 CT WA, % −0.35/.2 −0.07/.8 0.29/.3 −0.18/.6 .1 .8 CT LA, mm 2 0.58/.03 0.43/.2 −0.09/.7 0.59/.04 .08 .6
ADC, apparent diffusion coefficient; DL CO , diffusing capacity for carbon monoxide; FEV 1 , forced expiratory volume in 1 second; FDMRI, free-breathing 1 H magnetic resonance imaging; FVC, forced vital capacity; LA, lumen area; % pred , percent of predicted value; MRI, magnetic resonance imaging; r, Pearson correlation coefficients; R aw , airways resistance; RA 950 , relative area of the lung with attenuation < −950 HU; RV/TLC, residual volume/total lung capacity; VDP, ventilation defect percent; WA, wall area.
Get Radiology Tree app to read full this article<
Discussion
Get Radiology Tree app to read full this article<
Get Radiology Tree app to read full this article<
Get Radiology Tree app to read full this article<
Get Radiology Tree app to read full this article<
Get Radiology Tree app to read full this article<
Get Radiology Tree app to read full this article<
Get Radiology Tree app to read full this article<
Acknowledgments
Get Radiology Tree app to read full this article<
Get Radiology Tree app to read full this article<
References
1. Vestbo J., Hurd S.S., Agusti A.G., et. al.: Global strategy for the diagnosis, management, and prevention of chronic obstructive pulmonary disease: GOLD executive summary. Am J Respir Crit Care Med 2013; 187: pp. 347-365.
2. Pauwels R.A., Buist A.S., Calverley P.M., et. al.: Global strategy for the diagnosis, management, and prevention of chronic obstructive pulmonary disease. NHLBI/WHO Global Initiative for Chronic Obstructive Lung Disease (GOLD) Workshop summary. Am J Respir Crit Care Med 2001; 163: pp. 1256-1276.
3. Vestbo J., Anderson W., Coxson H.O., et. al.: Evaluation of COPD longitudinally to identify predictive surrogate end-points (ECLIPSE). Eur Respir J 2008; 31: pp. 869-873.
4. Cerveri I., Corsico A.G., Accordini S., et. al.: Underestimation of airflow obstruction among young adults using FEV1/FVC <70% as a fixed cut-off: a longitudinal evaluation of clinical and functional outcomes. Thorax 2008; 63: pp. 1040-1045.
5. Enright P.L., Kaminsky D.A.: Strategies for screening for chronic obstructive pulmonary disease. Respir Care 2003; 48: pp. 1194-1201. discussion 201–3
6. Hackx M., Bankier A.A., Gevenois P.A.: Chronic obstructive pulmonary disease: CT quantification of airways disease. Radiology 2012; 265: pp. 34-48.
7. Nakano Y., Muller N.L., King G.G., et. al.: Quantitative assessment of airway remodeling using high-resolution CT. Chest 2002; 122: pp. 271s-275s.
8. Hayhurst M.D., MacNee W., Flenley D.C., et. al.: Diagnosis of pulmonary emphysema by computerised tomography. Lancet 1984; 2: pp. 320-322.
9. Klein J.S., Gamsu G., Webb W.R., et. al.: High-resolution CT diagnosis of emphysema in symptomatic patients with normal chest radiographs and isolated low diffusing capacity. Radiology 1992; 182: pp. 817-821.
10. Müller N., Staples C., Miller R., et. al.: “Density mask”. An objective method to quantitate emphysema using computed tomography. Chest 1988; 94: pp. 782.
11. Uppaluri R., Mitsa T., Sonka M., et. al.: Quantification of pulmonary emphysema from lung computed tomography images. Am J Respir Crit Care Med 1997; 156: pp. 248-254.
12. Zach J.A., Newell J.D., Schroeder J., et. al.: Quantitative computed tomography of the lungs and airways in healthy nonsmoking adults. Invest Radiol 2012; 47: pp. 596-602.
13. Galban C.J., Han M.K., Boes J.L., et. al.: Computed tomography-based biomarker provides unique signature for diagnosis of COPD phenotypes and disease progression. Nat Med 2012; 18: pp. 1711-1715.
14. O’Brien C., Guest P.J., Hill S.L., et. al.: Physiological and radiological characterisation of patients diagnosed with chronic obstructive pulmonary disease in primary care. Thorax 2000; 55: pp. 635-642.
15. Patel I.S., Vlahos I., Wilkinson T.M., et. al.: Bronchiectasis, exacerbation indices, and inflammation in chronic obstructive pulmonary disease. Am J Respir Crit Care Med 2004; 170: pp. 400-407.
16. de Lange E.E., Mugler J.P., Brookeman J.R., et. al.: Lung air spaces: MR imaging evaluation with hyperpolarized 3He gas. Radiology 1999; 210: pp. 851-857.
17. Kauczor H.U., Hofmann D., Kreitner K.F., et. al.: Normal and abnormal pulmonary ventilation: visualization at hyperpolarized He-3 MR imaging. Radiology 1996; 201: pp. 564-568.
18. Albert M.S., Cates G.D., Driehuys B., et. al.: Biological magnetic resonance imaging using laser polarized 129Xe. Nature 1994; 370: pp. 199-201.
19. Mathew L., Kirby M., Etemad-Rezai R., et. al.: Hyperpolarized 3 He magnetic resonance imaging: preliminary evaluation of phenotyping potential in chronic obstructive pulmonary disease. Eur J Radiol 2011; 79: pp. 140-146.
20. Kirby M., Svenningsen S., Kanhere N., et. al.: Pulmonary ventilation visualized using hyperpolarized helium-3 and xenon-129 magnetic resonance imaging: differences in COPD and relationship to emphysema. J Appl Physiol 2013; 114: pp. 707-715.
21. Kirby M., Svenningsen S., Owrangi A., et. al.: Hyperpolarized 3He and 129Xe MR imaging in healthy volunteers and patients with chronic obstructive pulmonary disease. Radiology 2012; 265: pp. 600-610.
22. Driehuys B., Martinez-Jimenez S., Cleveland Z.I., et. al.: Chronic obstructive pulmonary disease: safety and tolerability of hyperpolarized 129Xe MR imaging in healthy volunteers and patients. Radiology 2012; 262: pp. 279-289.
23. Kaushik S.S., Cleveland Z.I., Cofer G.P., et. al.: Diffusion-weighted hyperpolarized 129Xe MRI in healthy volunteers and subjects with chronic obstructive pulmonary disease. Mag Reson Med 2011; 65: pp. 1154-1165.
24. Parraga G., Ouriadov A., Evans A., et. al.: Hyperpolarized 3He ventilation defects and apparent diffusion coefficients in chronic obstructive pulmonary disease: preliminary results at 3.0 Tesla. Invest Radiol 2007; 42: pp. 384-391.
25. Kirby M., Mathew L., Wheatley A., et. al.: Chronic obstructive pulmonary disease: longitudinal hyperpolarized (3)He MR imaging. Radiology 2010; 256: pp. 280-289.
26. Kirby M., Heydarian M., Svenningsen S., et. al.: Hyperpolarized 3He magnetic resonance functional imaging semiautomated segmentation. Acad Radiol 2012; 19: pp. 141-152.
27. Bauman G., Puderbach M., Deimling M., et. al.: Non-contrast-enhanced perfusion and ventilation assessment of the human lung by means of Fourier decomposition in proton MRI. Mag Reson Med 2009; 62: pp. 656-664.
28. Bauman G., Lützen U., Ullrich M., et. al.: Pulmonary functional imaging: qualitative comparison of Fourier decomposition MR imaging with SPECT/CT in porcine lung. Radiology 2011; 260: pp. 551-559.
29. Bauman G., Puderbach M., Heimann T., et. al.: Validation of Fourier decomposition MRI with dynamic contrast-enhanced MRI using visual and automated scoring of pulmonary perfusion in young cystic fibrosis patients. Eur J Radiol 2013; 82: pp. 2371-2377.
30. Bauman G., Scholz A., Rivoire J., et. al.: Lung ventilation- and perfusion-weighted Fourier decomposition magnetic resonance imaging: in vivo validation with hyperpolarized 3He and dynamic contrast-enhanced MRI. Mag Reson Med 2013; 69: pp. 229-237.
31. Kjørstad Å., Corteville D.M., Fischer A., et. al.: Quantitative lung perfusion evaluation using Fourier decomposition perfusion MRI. Mag Reson Med 2013; 72: pp. 558-562.
32. Lederlin M., Bauman G., Eichinger M., et. al.: Functional MRI using Fourier decomposition of lung signal: reproducibility of ventilation- and perfusion-weighted imaging in healthy volunteers. Eur J Radiol 2013; 82: pp. 1015-1022.
33. Sommer G., Bauman G., Koenigkam-Santos M., et. al.: Non-contrast-enhanced preoperative assessment of lung perfusion in patients with non-small-cell lung cancer using Fourier decomposition magnetic resonance imaging. Eur J Radiol 2013; 82: pp. e879-e887.
34. Yu J., Xue Y., Song H.K.: Comparison of lung T2* during free-breathing at 1.5 T and 3.0 T with ultrashort echo time imaging. Mag Reson Med 2011; 66: pp. 248-254.
35. Miller M.R., Hankinson J., Brusasco V., et. al.: Standardisation of spirometry. Eur Respir J 2005; 26: pp. 319-338.
36. Kirby M., Heydarian M., Wheatley A., et. al.: Evaluating bronchodilator effects in chronic obstructive pulmonary disease using diffusion-weighted hyperpolarized helium-3 magnetic resonance imaging. J Appl Physiol 2012; 112: pp. 651-657.
37. Heinrich M.P., Jenkinson M., Bhushan M., et. al.: MIND: modality independent neighbourhood descriptor for multi-modal deformable registration. Med Image Anal 2012; 16: pp. 1423-1435.
38. Dice L.R.: Measures of the amount of ecologic association between species. Ecology 1945; 26: pp. 297-302.
39. Guerrero T., Sanders K., Castillo E., et. al.: Dynamic ventilation imaging from four-dimensional computed tomography. Phys Med Biol 2006; 51: pp. 777-791.
40. Castillo R., Castillo E., Martinez J., et. al.: Ventilation from four-dimensional computed tomography: density versus Jacobian methods. Phys Med Biol 2010; 55: pp. 4661-4685.
41. Mathew L., Wheatley A., Castillo R., et. al.: Hyperpolarized (3)He magnetic resonance imaging: comparison with four-dimensional x-ray computed tomography imaging in lung cancer. Acad Radiol 2012; 19: pp. 1546-1553.
42. Kirby M., Pike D., Coxson H.O., et. al.: Hyperpolarized 3 He ventilation defects used to predict pulmonary exacerbations in mild to moderate chronic obstructive pulmonary disease. Radiology 2014; pp. 140161.