
Rationale and Objectives
Mammographic breast density is an important and widely accepted risk factor for breast cancer. A statement about breast density in the mammographic report is becoming a requirement in many States. However, there is significant inter-observer variation between radiologists in their interpretation of breast density. A properly designed automated system could provide benefits in maintaining consistency and reproducibility. We have developed a new automated and calibrated measure of breast density using full field digital mammography (FFDM). This new measure assesses spatial variation within a mammogram and produced significant associations with breast cancer in a small study. The costs of this automation are delays from advanced image and data analyses before the study can be processed. We evaluated this new calibrated variation measure using a larger dataset than previously. We also explored the possibility of developing an automated measure from unprocessed (raw data) mammograms as an approximation for this calibrated breast density measure.
Materials and Methods
A case-control study comprised of 160 cases and 160 controls matched by age, screening history, and hormone replacement therapy was used to compare the calibrated variation measure of breast density with three variants of a noncalibrated measure of spatial variation. The operator-assisted percentage of breast density measure (PD) was used as a standard reference for comparison. Odds ratio (OR) quartile analysis was used to compare these measures. Linear regression analysis was applied to assess the calibration’s impact on the raw pixel distribution.
Results
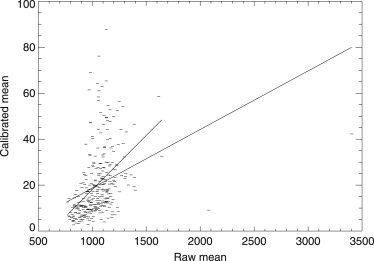
All breast density measures showed significant breast cancer associations. The calibrated spatial variation measure produced the strongest associations (OR: 1.0 [ref.], 4.6, 4.3, 7.4). The associations for PD were diminished in comparison (OR: 1.0 [ref.], 2.7, 2.9, 5.2). Two additional non-calibrated measures restricted in region size also showed significant associations (OR: 1.0 [ref.], 2.9, 4.4, 5.4), and (OR: 1.0 [ref.], 3.5, 3.1, 4.9). Regression analyses indicated the raw image mean is influenced by the calibration more so than its standard deviation.
Conclusion
Breast density measures can be automated. The associated calibration produced risk information not retrievable from the raw data representation. Although the calibrated measure produced the stronger association, the non-calibrated measures may offer an alternative to PD and other operator based methods after further evaluation, because they can be implemented automatically with a simple processing algorithm.
Mammographic breast density is a significant factor for breast cancer risk that has been studied for many years . A statement about breast density is a part of the radiological report according to the fourth edition of the Breast Imaging Reporting and Data System (BI-RADS) . BI-RADS breaks down the estimate of breast density into quartiles: from almost entirely fat (0%–25% glandular tissue) to extremely dense (75%–100% glandular tissue). The breast density part of this report is meant to guide referring physicians to the risk of a cancer being obscured by the background tissue. The downside is that there is significant variation in the way breast density is reported from the 2D examination read by the radiologist . BI-RADS breast density is also used as a measure of risk in research as a coarse approximation for the percentage of breast density measure. Breast density as a breast cancer risk factor is not currently used in clinical practice due to the lack of standardization and automation of its measurement . The attributes of an automated breast density measure for clinical applications should have a high degree of replication and translate across imaging platforms without extensive modification.
There are various methods used to assess breast density, as reviewed previously . For the most part, the breast density and breast cancer associations have been developed with measurements that did not consider the inter-image acquisition technique differences. In particular, the operator-assisted percentage of breast density approach (or PD) has shown repeatedly to correlate well with breast cancer without considering the acquisition technique. Methods for automating PD are not widely used . An alternative method of assessing breast density is to calibrate, or adjust, for the acquisition technique differences .
Get Radiology Tree app to read full this article<
Get Radiology Tree app to read full this article<
Get Radiology Tree app to read full this article<
Methods
Study Population
Get Radiology Tree app to read full this article<
Spatial Variation Breast Density
Get Radiology Tree app to read full this article<

Get Radiology Tree app to read full this article<
Percentage of Breast Density (PD)
Get Radiology Tree app to read full this article<
Breast Cancer Association Comparisons
Get Radiology Tree app to read full this article<
Calibration Assessment
Get Radiology Tree app to read full this article<
Results
Breast Density Measurement Association
Get Radiology Tree app to read full this article<
Table 1
Patient Characteristics
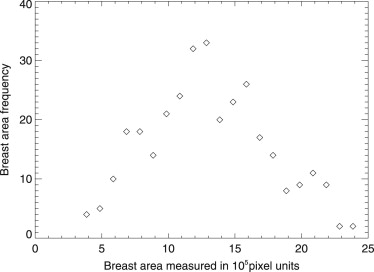
Characteristic Case n Case Mean/SD or % Control n Control Mean SD or % Age 160 58.5/10.6 160 58.5/10.5 HRT Never used 84 52.5% 88 55.0% 1–5 years 26 16.3% 23 14.4% 6–10 years 17 10.6% 17 10.6% 11–15 years 12 7.5% 10 6.3% >15 years 21 13.1% 22 13.8% BMI (kg/m 2 ) 159 ∗ 26.4/4.5 160 25.3/4.3 Breast area (pixels) 160 1,392,643/478,251 160 1,318,957/407,717 Menopausal (post) 123 76.9% 115 71.9%
This table provides the number ( n ) of cases and controls in the hormone replacement therapy (HRT) stratifications by years and for the other measures. The mean and standard deviation (SD) for the age, body mass index (BMI), breast area distributions, and menopausal status (postmenopausal or not) breakdown by case-control group are also provided.
Get Radiology Tree app to read full this article<
Table 2
Breast Density Measurement Associations
Quartile OR (95% CI) First (n 1 ) Second (n 2 ) Third (n 3 ) Fourth (n 4 ) Az PD n = 160 23 41 39 57 BMI adjusted 1.00 (ref.) 2.50 (1.12–5.56) 2.85 (1.26–6.45) 4.94 (2.10–11.62) 0.630 BMI, area adjusted 1.00 (ref.) 2.57 (1.15–5.75) 2.87 (1.26–6.53) 5.17 (2.17–12.33) 0.637 BMI, area, menopausal adjusted 1.00 (ref.) 2.70 (1.19–6.14) 2.94 (1.27–6.80) 5.24 (2.18–12.59) 0.643 PG SD n = 160 22 53 38 47 BMI adjusted 1.00 (ref.) 3.36 (1.58–7.13) 2.89 (1.24–6.74) 4.84 (1.95–12.02) 0.637 BMI, area adjusted 1.00 (ref.) 3.80 (1.75–8.24) 3.56 (1.46–8.69) 6.18 (2.34–16.28) 0.639 BMI, area, menopausal adjusted 1.00 (ref.) 4.63 (2.05–10.47) 4.26 (1.69–10.76) 7.43 (2.72–20.28) 0.651 R SD n = 160 26 42 41 51 BMI adjusted 1.00 (ref.) 1.81 (0.89–3.67) 2.11 (0.97–4.61) 2.78 (1.29–5.97) 0.617 BMI, area adjusted 1.00 (ref.) 2.07 (0.99–4.30) 2.59 (1.13–5.94) 3.48 (1.52–7.93) 0.625 BMI, area, menopausal adjusted 1.00 (ref.) 2.17 (1.03–4.57) 2.86 (1.22–6.72) 3.76 (1.62–8.70) 0.634 R SDL n = 160 21 39 44 56 BMI adjusted 1.00 (ref.) 2.41 (1.15–5.08) 3.39 (1.52–7.58) 4.37 (1.94–9.85) 0.636 BMI, area adjusted 1.00 (ref.) 2.66 (1.24–5.68) 3.82 (1.67–8.76) 4.95 (2.14–11.46) 0.646 BMI, area, menopausal adjusted 1.00 (ref.) 2.89 (1.34–6.27) 4.44 (1.88–10.49) 5.38 (2.29–12.63) 0.654 R SDX n = 160 24 55 36 45 BMI adjusted 1.00 (ref.) 2.96 (1.44–6.10) 2.29 (1.06–4.95) 3.57 (1.48–8.59) 0.639 BMI, area adjusted 1.00 (ref.) 3.35 (1.58–7.09) 2.89 (1.26–6.64) 4.74 (1.81–12.40) 0.639 BMI, area, menopausal adjusted 1.00 (ref.) 3.50 (1.64–7.47) 3.11 (1.34–7.23) 4.87 (1.85–12.84) 0.650
This table gives the quartile odds ratio (OR) stratifications and area under the receiver operating characteristic curve (Az) quantities for each of the five breast density measures: 1) operator-assisted percentage of breast density (PD), 2) calibrated standard deviation (PG SD ), 3) raw image standard deviation (R SD ), 4) raw image standard deviation from the reduced breast area (R SDL ), and 5) raw image standard deviation from the fixed box (R SDX ). The number of cases in each stratification (n 1 -n 4 ) is listed in the top row. 95% confidence intervals (CIs) are provided parenthetically next to each OR. In the analysis, we controlled for body mass (BMI), breast area (area), and menopausal status.
Get Radiology Tree app to read full this article<
Get Radiology Tree app to read full this article<
Get Radiology Tree app to read full this article<
Correlation Comparisons
Get Radiology Tree app to read full this article<

Get Radiology Tree app to read full this article<
Discussion
Get Radiology Tree app to read full this article<
Get Radiology Tree app to read full this article<
Conclusions
Get Radiology Tree app to read full this article<
Get Radiology Tree app to read full this article<
Get Radiology Tree app to read full this article<
Get Radiology Tree app to read full this article<
References
1. Boyd N.F., Martin L.J., Bronskill M., et. al.: Breast tissue composition and susceptibility to breast cancer. J Natl Cancer Inst 2010; 102: pp. 1224-1237.
2. McCormack V.A., dos Santos Silva I.: Breast density and parenchymal patterns as markers of breast cancer risk: a meta-analysis. Cancer Epidemiol Biomarkers Prevention 2006; 15: pp. 1159-1169.
3. D’Orsi C.J., Bassett L.W., Berg W.A., et. al.: Breast Imaging Reporting and Data System: ACR BI-RADS (ed 4).2003.American College of RadiologyReston, VA
4. Ooms E.A., Zonderland H.M., Eijkemans M.J., et. al.: Mammography: interobserver variability in breast density assessment. Breast 2007; 16: pp. 568-576.
5. Brower V.: Breast density gains acceptance as breast cancer risk factor. J Natl Cancer Inst 2010; 102: pp. 374-375.
6. Yaffe M.J.: Mammographic density. Measurement of mammographic density. Breast Cancer Res 2008; 10: pp. 209.
7. Highnam R., Brady M.: Mammographic Image Analysis.1999.Kluwer Academic PublishersBoston, MA
8. Kaufhold J., Thomas J.A., Eberhard J.W., et. al.: A calibration approach to glandular tissue composition estimation in digital mammography. Med Phys 2002; 29: pp. 1867-1880.
9. Pawluczyk O., Augustine B.J., Yaffe M.J., et. al.: A volumetric method for estimation of breast density on digitized screen-film mammograms. Med Phys 2003; 30: pp. 352-364.
10. van Engeland S., Snoeren P.R., Huisman H., et. al.: Volumetric breast density estimation from full-field digital mammograms. IEEE Trans Med Imaging 2006; 25: pp. 273-282.
11. Malkov S., Wang J., Kerlikowske K., et. al.: Single x-ray absorptiometry method for the quantitative mammographic measure of fibroglandular tissue volume. Med Phys 2009; 36: pp. 5525-5536.
12. Boyd N., Martin L., Gunasekara A., et. al.: Mammographic density and breast cancer risk: evaluation of a novel method of measuring breast tissue volumes. Cancer Epidemiol Biomarkers Prevention 2009; 18: pp. 1754-1762.
13. Ding J., Warren R., Warsi I., et. al.: Evaluating the effectiveness of using standard mammogram form to predict breast cancer risk: case-control study. Cancer Epidemiol Biomarkers Prevention 2008; 17: pp. 1074-1081.
14. Shepherd J.A., Kerlikowske K., Ma L., et. al.: Volume of mammographic density and risk of breast cancer. Cancer Epidemiol Biomarkers Prevention 2011; 20: pp. 1473-1482.
15. Heine J.J., Cao K., Rollison D.E., et. al.: A quantitative description of the percentage of breast density measurement using full-field digital mammography. Acad Radiol 2011; 18: pp. 556-564.
16. Heine J.J., Cao K., Rollison D.E.: Calibrated measures for breast density estimation. Acad Radiol 2011; 18: pp. 547-555.
17. Heine J.J., Behera M.: Effective x-ray attenuation measurements with full field digital mammography. Medi Phys 2006; 33: pp. 4350-4366.
18. Heine J.J., Cao K., Beam C.: Cumulative sum quality control for calibrated breast density measurements. Med Phys 2009; 36: pp. 5380-5390.
19. Heine J.J., Cao K., Thomas J.A.: Effective radiation attenuation calibration for breast density: compression thickness influences and correction. BioMedical Engineering Online 2010; 9: pp. 73.
20. Heine J.J., Thomas J.A.: Effective x-ray attenuation coefficient measurements from two full field digital mammography systems for data calibration applications. BioMedical Engineering Online 2008; 7: pp. 13.
21. Heine J.J., Deans S.R., Velthuizen R.P., et. al.: On the statistical nature of mammograms. Med Phys 1999; 26: pp. 2254-2265.
22. Heine J.J., Velthuizen R.P.: A statistical methodology for mammographic density detection. Med Phys 2000; 27: pp. 2644-2651.
23. Heine J.J., Velthuizen R.P.: Spectral analysis of full field digital mammography data. Med Phys 2002; 29: pp. 647-661.
24. Mawdsley G.E., Tyson A.H., Peressotti C.L., et. al.: Accurate estimation of compressed breast thickness in mammography. Med Phys 2009; 36: pp. 577-586.
25. Tyson A.H., Mawdsley G.E., Yaffe M.J.: Measurement of compressed breast thickness by optical stereoscopic photogrammetry. Med Phys 2009; 36: pp. 569-576.