
Rationale and Objectives
Total kidney volume is an important biomarker for the evaluation of autosomal dominant polycystic kidney disease progression. In this study, we present a novel approach for automated segmentation of polycystic kidneys from non–contrast-enhanced computed tomography (CT) images.
Materials and Methods
Non–contrast-enhanced CT images were acquired from 21 patients with a diagnosis of autosomal dominant polycystic kidney disease. Kidney volumes obtained from the fully automated method were compared to volumes obtained by manual segmentation and evaluated using linear regression and Bland-Altman analyses. Dice coefficient was used for performance evaluation.
Results
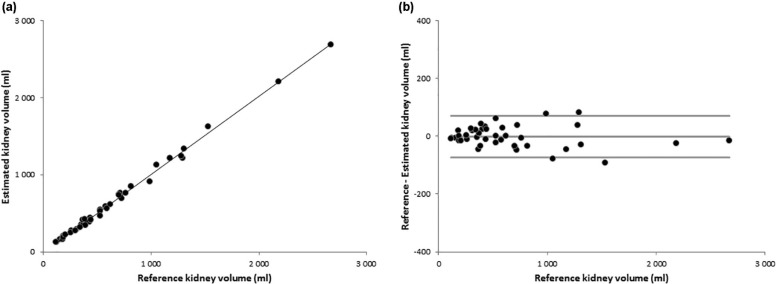
Kidney volumes from the automated method well correlated with the ones obtained by manual segmentation. Bland-Altman analysis showed a low percentage bias (−0.3%) and narrow limits of agreements (11.0%). The overlap between the three-dimensional kidney surfaces obtained with our approach and by manual tracing, expressed in terms of Dice coefficient, showed good agreement (0.91 ± 0.02).
Conclusions
This preliminary study showed the proposed fully automated method for renal volume assessment is feasible, exhibiting how a correct use of biomedical image processing may allow polycystic kidney segmentation also in non–contrast-enhanced CT. Further investigation on a larger dataset is needed to confirm the robustness of the presented approach.
Introduction
Autosomal dominant polycystic kidney disease (ADPKD) is an inherited disorder that is characterized by the development and growth of cysts in both kidneys. Despite a progressive enlargement of the kidneys as a consequence of cyst expansion, especially at the first stages of the disease, the renal function is still preserved. For this reason, common renal function parameters such as the glomerular filtration rate are inadequate for the evaluation of disease progression. Nowadays, total kidney volume (TKV) is considered as the most important biomarker of disease progression and is widely used in clinical trials for the evaluation of the efficacy of new pharmacologic therapies .
The Consortium for Radiological Imaging Studies of Polycystic Kidney Disease (CRISP) recommends the use of three-dimensional (3D) imaging for an accurate and reproducible assessment of TKV. Both magnetic resonance imaging (MRI) and computed tomography (CT) provide reliable measurements of TKV . CT may require the use of a potentially nephrotoxic contrast medium and exposes the patient to ionizing radiation. However, CT imaging systems are widely available with respect to MRI systems, also in small centers, and CT imaging is straightforward and fast.
Get Radiology Tree app to read full this article<
Get Radiology Tree app to read full this article<
Materials and Methods
Get Radiology Tree app to read full this article<
Table 1
Patient Characteristics
Characteristic Value Number of patients 21 Sex (M/F) 12/9 Age at visit (y), mean ± SD (range) 46 ± 17 (18–77) Total kidney volume (mL), median (range) 951 (239–4853) Left kidney volume (mL), median (range) 592 (117–2182) Right kidney volume (mL), median (range) 426 (123–2671)
F, female; M, male; SD, standard deviation.
Get Radiology Tree app to read full this article<
Get Radiology Tree app to read full this article<
Get Radiology Tree app to read full this article<
Image Analysis
Get Radiology Tree app to read full this article<
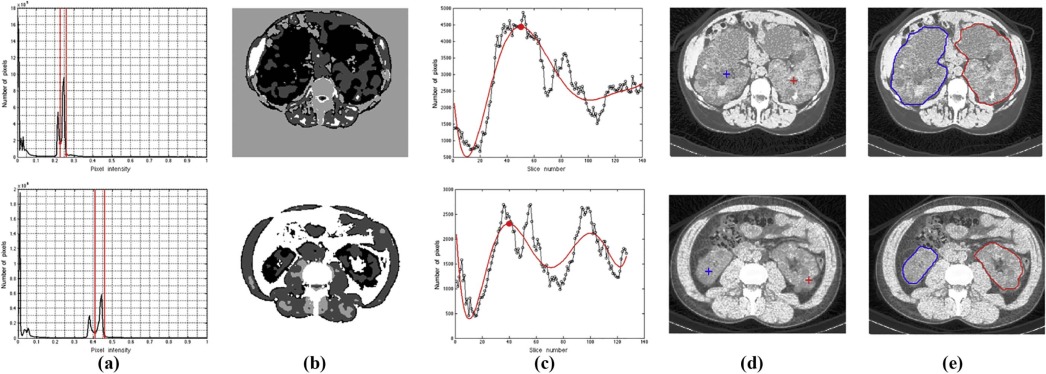
Get Radiology Tree app to read full this article<
Get Radiology Tree app to read full this article<
Get Radiology Tree app to read full this article<
Get Radiology Tree app to read full this article<
Get Radiology Tree app to read full this article<
Results
Get Radiology Tree app to read full this article<
Get Radiology Tree app to read full this article<
Get Radiology Tree app to read full this article<
Get Radiology Tree app to read full this article<
Get Radiology Tree app to read full this article<
Get Radiology Tree app to read full this article<
Discussion and Conclusion
Get Radiology Tree app to read full this article<
Get Radiology Tree app to read full this article<
Get Radiology Tree app to read full this article<
Get Radiology Tree app to read full this article<
Get Radiology Tree app to read full this article<
Get Radiology Tree app to read full this article<
References
1. Alam A., Dahl N.K., Joshua H., et. al.: Total kidney volume in autosomal dominant polycystic kidney disease: a biomarker of disease progression and therapeutic efficacy. Am J Kidney Dis 2015; 66: pp. 564-576.
2. Grantham J.J., Torres V.E.: The importance of total kidney volume in evaluating progression of polycystic kidney disease. Nat Rev Nephrol 2016;
3. Ruggenenti P., Remuzzi A., Ondei P., et. al.: Safety and efficacy of long-acting somatostatin treatment in autosomal-dominant polycystic kidney disease. Kidney Int 2005; 68: pp. 206-216.
4. Chapman A.B., Torres V.E., Perrone R.D., et. al.: The HALT polycystic kidney disease trials: design and implementation. Clin J Am Soc Nephrol 2010; 5: pp. 102-109.
5. Torres V.E., Meijer E., Bae K.T., et. al.: Rationale and design of the TEMPO (tolvaptan efficacy and safety in management of autosomal dominant polycystic kidney disease and its outcomes) 3–4 study. Am J Kidney Dis 2011; 57: pp. 692-699.
6. King B.F., Reed J.E., Bergstralh E.J., et. al.: Quantification and longitudinal trends of kidney, renal cyst, and renal parenchyma volumes in autosomal dominant polycystic kidney disease. J Am Soc Nephrol 2000; 11: pp. 1505-1511.
7. Sise C., Kusaka M., Wetzel L.H., et. al.: Volumetric determination of progression in autosomal dominant polycystic kidney disease by computed tomography. Kidney Int 2000; 58: pp. 2492-2501.
8. Hammoud S., Tissier A.-M., Elie C., et. al.: Ultrasonographic renal volume measurements in early autosomal dominant polycystic disease: comparison with CT-scan renal volume calculations. Diagn Interv Imaging 2015; 96: pp. 65-71.
9. Mai J., Lee V.W., Lopez-Vargas P., et. al.: KHA-CARI autosomal dominant polycystic kidney disease guideline: monitoring disease progression. Semin Nephrol 2015; 35: pp. 565-571. e18
10. Weibel E.R.: Practical methods for biological morphometry. Stereological Methods 1979; pp. 1-348.
11. Song H., Kang W., Zhang Q., et. al.: Kidney segmentation in CT sequences using SKFCM and improved GrowCut algorithm. BMC Syst Biol 2015; 9: pp. S5.
12. Khalifa F., Elnakib A., Beache G.M., et. al.: 3D kidney segmentation from CT images using a level set approach guided by a novel stochastic speed function. Med Image Comput Comput Assist Interv 2011; 14: pp. 587-594.
13. Spiegel M., Hahn D.A., Daum V., et. al.: Segmentation of kidneys using a new active shape model generation technique based on non-rigid image registration. Comput Med Imaging Graph 2009; 33: pp. 29-39.
14. Antiga L., Piccinelli M., Fasolini G., et. al.: Computed tomography evaluation of autosomal dominant polycystic kidney disease progression: a progress report. Clin J Am Soc Nephrol 2006; 1: pp. 754-760.
15. Sharma K., Peter L., Rupprecht C., et. al.: Semi-automatic segmentation of autosomal dominant polycystic kidneys using random forests. arXiv.org e-print archive website. arxiv.org/abs/1510.06915. Published October 232015.
16. Sharma K., Rupprecht C., Caroli A., et. al.: Automatic segmentation of kidneys using deep learning for total kidney volume quantification in autosomal dominant polycystic kidney disease. Sci Rep 2017; 7: pp. 2049.
17. Pei Y., Obaji J., Dupuis A., et. al.: Unified criteria for ultrasonographic diagnosis of ADPKD. J Am Soc Nephrol 2009; 20: pp. 205-212.
18. Valentine J.: The 2007 recommendations of the international commission on radiological protection. ICRP publication 103. Ann ICRP 2007; 37: pp. 1-332.
19. Murty M.N., Jain A.K., Flynn P.J.: Data clustering: a review. ACM Comput Surv 1999; 31: pp. 264-323.
20. Mansouri A.R., Mitiche A., Vazquez C.: Multiregion competition: a level set extension of region competition to multiple region portioning. CVIU 2006; 101: pp. 137-150.
21. Zhou M.-X., Yan X., Xie H.-B., et. al.: Evaluation of non-local means based denoising filters for diffusion kurtosis imaging using a new phantom. PLoS ONE 2015; 10: e0116986
22. Anton H.: Volumes by Slicing; Disks and Washers. Calculus with Analytic Geometry.1984. 359–367
23. Grantham J.J., Torred V.E., Chapman A.B., et. al.: Volume progression in polycystic kidney disease. N Engl J Med 2006; 354: pp. 2122-2130.
24. Kistler A.D., Poster D., Krauer F., et. al.: Increases in kidney volume in autosomal dominant polycystic kidney disease can be detected within six months. Kidney Int 2009; 75: pp. 235-241.
25. Irazabal M., Rangel L.J., Bergstralh E.J., et. al.: Imaging classification of autosomal dominant polycystic kidney disease: a simple model for selecting patients for clinical trials. J Am Soc Nephrol 2015; 26: pp. 160-172.
26. Caroli A., Perico N., Perna A., et. al.: Effect of long-acting somatostatin analogue on kidney and cyst growth in autosomal dominant polycystic kidney disease (ALADIN): a randomised, placebo-controlled, multicentre trial. Lancet 2013; 382: pp. 1485-1495.