
Rationale and Objectives
To evaluate the functional alterations of chronic kidney disease (CKD) with magnetic resonance dynamic perfusion imaging.
Materials and methods
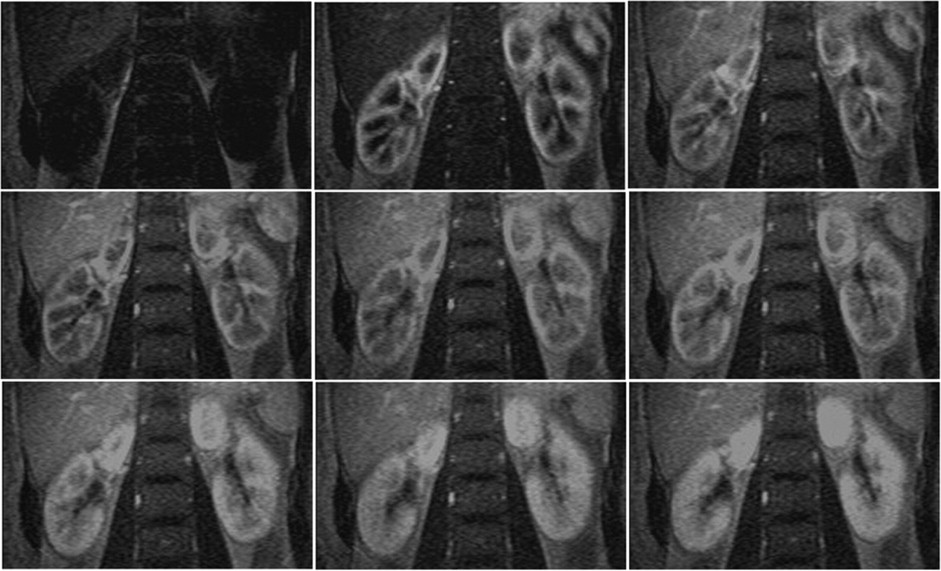
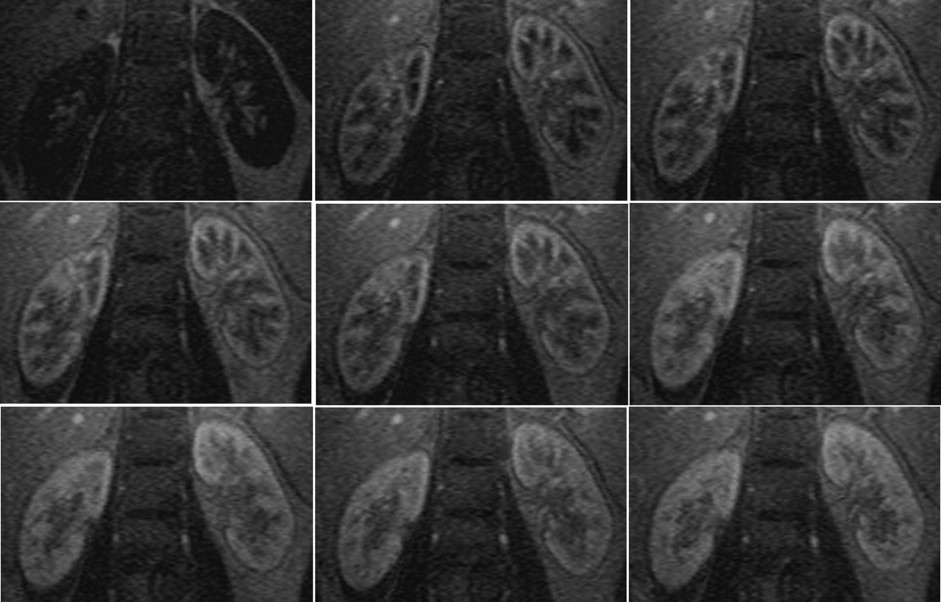
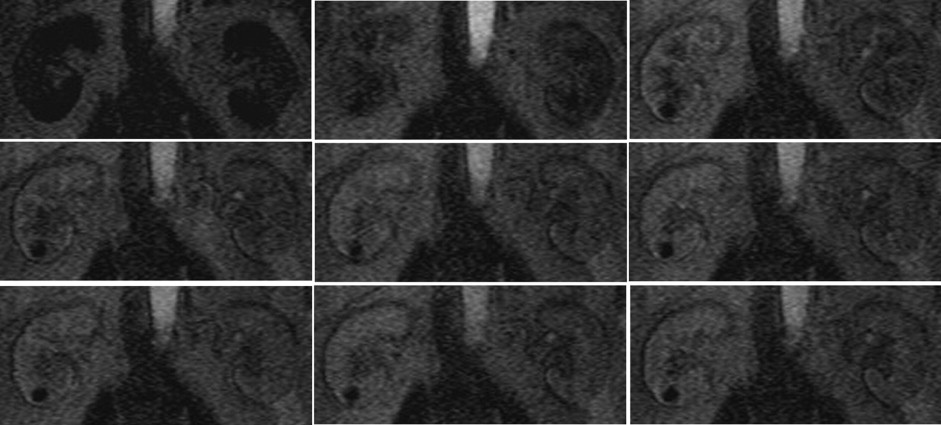
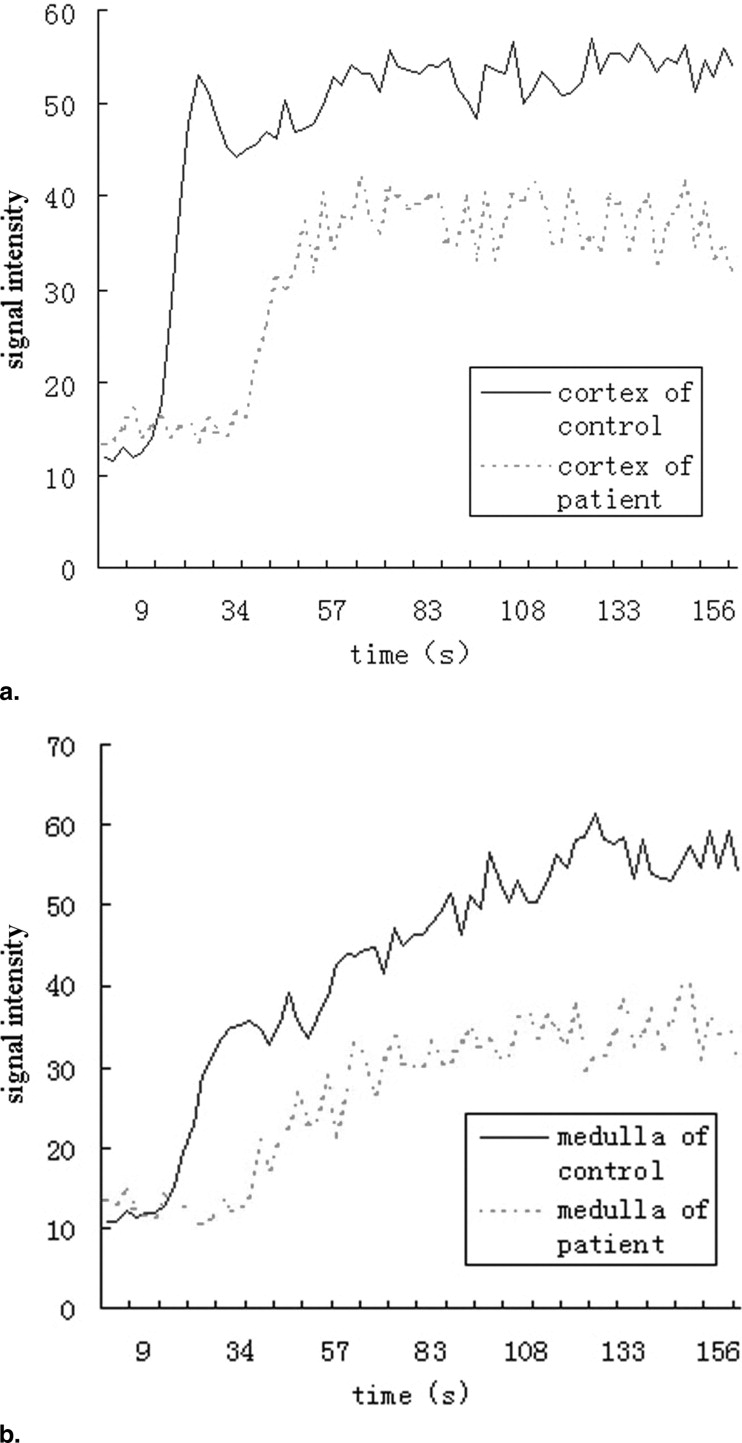
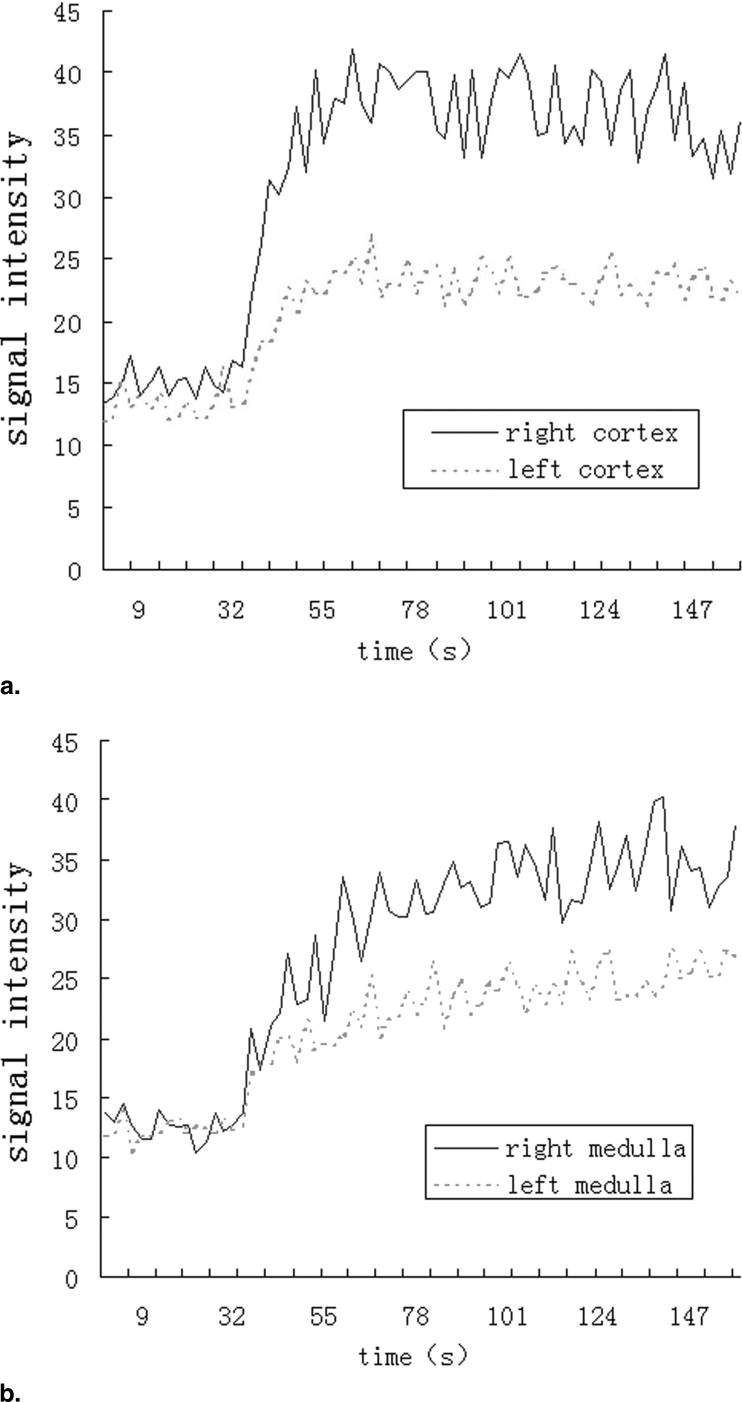
Twenty-one healthy subjects (42 kidneys) and 20 CKD patients (40 kidneys) underwent routine scans with fat-saturated T1-weighted fast low angle shot (FLASH) and true-fast imaging with steady-state precession (FISP) sequences followed by dynamic perfusion scans using a turbo-FLASH T1-weighted sequence. Signal intensity (SI) of the cortex and medulla on images was measured and plotted as a function of time. Peak height (P) and time to peak (T) of the cortex and medulla SI were estimated, and P/T ratio and the area under the time-intensity curves were calculated. We also tested the correlation between these data and serum creatinine (sCr) levels in patients.
Results
P, P/T ratio, and the area under the curve of patients’ cortex and medulla were significantly decreased compared to control subjects, and T was delayed. In patients, P and P/T ratio of the cortex and P of the medulla were negatively correlated with sCr levels ( r = −0.469, r = −0.419, and r = −0.423, respectively; P < 0.01).
Conclusion
Renal dysfunction in CKD can be evaluated by magnetic resonance dynamic perfusion imaging.
Magnetic resonance imaging (MRI) has several distinct advantages in the kidney compared to other imaging methods. Ultrasound scanning (US) is suitable for morphologic evaluation but does not supply information about renal function. Intravenous urography (IVU) allows visualization of general morphology and simple functional evaluation of the kidney. Contrast-enhanced computed tomography (CT) has excellent spatial and temporal resolution, but the contrast used during IVU and CT is nephrotoxic and unfit for patients with renal dysfunction. Although nuclear medicine has provided reliable functional data, inability to visualize the kidney and lack of spatial resolution limit morphologic evaluation.
Dynamic contrast-enhanced MRI has great potential in providing both morphologic and functional information in the kidney ( ). Dynamic T1 contrast-enhancement is a commonly used MRI technique. T1 (longitudinal relaxation time) is shortened because of the dipole–dipole interaction of the contrast agent, which corresponds to increased signal intensity (SI) in T1-weighted imaging. A common contrast agent, gadolinium-diethylenetriamine pentaacetic acid (Gd-DTPA) is not contraindicated in patients with impaired renal function ( ), and it is therefore possible to study renal perfusion and excretion in patients with chronic renal dysfunction using dynamic MRI.
Get Radiology Tree app to read full this article<
Get Radiology Tree app to read full this article<
Get Radiology Tree app to read full this article<
Get Radiology Tree app to read full this article<
Materials and Methods
Subjects
Get Radiology Tree app to read full this article<
MRI
Get Radiology Tree app to read full this article<
Get Radiology Tree app to read full this article<
Pathology
Get Radiology Tree app to read full this article<
Data Analysis
Get Radiology Tree app to read full this article<
Get Radiology Tree app to read full this article<
Results
Get Radiology Tree app to read full this article<
Get Radiology Tree app to read full this article<
Get Radiology Tree app to read full this article<
Table 1
Statistical Results in CKD Patients and Controls
Healthy Controls CKD Patients_t__P_ Value Cortex Time to peak (Tc) 25.8 ± 3.0 31.4 ± 8.1 4.230 <.01 Peak height (Pc) 57.0 ± 12.2 49.6 ± 13.1 2.642 <.05 Pc/Tc 2.2 ± 0.5 1.7 ± 0.7 3.919 <.01 Medulla Time to peak (Tm) 85.5 ± 15.8 96.1 ± 28.0 2.111 <.05 Peak height (Pm) 55.9 ± 10.7 45.9 ± 13.0 3.818 <.01 Pm/Tm 0.67 ± 0.15 0.50 ± 0.19 4.486 <.01
Get Radiology Tree app to read full this article<
Get Radiology Tree app to read full this article<
Table 2
Correlation Between sCr and P, T, and P/T of Cortex and Medulla in CKD Patients
r__P Value Cortex Time to peak (Tc) 0.127 <.05 Peak height (Pc) −0.469 <.01 Pc/Tc −0.419 <.01 Medulla Time to peak (Tm) −0.059 <.05 Peak height (Pm) −0.423 <.01 Pm/Tm −0.298 <.05
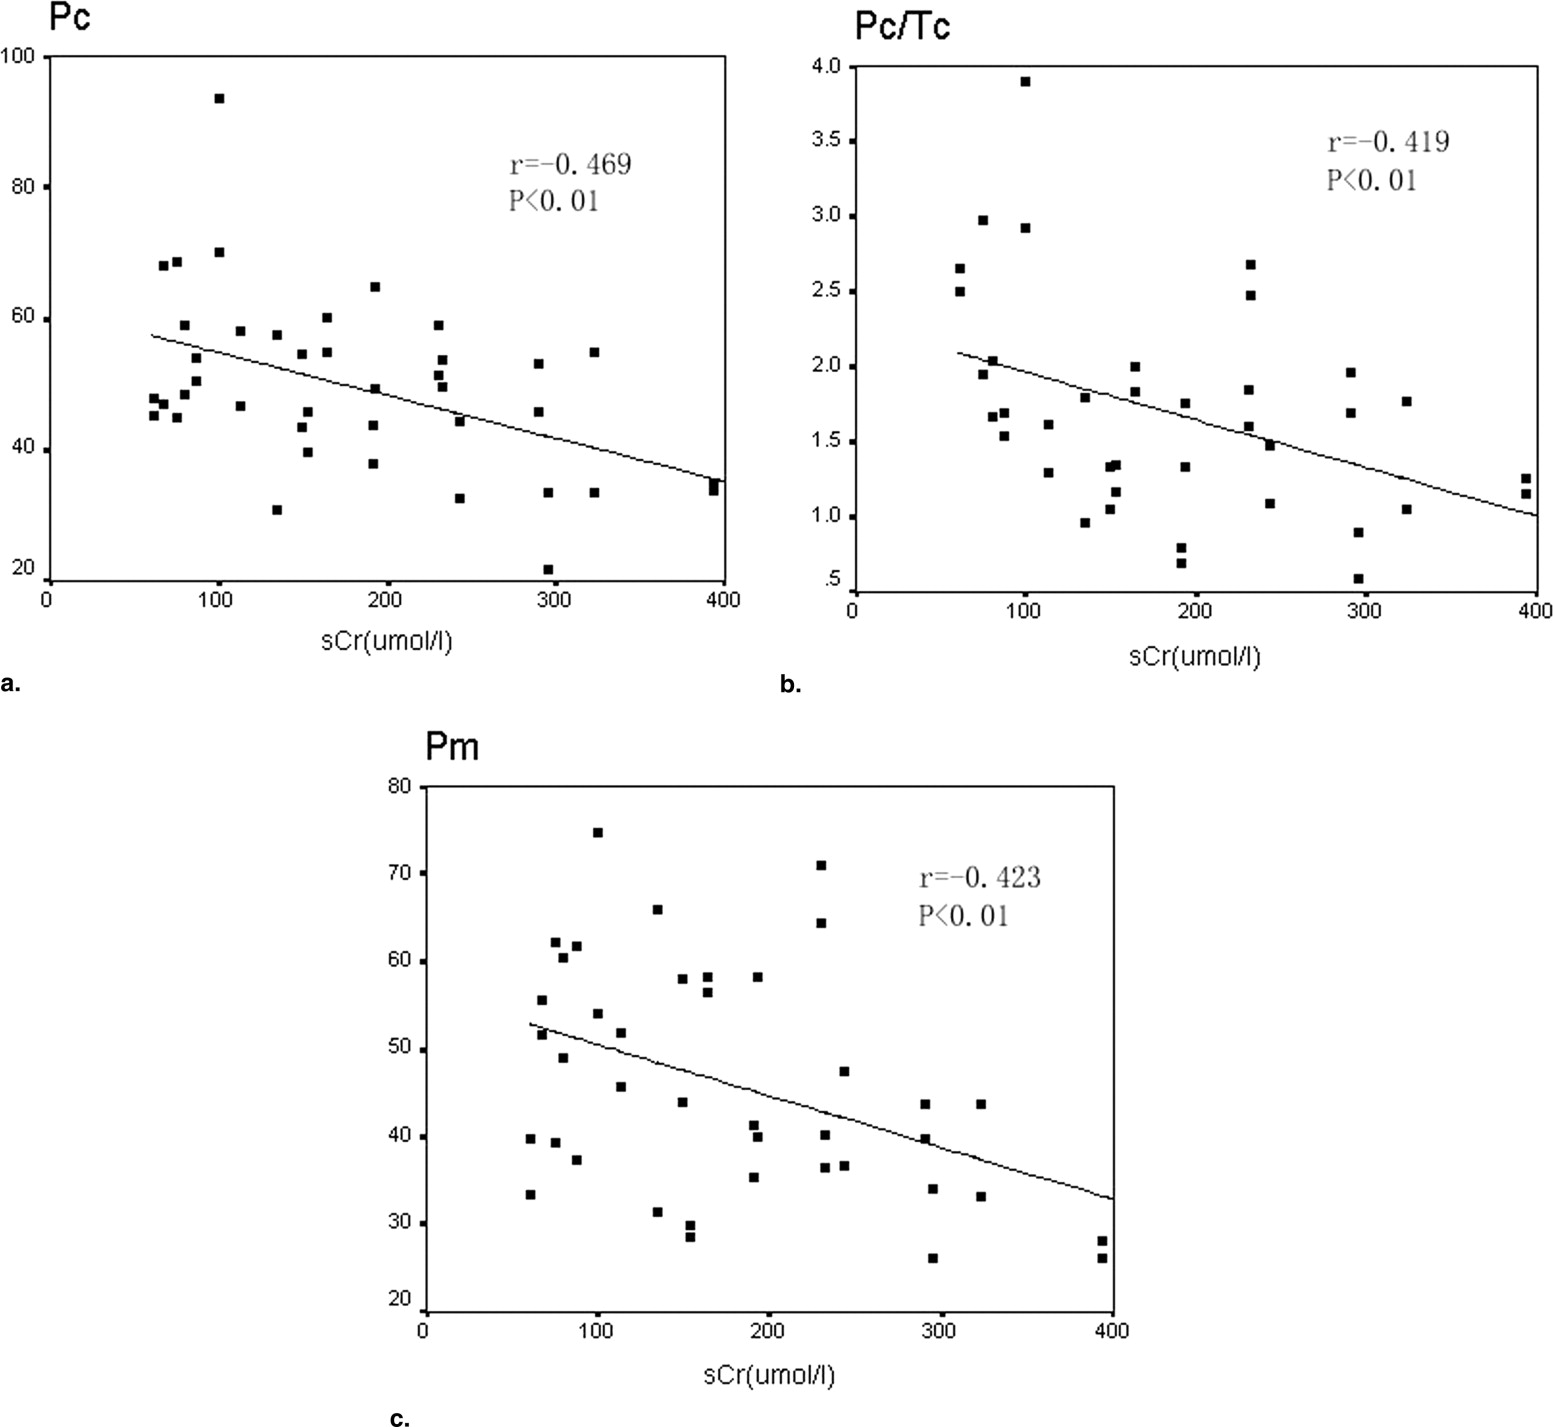
Table 3
The Area Under the Time-intensity Curves in CKD Patients and Controls
Healthy Controls CKD Patients_t__P_ Value Cortex 132.6 ± 27.6 105.6 ± 30.3 3.951 <.01 Medulla 116.6 ± 22.5 90.6 ± 22.1 4.892 <.01
Get Radiology Tree app to read full this article<
Get Radiology Tree app to read full this article<
Get Radiology Tree app to read full this article<
Discussion
Get Radiology Tree app to read full this article<
Get Radiology Tree app to read full this article<
Get Radiology Tree app to read full this article<
Get Radiology Tree app to read full this article<
Get Radiology Tree app to read full this article<
Get Radiology Tree app to read full this article<
Summary
Get Radiology Tree app to read full this article<
Acknowledgment
Get Radiology Tree app to read full this article<
Get Radiology Tree app to read full this article<
References
1. Dupas B., Bach-Gansmo T., Blancho G., Franconi J.M., Havet T., Leaute F.: Gadolinium-enhanced MR imaging of normal renal transplants. Acta Radiol 1999; 40: pp. 250-254.
2. Rieger J., Sitter T., Toepfer M., Linsenmaier U., Pfeifer K.J., Schiffl H.: Gadolinium as an alternative contrast agent for diagnostic and interventional angiographic procedures in patients with impaired renal function. Nephrol Dial Transplant 2002; 17: pp. 824-828.
3. Kikinis R., von Schulthess G.K., Jager P., et. al.: Normal and hydronephrotic kidney: evaluation of renal function with contrast-enhanced MR imaging. Radiology 1987; 165: pp. 837-842.
4. Ichikawa T., Haradome H., Hachiya J., Nitatori T., Araki T.: Perfusion-weighted MR imaging in the upper abdomen: preliminary clinical experience in 61 patients. AJR Am J Roentgenol 1997; 169: pp. 1061-1066.
5. Dalla-Palma L., Panzetta G., Pozzi-Mucelli R.S., Galli G., Cova M., Meduri S.: Dynamic magnetic resonance imaging in the assessment of chronic medical nephropathies with impaired renal function. Eur Radiol 2000; 10: pp. 280-286.
6. Huppertz A., Rohrer M.: Gadobutrol, a highly concentrated MR-imaging contrast agent: its physicochemical characteristics and the basis for its use in contrast-enhanced MR angiography and perfusion imaging. Eur Radiol 2004; 14: pp. M12-M18.
7. Schoenberg S.O., Aumann S., Just A., et. al.: Quantification of renal perfusion abnormalities using an intravascular contrast agent (part 2): results in animals and humans with renal artery stenosis. Magn Reson Med 2003; 49: pp. 288-298.
8. Gandy S.J., Sudarshan T.A., Sheppard D.G., Allan L.C., McLeay T.B., Houston J.G.: Dynamic MRI contrast enhancement of renal cortex: a functional assessment of renovascular disease in patients with renal artery stenosis. J Magn Reson Imaging 2003; 18: pp. 461-466.
9. de Priester J.A., den Boer J.A., Christiaans M.H., et. al.: Automated quantitative evaluation of diseased and nondiseased renal transplants with MR renography. J Magn Reson Imaging 2003; 17: pp. 95-103.
10. Krause U.J., Pabst T., Kostler H., Helbig C., Kenn W., Hahn D.: Time-resolved MR angiography of the renal artery: morphology and perfusion. Rofo 2002; 174: pp. 1170-1174.
11. Miller S., Hahn U., Schick F., et. al.: Diagnosis of renal artery stenosis in 1.0 T using 3D phase contrast magnetic resonance angiography and dynamic contrast medium perfusion. Rofo 1999; 170: pp. 163-167.
12. Miller S., Schick F., Duda S.H., et. al.: Gd-enhanced 3D phase-contrast MR angiography and dynamic perfusion imaging in the diagnosis of renal artery stenosis. Magn Reson Imaging 1998; 16: pp. 1005-1012.
13. Haustein J., Niendorf H.P., Krestin G., et. al.: Renal tolerance of gadolinium-DTPA/dimeglumine in patients with chronic renal failure. Invest Radiol 1992; 27: pp. 153-156.
14. Tsushima Y., Niemi P., Komu M., Dean P.B., Haapanen A., Kormano M.: Dynamic Gd-DTPA-enhanced MR imaging of the kidney: comparison between T1- and T2-weighted sequences. Am J Nephrol 1996; 16: pp. 506-512.
15. Vallee J.P., Lazeyras F., Khan H.G., Terrier F.: Absolute renal blood flow quantification by dynamic MRI and Gd-DTPA. Eur Radiol 2000; 10: pp. 1245-1252.
16. Knesplova L., Krestin G.P.: Magnetic resonance in the assessment of renal function. Eur Radiol 1998; 8: pp. 201-211.
17. Choyke P.L., Frank J.A., Girton M.E., et. al.: Dynamic Gd-DTPA-enhanced MR imaging of the kidney: experimental results. Radiology 1989; 170: pp. 713-720.
18. Suga K., Ogasawara N., Okazaki H., Sasai K., Matsunaga N.: Functional assessment of canine kidneys after acute vascular occlusion on Gd-DTPA-enhanced dynamic echo-planar MR imaging. Invest Radiol 2001; 36: pp. 659-676.
19. Frank J.A., Choyke P.L., Austin H.A., Girton M.E.: Functional MR of the kidney. Magn Reson Med 1991; 22: pp. 319-323.
20. Semelka R.C., Hricak H., Tomei E., Floth A., Stoller M.: Obstructive nephropathy: evaluation with dynamic Gd-DTPA-enhanced MR imaging. Radiology 1990; 175: pp. 797-803.
21. Katzberg R.W., Ivanovic M., Buonocore M.H., et. al.: Gadolinium-enhanced T1-weighted renal and abdominal MR imaging: quantitative discrepancy between clinical and in vitro findings. Acad Radiol 2002; 9: pp. 679-687.
22. Liu A.S., Xie J.X.: Functional evaluation of normothermic ischemia and reperfusion injury in dog kidney by combining MR diffusion-weighted imaging and Gd-DTPA enhanced first-pass perfusion. J Magn Reson Imaging 2003; 17: pp. 683-693.
23. Uematsu H., Matsuda T., Tsuchida T., et. al.: Semi-quantitative approach to estimating GFR by magnetic resonance imaging. Magma 2000; 10: pp. 171-176.
24. Baumann D., Rudin M.: Quantitative assessment of rat kidney function by measuring the clearance of the contrast agent Gd(DOTA) using dynamic MRI. Magn Reson Imaging 2000; 18: pp. 587-595.
25. Laissy J.P., Faraggi M., Lebtahi R., et. al.: Functional evaluation of normal and ischemic kidney by means of gadolinium-DOTA enhanced TurboFLASH MR imaging: a preliminary comparison with 99Tc-MAG3 dynamic scintigraphy. Magn Reson Imaging 1994; 12: pp. 413-419.
26. de Priester J.A., Kessels A.G., Giele E.L., et. al.: MR renography by semiautomated image analysis: performance in renal transplant recipients. J Magn Reson Imaging 2001; 14: pp. 134-140.
27. Taylor J., Summers P.E., Keevil S.F., et. al.: Magnetic resonance renography: optimisation of pulse sequence parameters and Gd-DTPA dose, and comparison with radionuclide renography. Magn Reson Imaging 1997; 15: pp. 637-649.
28. Murakami K., Togami I., Hiraki Y.: Evaluation of renal function by dynamic MR imaging: effect of water load. Acta Med Okayama 1994; 48: pp. 199-209.
29. Rempp K.A., Brix G., Wenz F., Becker C.R., Guckel F., Lorenz W.J.: Quantification of regional cerebral blood flow and volume with dynamic susceptibility contrast-enhanced MR imaging. Radiology 1994; 193: pp. 637-641.
30. Wyngaarden S., Bennett C.: 1995.WB SaundersPhiladelphia, PA:pp. 832-860.