
Rationale and Objectives
The aim of this study was to examine the geographic origin of publications in the highest impacting radiology journals and to examine the link between the percentage of gross domestic product (GDP) spent on research by a country and the output of radiology publications.
Materials and Methods
The five highest impacting general radiology journals (according to the ISI Web of Knowledge database) were selected over a 6-year period from January 2002 to December 2007. Publications were totaled according to the country of the corresponding author. Publications (total and corrected for population size) were assessed according to the GDP of a given country and the percentage of GDP spent on research in that country. Correlation was determined using Spearman’s rank.
Results
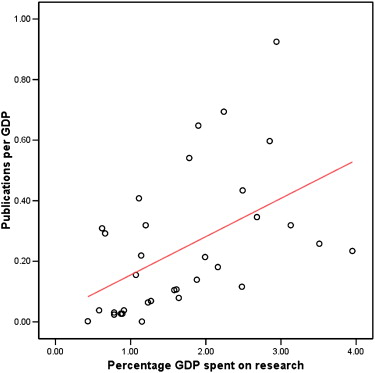
In total, 10,925 papers were identified. The top 10 nations produced 83.9% of the total number of papers. The United States was the most prolific country, with 41.7% of the total. The second-ranked and third-ranked countries were Germany (11.6%) and Japan (6.7%). Corrected for GDP, smaller European countries outperformed larger nations. Switzerland (0.925 publications per billion of GDP), Austria (0.694 publications per billion of GDP), and Belgium (0.648 publications per billion of GDP) produced the most papers per billion of GDP. When corrected for percentage of GDP spent on research, European countries again ranked highest, with Greece, Turkey, and Belgium having the best ratios. The percentage of GDP spent on research was positively correlated with the number of publications in high-ranking radiology journals ( r = 0.603, P < .001).
Conclusions
The United States is the most productive country in absolute number of publications. The flaws of using population size to compare publication output are clear, and a comparison using GDP and the percentage of GDP spent on research may give more meaningful results. When GDP is taken into consideration, smaller European countries are more productive. The importance of investment in radiologic research is emphasized by the association between increased funding of research and the number of publications in high-impacting radiology journals.
Funding for medical research comes from both governmental and private sector sources. Publications in high-impacting, peer-reviewed journals are one of the main determinants of research rating and funding. As a result of the global economic recession, the relationships between researchers and their funding sources are likely to become more uncertain. There is some evidence that larger economies are attempting to address the issue of research and development as a means of promoting long-term economic growth; for example, the US government awarded $21 billion in stimulus funding to research . More so than ever, it is likely that value for money will be expected. In this setting, data demonstrating the efficiency of research production will be important.
In this study, we examined the link between the percentage of gross domestic product (GDP) spent on research and the output of radiology papers in high-impacting journals. The most accepted way of determining the quality of a journal is through its impact factor. We selected the five highest ranked general radiology journals as determined by impact factor and summed the total number of publications per country (as determined by address of the corresponding author). The correlation between the output of radiology research and the percentage of GDP spent on research by a country was examined. The publication rate of countries in terms of total publications and publication corrected for both population size and GDP were also assessed.
Materials and methods
Get Radiology Tree app to read full this article<
Results
Get Radiology Tree app to read full this article<
Table 1
Countries Ranked by Total Publications and Total Publications per Country in the Top Five General Radiology Journals, by Impact Factor
Rank Country Radiology European Radiology RadioGraphics American Journal of Radiology Academic Radiology Total 1 United States 1498 114 458 1710 781 4561 2 Germany 307 694 16 157 91 1265 3 Japan 193 153 33 294 61 734 4 Korea 139 72 51 260 8 530 5 France 117 151 18 97 24 407 6 The Netherlands 179 114 13 37 16 363 7 Switzerland 128 132 13 77 13 359 8 Italy 66 163 13 85 17 344 9 United Kingdom 117 145 10 90 15 335 10 Canada 84 7 28 137 17 273
Get Radiology Tree app to read full this article<
Get Radiology Tree app to read full this article<
Table 2
Countries Ranked by Publications per Billion GDP (Top 10 Only)
Rank Country Publications per Billion of GDP 1 Switzerland 0.93 2 Austria 0.69 3 Belgium 0.65 4 Korea 0.59 5 The Netherlands 0.54 6 Germany 0.43 7 Israel 0.41 8 United States 0.35 9 Japan 0.32 10 Ireland 0.32
GDP, gross domestic product.
Get Radiology Tree app to read full this article<
Get Radiology Tree app to read full this article<
Table 3
Countries Ranked by Total Publications per Million of Population (Top 10 Only)
Rank Country Total Publications per Million of Population 1 Switzerland 48.4 2 Austria 27.1 3 Belgium 24.8 4 The Netherlands 22.2 5 Ireland 16.9 6 Germany 15.3 7 United States 15.2 8 Korea 11.1 9 Finland 10.3 10 Sweden 9.2
Get Radiology Tree app to read full this article<
Get Radiology Tree app to read full this article<
Table 4
Countries Ranked by Ratio of Publications per Billion of GDP to Percentage of GDP Spent on Research (Top 10 Only)
Rank Country Publications per Billion of GDP/Percentage of GDP Spent on Research 1 Greece 0.49 2 Turkey 0.44 3 Belgium 0.34 4 Switzerland 0.31 5 Austria 0.31 6 The Netherlands 0.30 7 Ireland 0.26 8 Korea 0.20 9 New Zealand 0.19 10 Germany 0.17
Table 5
Countries Ranked by Number of Publication per Billion Spent on Research
Rank Country Publications per Billion Spent on Research 1 Greece 55.4 2 Turkey 44.0 3 Belgium 33.9 4 Switzerland 31.5 5 Austria 31.2 6 The Netherlands 30.5 7 Ireland 26.9 8 Korea 21.3 9 New Zealand 19.3 10 Germany 17.2
Get Radiology Tree app to read full this article<
Discussion
Get Radiology Tree app to read full this article<
Get Radiology Tree app to read full this article<
Get Radiology Tree app to read full this article<
Get Radiology Tree app to read full this article<
Get Radiology Tree app to read full this article<
Get Radiology Tree app to read full this article<
Get Radiology Tree app to read full this article<
Get Radiology Tree app to read full this article<
References
1. Buchen L.: News 2009. Nature 2009; 462: pp. 962-963.
2. Thomson Reuters. ISI Web of Knowledge. Available at: http://isiwebofknowledge.com . Accessed April 4, 2009.
3. National Library of Medicine. PubMed. Available at: http://www.pubmed.com . Accessed April 4, 2009.
4. Organisation for Economic Co-operation and Development. Available at: http://www.oecdilibrary.org/oecd/content/table/2075843x-table1 . Accessed April 8, 2009.
5. United Nations. Available at: http://unstats.un.org/unsd/demographic/products/dyb/dybsets/2007%20DYB.pdf . Accessed April 4, 2009.
6. International Monetary Fund. Available at: http://www.imf.org/external/pubs/ft/weo/2009/02/weodata/weoselgr.aspx . Accessed 5, 2009.
7. Ugolini D., Mela G.S.: Oncological research overview in the European Union. A 5-year survey. Eur J Cancer 2003; 39: pp. 1888-1894.
8. Mela G.S., Martinoli C., Poggi E., et. al.: Radiological research in Europe: a bibliometric study. Eur Radiol 2003; 13: pp. 657-662.
9. van Rossum M., Bosker B.H., Pierik E.G., et. al.: Geographic origin of publications in surgical journals. Br J Surg 2007; 94: pp. 244-247.
10. Michalopoulos A., Falagas M.E.: A bibliometric analysis of global research production in respiratory medicine. Chest 2005; 128: pp. 3993-3998.
11. Seglen P.O.: Why the impact factor of journals should not be used for evaluating research. BMJ 1997; 314: pp. 498-502.
12. Whitehouse G.H.: Impact factors: facts and myths. Eur Radiol 2002; 12: pp. 715-717.