
Rationale and Objectives
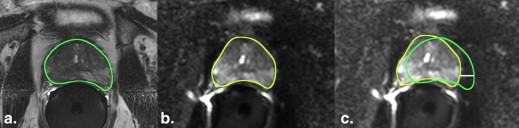
Image distortion on diffusion-weighted imaging (DWI) of the prostate in 3T endorectal magnetic resonance imaging (MRI) examinations is common. The aim of this study was to determine the degree of distortion on DWI using a state-of-the-art clinical protocol and to explore the main contributors to geometric distortion.
Materials and Methods
Forty consecutive patients underwent 3T MRI of the prostate with an endorectal coil filled with air ( n = 20) or barium sulfate ( n = 20). Distortion was measured as the maximum displacement of the outer boundary of the prostate on DWI relative to T2-weighted imaging. The effects of phase-encoding direction, receiver bandwidth, and parallel imaging were then assessed in a prostate phantom on two MRI scanners from different manufacturers.
Results
There was no statistical difference in the mean displacement of the prostate on DWI between the air cohort (1.8 ± 1.2 mm, range 0–4.2 mm) and barium cohort (1.8 ± 2.2 mm, range 0–9 mm). Displacement of the prostate was observed in the phase-encoding direction. Phantom experiments demonstrated a horizontal displacement of 6.0 mm in the phase-encoding direction, which decreased with the use of parallel imaging and higher bandwidth. Geometric distortion was similar for all b values and across manufacturers.
Conclusions
Geometric distortion on DWI of the prostate is common in the phase-encoding direction and does not improve with inflating the coil with barium sulfate. Strategies to reduce this artifact include the use of higher bandwidth and accelerated imaging. Correction of this phenomenon should improve localization of prostate cancer, particularly important for targeted prostate biopsies or focal therapies.
Diffusion-weighted imaging (DWI) has become a key component of multiparametric magnetic resonance imaging (mpMRI) of the prostate . Although DWI improves prostate cancer detection and apparent diffusion coefficient (ADC) values derived from these acquisitions seem to correlate with tumor grade potentially predicting disease aggressiveness, this technique is prone to image distortion .
DWI relies on multiple acquisitions, probing the rate with which water diffuses in various directions and over different scales. Although single-shot spin-echo echo-planar imaging (SE-EPI) is very sensitive to magnetic field inhomogeneities, such as those caused by air in the rectum or within the endorectal coil (ERC) near the prostate , it is the most commonly used sequence in DWI. With SE-EPI, phase error accumulation results in voxel shifts that distort the image along the phase-encoding direction . New gradient coils capable of extremely fast linear gradient switches have enabled DWI acquisition with higher spatial resolution. However, increasing the resolution results in longer echo trains and further increases the accumulation of errors during the spatial encoding .
Get Radiology Tree app to read full this article<
Materials and methods
Patient Selection and MRI Protocol
Get Radiology Tree app to read full this article<
Phantom Experiments
Get Radiology Tree app to read full this article<

Get Radiology Tree app to read full this article<
Get Radiology Tree app to read full this article<
Image Analysis
Get Radiology Tree app to read full this article<
Get Radiology Tree app to read full this article<
Statistical Analysis
Get Radiology Tree app to read full this article<
Get Radiology Tree app to read full this article<
Results
Get Radiology Tree app to read full this article<
Table 1
Mean Displacement of the Prostate Boundaries between the T2-FSE and Diffusion-weighted Images Measured in the Left–Right Direction in Two Cohorts of Patients Undergoing Multiparametric MRI with the ERC Inflated with Air or Barium Sulfate
b Value (s/mm 2 ) Fat-shift TE (milliseconds) TR (milliseconds) FOV (mm 2 ) Reconstruction Matrix Echo Train SENSE Factor BW (Hz/pixel) Displacement (mm) Air ( n = 20) 50 Left 75–78 6776–6955 180 × 180 144 × 140 73 2 1269–1392 1.8 (1.1) 1000 1.7 (1.4) Barium ( n = 20) 50 76–77 6871–6954 1267–1339 1.7 (2.2) 1000 1.8 (2.2)
BW, bandwidth; ERC, endorectal coil; FOV, field of view; FSE, fast spin-echo; TE, echo time; TR, repetition time.
Displacement values within parentheses reflect standard deviations.
Get Radiology Tree app to read full this article<
Get Radiology Tree app to read full this article<
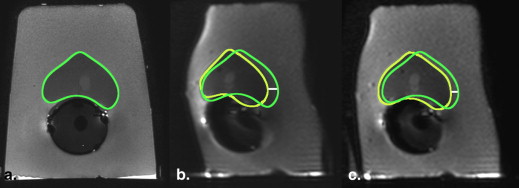
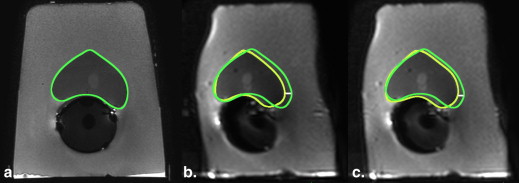
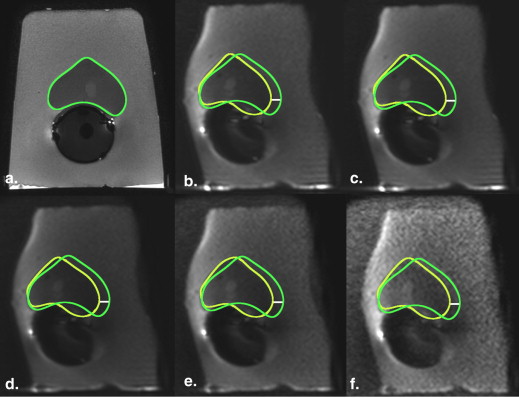
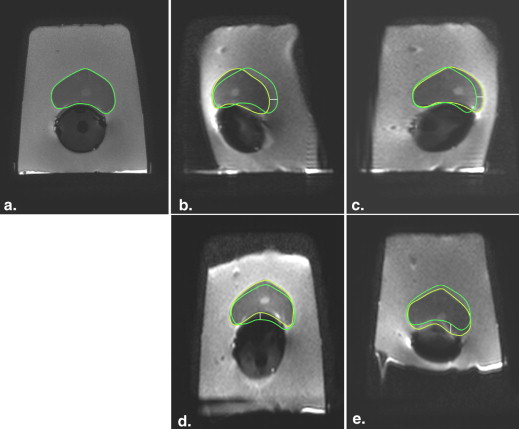
Table 2
Displacement of the Prostate Boundaries between the T2-FSE and Diffusion-weighted Images in a Phantom Model with the ERC Filled with Barium
Test Fat-shift TE (milliseconds) TR (milliseconds) FOV (mm 2 ) Matrix Echo Train SENSE Factor BW (Hz/pixel) Displacement (mm) 1 Left 99 10,000 180 × 180 144 × 141 141 1 1300 6.0 2 Right 99 10,000 180 × 180 144 × 141 141 1 1300 −4.6 ∗ 3 Posterior 97 10,000 180 × 180 144 × 141 141 1 1492 <1.0 † 4 Anterior 97 10,000 180 × 180 144 × 141 141 1 1526 <1.0 † 5 Left 93 10,000 160 × 160 128 × 124 125 1 1267 6.0 6 Left 86 10,000 160 × 160 128 × 124 65 2 751 4.0 7 Left 75 10,000 160 × 160 128 × 124 65 2 1253 2.9
BW, bandwidth; ERC, endorectal coil; FOV, field of view; FSE, fast spin-echo; TE, echo time; TR, repetition time.
In the tests 5–7, FOV was reduced to 160 × 160 mm 2 to allow broader variations in the BW.
Get Radiology Tree app to read full this article<
Get Radiology Tree app to read full this article<
Get Radiology Tree app to read full this article<
Discussion
Get Radiology Tree app to read full this article<
Get Radiology Tree app to read full this article<
Δy(x,y,z)=γΔB(x,y,z)FOVy/BWy Δ
y
(
x
,
y
,
z
)
=
γ
Δ
B
(
x
,
y
,
z
)
FOV
y
/
BW
y
where γ is the gyromagnetic ratio, Δ B is the perturbation of the B 0 field, and FOV y and BW y are the field of view and bandwidth, respectively. From this formula, we can conclude that the voxel shift in the phase-encoding direction will be inversely proportional to the effective bandwidth per voxel, which is consistent with our findings in the phantom: distortion was reduced using a higher bandwidth without altering any other acquisition parameter.
Get Radiology Tree app to read full this article<
Get Radiology Tree app to read full this article<
Get Radiology Tree app to read full this article<
Get Radiology Tree app to read full this article<
Get Radiology Tree app to read full this article<
Get Radiology Tree app to read full this article<
Get Radiology Tree app to read full this article<
Get Radiology Tree app to read full this article<
Get Radiology Tree app to read full this article<
Acknowledgments
Get Radiology Tree app to read full this article<
References
1. Kurhanewicz J., Vigneron D., Carroll P., et. al.: Multiparametric magnetic resonance imaging in prostate cancer: present and future. Curr Opin Urol 2008; 18: pp. 71-77.
2. Haider M.A., van der Kwast T.H., Tanguay J., et. al.: Combined T2-weighted and diffusion-weighted MRI for localization of prostate cancer. AJR Am J roentgenol 2007; 189: pp. 323-328.
3. Langer D.L., van der Kwast T.H., Evans A.J., et. al.: Prostate cancer detection with multi-parametric MRI: logistic regression analysis of quantitative T2, diffusion-weighted imaging, and dynamic contrast-enhanced MRI. JMRI 2009; 30: pp. 327-334.
4. Kozlowski P., Chang S.D., Jones E.C., et. al.: Combined diffusion-weighted and dynamic contrast-enhanced MRI for prostate cancer diagnosis—correlation with biopsy and histopathology. JMRI 2006; 24: pp. 108-113.
5. Woodfield C.A., Tung G.A., Grand D.J., et. al.: Diffusion-weighted MRI of peripheral zone prostate cancer: comparison of tumor apparent diffusion coefficient with Gleason score and percentage of tumor on core biopsy. AJR Am J of roentgenol 2010; 194: pp. W316-W322.
6. Oto A., Yang C., Kayhan A., et. al.: Diffusion-weighted and dynamic contrast-enhanced MRI of prostate cancer: correlation of quantitative MR parameters with Gleason score and tumor angiogenesis. AJR Am J of roentgenol 2011; 197: pp. 1382-1390.
7. Gholipour A., Kehtarnavaz N., Scherrer B., et. al.: On the accuracy of unwarping techniques for the correction of susceptibility-induced geometric distortion in magnetic resonance Echo-planar images. Conf Proc IEEE Eng Med Biol Soc 2011; 2011: pp. 6997-7000.
8. Scherrer B., Gholipour A., Warfield S.K.: Super-resolution reconstruction to increase the spatial resolution of diffusion weighted images from orthogonal anisotropic acquisitions. Med Image Anal 2012; 16: pp. 1465-1476.
9. Rosen Y., Bloch B.N., Lenkinski R.E., et. al.: 3T MR of the prostate: reducing susceptibility gradients by inflating the endorectal coil with a barium sulfate suspension. Magn Reson Med 2007; 57: pp. 898-904.
10. Hu Y., Ahmed H.U., Taylor Z., et. al.: MR to ultrasound registration for image-guided prostate interventions. Med Image Anal 2012; 16: pp. 687-703.
11. Jezzard P., Balaban R.S.: Correction for geometric distortion in echo planar images from B0 field variations. Magn Reson Med 1995; 34: pp. 65-73.
12. Li Y., Xu N., Fitzpatrick J.M., et. al.: Geometric distortion correction for echo planar images using nonrigid registration with spatially varying scale. Magn Reson Imaging 2008; 26: pp. 1388-1397.
13. Ardekani S., Sinha U.: Geometric distortion correction of high-resolution 3 T diffusion tensor brain images. Magn Reson Med 2005; 54: pp. 1163-1171.
14. Oshio K., Feinberg D.A.: GRASE (gradient- and spin-echo) imaging: a novel fast MRI technique. Magn Reson Med 1991; 20: pp. 344-349.
15. Choi H., Ma J.: Use of perfluorocarbon compound in the endorectal coil to improve MR spectroscopy of the prostate. AJR Am J of roentgenol 2008; 190: pp. 1055-1059.
16. Rutman A.M., Kuo M.D.: Radiogenomics: creating a link between molecular diagnostics and diagnostic imaging. Eur J Radiol 2009; 70: pp. 232-241.
17. Zinn P.O., Mahajan B., Sathyan P., et. al.: Radiogenomic mapping of edema/cellular invasion MRI-phenotypes in glioblastoma multiforme. PloS one 2011; 6: pp. e25451.