
Rationale and Objectives
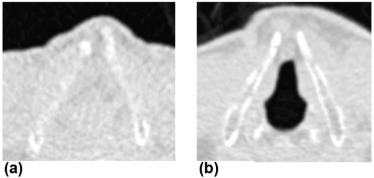
The opened or closed status of the glottis might influence tracheal size changes in inspiratory and expiratory computed tomography (CT) scans. We investigated if the glottis status makes the tracheal collapse differently correlate with lung volume difference between inspiratory and expiratory CT scans.
Materials and Methods
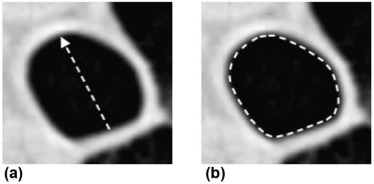
Forty patients with chronic obstructive pulmonary disease whose glottis was included in the acquired scanned volume for lung CT were divided into two groups: 16 patients with the glottis closed in both inspiratory and expiratory CT, and 24 patients with the glottis open in at least one CT acquisition. Lung inspiratory (Vinsp) and expiratory (Vexp) volumes were automatically computed and lung ΔV was calculated using the following formula: (Vinsp − Vexp)/Vinsp × 100. Two radiologists manually measured the anteroposterior diameter and cross-sectional area of the trachea 1 cm above the aortic arch and 1 cm above the carina. Tracheal collapse was then calculated and correlated with lung ΔV.
Results
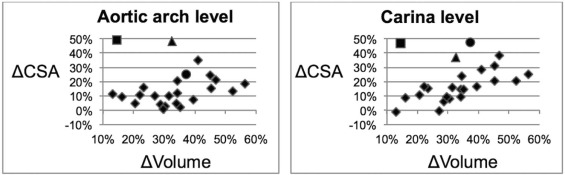
In the 40 patients, the correlations between tracheal Δanteroposterior diameter and Δcross-sectional area at each level and lung ΔV ranged between 0.68 and 0.74 (ρ) at Spearman rank correlation test. However, in the closed glottis group, the correlations were higher for all measures at the two levels (ρ range: 0.84–0.90), whereas in the open glottis group, correlations were low and not statistically significant (ρ range: 0.29–0.34) at the upper level, and moderate at the lower level (ρ range: 0.51–0.55).
Conclusions
A closed or open glottis influences the tracheal size change in inspiratory and expiratory CT scans. With closed glottis, the tracheal collapse shows a stronger correlation with the lung volume difference between inspiratory and expiratory CT scans.
Introduction
Computed tomography (CT) is a valuable technique for imaging the tracheobronchial tree . However, its role in the analysis of tracheal collapsibility in normal or abnormal conditions, including tracheomalacia (TM) and tracheobronchomalacia, is still controversial .
Few studies analyzed the correlation between the degree of tracheal collapse and the lung volume difference betweeninspiration and expiration. Ederle et al. did not observe a relevant correlation between inspiration or expiration changes in the trachea and lung cross-sectional areas in patients with chronic obstructive pulmonary disease (COPD). On the other hand, two studies found substantial correlations between the difference of tracheal volumes and that of inspiratory and expiratory lung volumes in smokers and patients with COPD .
Get Radiology Tree app to read full this article<
Get Radiology Tree app to read full this article<
Material and Methods
Subjects
Get Radiology Tree app to read full this article<
Get Radiology Tree app to read full this article<
Get Radiology Tree app to read full this article<
Get Radiology Tree app to read full this article<
Pulmonary Function Tests
Get Radiology Tree app to read full this article<
CT Acquisition
Get Radiology Tree app to read full this article<
Measurements of Lung Volumes on CT
Get Radiology Tree app to read full this article<
Get Radiology Tree app to read full this article<
Get Radiology Tree app to read full this article<
Measurement of Tracheal Size
Get Radiology Tree app to read full this article<
Get Radiology Tree app to read full this article<
Get Radiology Tree app to read full this article<
Get Radiology Tree app to read full this article<
Get Radiology Tree app to read full this article<
Get Radiology Tree app to read full this article<
Get Radiology Tree app to read full this article<
Statistical Analysis
Get Radiology Tree app to read full this article<
Get Radiology Tree app to read full this article<
Get Radiology Tree app to read full this article<
Results
Get Radiology Tree app to read full this article<
Table 1
Clinical and Pulmonary Function Tests (PFT) Characteristics (Mean ± Standard Deviation) of the Patients with COPD
All Patients ( n = 40) Closed Glottis Group ( n = 16) Open Glottis Group ( n = 24) Open Glottis Group \* ( n = 21) Age (y) 70 ± 6.9 70 ± 7.8 69 ± 6.5 69 ± 6.3 BMI 26 ± 3.4 25 ± 2.9 27 ± 3.7 26 ± 3.8 Pack-years 42 ± 21.9 40 ± 40.7 44 ± 24.9 45 ± 22.9 FEV1 (% of predicted) 77 ± 25.7 78 ± 24.7 75 ± 26.9 77 ± 26.8 FVC (% of predicted) 104 ± 20.8 104 ± 24.7 104 ± 18.8 104 ± 18.2 PEF (% of predicted) 82 ± 27.9 82 ± 21.3 81 ± 31.5 81 ± 32.1 IC (% of predicted) 94 ± 19.7 95 ± 24.8 94 ± 16.0 95 ± 16.3 VC (% of predicted) 106 ± 21.9 107 ± 27.9 104 ± 17.4 107 ± 17.6 FRC (% of predicted) 121 ± 30.7 119 ± 30.5 122 ± 31.5 121 ± 30.9 RV (% of predicted) 119 ± 45.7 116 ± 49.9 121 ± 43.3 119 ± 44.6 TLC (% of predicted) 106 ± 15.9 104 ± 16.4 106 ± 15.9 107 ± 15.8 DLCO (% of predicted) 80 ± 21.5 76 ± 19.7 83 ± 22.6 84 ± 23.2
BMI, body mass index; DLCO, lung diffusing capacity for carbon monoxide; FEV1, forced expiratory volume in the first second; FRC, functional residual capacity; FVC, forced vital capacity; IC, inspiratory capacity; PEF, peak of expiratory flow; RV, residual volume; TLC, total lung capacity; VC, vital capacity.
Get Radiology Tree app to read full this article<
Get Radiology Tree app to read full this article<
Get Radiology Tree app to read full this article<
Get Radiology Tree app to read full this article<
Table 2
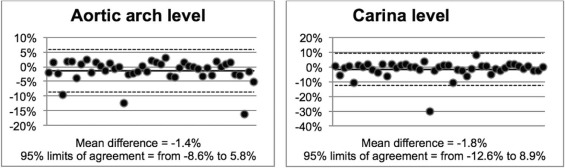
Results of Bland-Altman Analysis on Intra- and Interoperator Measurements
Intraoperator Interoperator Mean Difference 95% Limits of Agreement Mean Difference 95% Limits of Agreement Aortic arch level ΔAPD 1.7% from −8.5% to 11.9% −0.4% from −7.4% to 6.6% ΔCSA 0.7% from −9.5% to 10.8% 0.8% from −7.9% to 9.6% Carina level ΔAPD 0.2% from −10.1% to 10.6% −0.8% from −12.3% to 10.7% ΔCSA −0.6% from −13.4% to 12.2% 1.3% from −11.1% to 13.7%
APD, anteroposterior diameter; CSA, cross-sectional area.
Aortic arch level, 1 cm above the aortic arch; Carina level, 1 cm above the carina.
All Kendall τ tests applied to difference, and Δvolume were not significant ( P > .05).
Get Radiology Tree app to read full this article<
Get Radiology Tree app to read full this article<
Table 3
Spearman Correlation Coefficients ρ (P Value) Between Measurements of the Tracheal Collapse and ΔVolumes
All Patients ( n = 40) Closed Glottis Group ( n = 16) Open Glottis Group ( n = 24) Open Glottis Group \* ( n = 21) Aortic level ΔAPD ρ = 0.746 ( P < .001) ρ = 0.900 ( P < .001) ρ = 0.347 ( P < .1) ρ = 0.516 ( P < .02) ΔCSA ρ = 0.708 ( P < .001) ρ = 0.847 ( P < .001) ρ = −0.294 ( P < .1) ρ = 0.473 ( P < .05) Carina level ΔAPD ρ = 0.686 ( P < .001) ρ = 0.844 ( P < .001) ρ = 0.510 ( P < .02) ρ = 0.704 ( P < .001) ΔCSA ρ = 0.705 ( P < .001) ρ = 0.850 ( P < .001) ρ = 0.554 ( P < .01) ρ = 0.774 ( P < .001)
APD, anteroposterior diameter; CSA, cross-sectional area.
Aortic level, 1 cm above the aortic arch; Carina level, 1 cm above the carina.
Get Radiology Tree app to read full this article<
Get Radiology Tree app to read full this article<
Get Radiology Tree app to read full this article<
Discussion
Get Radiology Tree app to read full this article<
Get Radiology Tree app to read full this article<
Get Radiology Tree app to read full this article<
Get Radiology Tree app to read full this article<
Get Radiology Tree app to read full this article<
Get Radiology Tree app to read full this article<
Get Radiology Tree app to read full this article<
Get Radiology Tree app to read full this article<
Get Radiology Tree app to read full this article<
Get Radiology Tree app to read full this article<
Get Radiology Tree app to read full this article<
Get Radiology Tree app to read full this article<
Get Radiology Tree app to read full this article<
Get Radiology Tree app to read full this article<
Get Radiology Tree app to read full this article<
Conclusion
Get Radiology Tree app to read full this article<
References
1. Acar T., Bayraktaroglu S., Ceylan N., et. al.: Computed tomography findings of tracheobronchial system diseases: a pictorial essay. Jpn J Radiol 2014; 33: pp. 51-58.
2. Yamashiro T., San José Estépar R., Matsuoka S., et. al.: Intrathoracic tracheal volume and collapsibility on inspiratory and end-expiratory CT scans: correlations with lung volume and pulmonary function in 85 smokers. Acad Radiol 2011; 18: pp. 299-305.
3. Ederle J.R., Heussel C.P., Hast J., et. al.: Evaluation of changes in central airway dimensions, lung area and mean lung density at paired inspiratory/expiratory high-resolution computed tomography. Eur Radiol 2003; 13: pp. 2454-2461.
4. Camiciottoli G., Diciotti S., Bigazzi F., et. al.: Is intrathoracic tracheal collapsibility correlated to clinical phenotypes and sex in patients with COPD?. Int J Chron Obstruct Pulmon Dis 2015; 10: pp. 843-852.
5. O’Donnell C.R., Bankier A.A., O’Donnel D.H., et. al.: Static end-expiratory and dynamic forced expiratory tracheal collapse in COPD. Clin Radiol 2014; 69: pp. 357-362.
6. Paoletti M., Cestelli L., Bigazzi F., et. al.: Chronic obstructive pulmonary disease: pulmonary function and CT lung attenuation do not show linear correlation. Radiology 2015; 276: pp. 571-578.
7. Miller M.R., Hankinson J., Brusasco V., et. al.: Standardisation of spirometry. Eur Respir J 2005; 26: pp. 319-338.
8. Wanger J., Clausen J.L., Coates A., et. al.: Standardisation of the measurement of lung volumes. Eur Respir J 2005; 26: pp. 511-522.
9. Macintyre N., Crapo R.O., Viegi G., et. al.: Standardisation of the single-breath determination of carbon monoxide uptake in the lung. Eur Respir J 2005; 26: pp. 720-735.
10. Diciotti S., Sverzellati N., Kauczor H.-U., et. al.: Defining the intra-subject variability of whole-lung densitometry in two lung cancer screening trials. Acad Radiol 2011; 18: pp. 1403-1411.
11. Eom J.S., Lee G., Lee H.Y., et. al.: The relationships between tracheal index and lung volume parameters in mild-to-moderate COPD. Eur J Radiol 2013; 82: pp. e867-e872.
12. Sverzellati N., Rastelli A., Chetta A., et. al.: Airway malacia in chronic obstructive pulmonary disease: prevalence, morphology and relationship with emphysema, bronchiectasis and bronchial wall thickening. Eur Radiol 2009; 19: pp. 1669-1678.
13. Bland J.M., Altman D.G.: Measuring agreement in method comparison studies. Stat Methods Med Res 1999; 8: pp. 135-160.
14. Jonson B., Bouhuys A.: Measurement of alveolar pressure. J Appl Physiol 1967; 22: pp. 1981-1985.
15. Griscom N., Wohl M.E.: Tracheal size and shape: effects of change in intraluminal pressure. Radiology 1983; 149: pp. 27-30.
16. Hoffstein V., Castile R.G., O’Donnell C.R., et. al.: In vivo estimation of tracheal distensibility and hysteresis in normal adults. J Appl Physiol 1987; 63: pp. 2482-2489.
17. Rodenstein D.O., Stănescu D.C.: The soft palate and breathing. Am Rev Respir Dis 1986; 134: pp. 311-325.
18. Mukaka M.M.: Statistics corner: a guide to appropriate use of correlation coefficient in medical research. Malawi Med J 2012; 24: pp. 69-71.
19. Boiselle P.M., O’Donnell C.R., Bankier A.A., et. al.: Tracheal collapsibility in healthy volunteers during forced expiration: assessment with multidetector CT. Radiology 2009; 252: pp. 255-262.
20. Brown I.G., McClean P.A., Webster P.M., et. al.: Lung volume dependence of esophageal pressure in the neck. J Appl Physiol 1985; 59: pp. 1849-1854.
21. Baydur A., Sassoon C.S., Carlson M.: Measurement of lung mechanics at different lung volumes and esophageal levels in normal subjects: effect of posture change. Lung 1996; 174: pp. 139-151.
22. Brown I.G., Webster P.M., Zamel N., et. al.: Changes in tracheal cross-sectional area during Mueller and Valsalva maneuvers in humans. J Appl Physiol 1986; 60: pp. 1865-1870.
23. Harris R.S.: Pressure-volume curves of the respiratory system. Respir Care 2005; 50: pp. 78-98. discussion 98–99
24. Boiselle P.M., Litmanovich D.E., Michaud G., et. al.: Dynamic expiratory tracheal collapse in morbidly obese COPD patients. COPD 2013; 10: pp. 604-610.
25. Bankier A.A., O’Donnell C.R., Boiselle P.M.: Quality initiatives. Respiratory instructions for CT examinations of the lungs: a hands-on guide. Radiographics 2008; 28: pp. 919-931.
26. Mascalchi M.: Pulmonary function tests and computed tomography lung attenuation in chronic obstructive pulmonary disease. J Thoracic Dis 2015; 7: pp. 1882-1884.
27. Orlandi I., Moroni C., Camiciottoli G., et. al.: Chronic obstructive pulmonary disease: thin-section CT measurement of airway wall thickness and lung attenuation. Radiology 2005; 234: pp. 604-610.
28. Ciet P., Boiselle P.M., Michaud G., et. al.: Optimal imaging protocol for measuring dynamic expiratory collapse of the central airways. Clin Radiol 2016; 71: pp. e49-e55.