
Rationale and Objectives
Diffusion tensor imaging (DTI) has been used extensively in determining morphology and connectivity of the brain; however, similar analysis in the spinal cord has proven difficult. The objective of this study was to improve the delineation of gray and white matter in the spinal cord by applying signal processing techniques to the eigenvalues of the diffusion tensor. Our approach involved creating anisotropy indices based on the difference between eigenvalues and mean diffusivity then using a fuzzy inference system (FIS) to delineate between gray and white matter in the human cervical spinal cord.
Materials and Methods
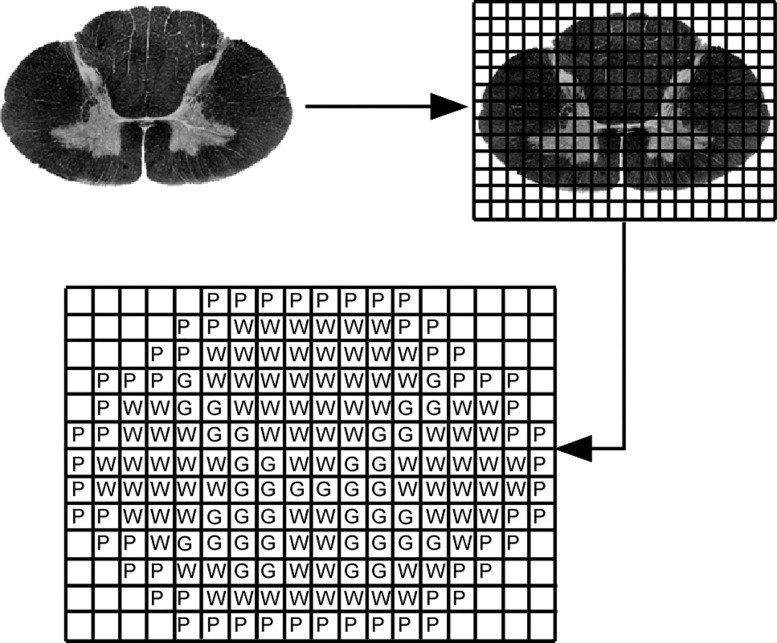
DTI was performed on the cervical spinal cord in five neurologically intact subjects. Distributions were extracted for regions of gray and white matter through the use of a digitized histologic template. Fuzzy membership functions were created based on these distributions. Detectability index and receiver operating characteristic (ROC) analysis was performed on traditional DTI indices and FIS classified regions.
Results
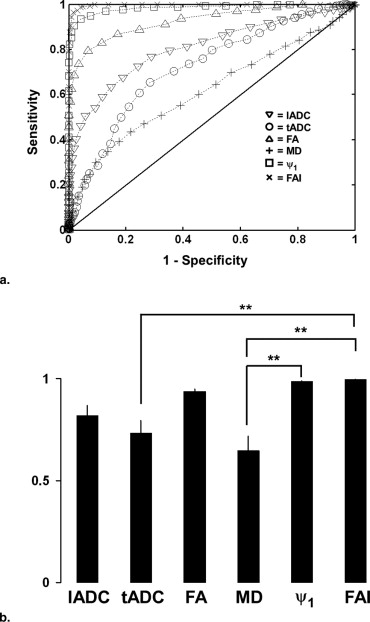
A significantly higher contrast between gray and white matter was observed using fuzzy classification compared with traditionally used DTI indices based on the detectability index ( P < .001) and trends in the ROC analysis. Reconstructed images from the FIS qualitatively showed a better anatomical representation of the spinal cord compared with traditionally used DTI indices.
Conclusions
Diffusion tensor imaging using an FIS for tissue classification provides high contrast between spinal gray and white matter compared with traditional DTI indices and may provide a noninvasive technique to quantify the integrity and morphology of the human spinal cord following injury.
Diffusion tensor imaging (DTI) is a magnetic resonance imaging method that quantifies the diffusion of water within a voxel in three-dimensional space. Indices of the diffusion tensor have been used for distinguishing between white and gray matter in the brain ( ) for the identification of brain structures, especially in pathologic circumstances. Similarly, classification of gray and white matter in the human spinal cord would be useful for characterizing morphologic features of the cord; however, spatial resolution restrictions and other challenges have limited the application of DTI in the spinal cord ( ). Although previous studies have quantified the basic diffusion properties of the human spinal cord using indices derived from the diffusion tensor ( ), delineation between gray and white matter in the in vivo spinal cord has not been accomplished. The purpose of this study was to develop an improved method for the delineation of gray and white matter in the human spinal cord through the use of a fuzzy logic–based tissue classification algorithm.
Previous research in the brain has shown that the diffusion of water is different for voxels containing white matter compared with those containing gray matter, most likely because of membrane barriers associated with the axons ( ) along with other morphologic and orientation-dependent characteristics ( ). Diffusion perpendicular to axon orientation is restricted by these boundaries causing white matter to be more anisotropic than gray matter; therefore, measures of anisotropy have been used for delineation of gray and white matter in the brain. Unfortunately, differences in diffusion properties of gray and white matter in the spinal cord are not as distinct, although gray matter is slightly more isotropic than white matter ( ). As a result, traditional anisotropy measures are not as effective for delineation of spinal gray and white matter.
Get Radiology Tree app to read full this article<
Materials and methods
Subjects
Get Radiology Tree app to read full this article<
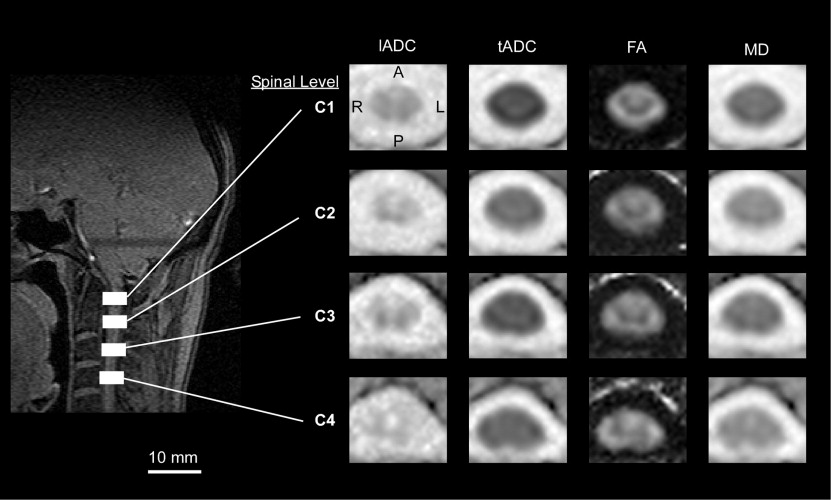
MRI
Get Radiology Tree app to read full this article<
Get Radiology Tree app to read full this article<
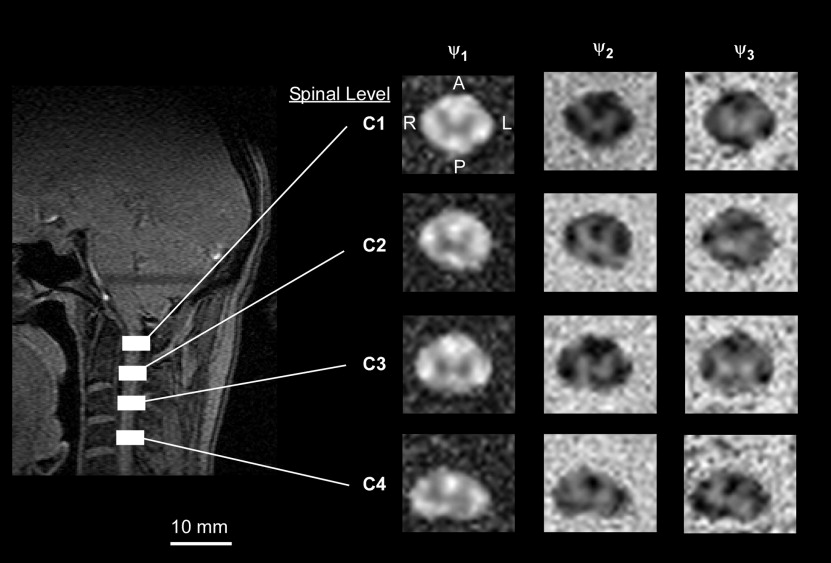
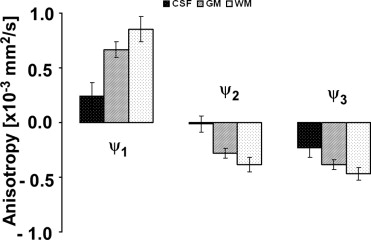
Anisotropy Indices
Get Radiology Tree app to read full this article<
ψ1(x,y,z)=λ1(x,y,z)−MD(x,y,z) ψ
1
(
x
,
y
,
z
)
=
λ
1
(
x
,
y
,
z
)
−
M
D
(
x
,
y
,
z
)
ψ2(x,y,z)=λ2(x,y,z)−MD(x,y,z) ψ
2
(
x
,
y
,
z
)
=
λ
2
(
x
,
y
,
z
)
−
M
D
(
x
,
y
,
z
)
ψ3(x,y,z)=λ3(x,y,z)−MD(x,y,z) ψ
3
(
x
,
y
,
z
)
=
λ
3
(
x
,
y
,
z
)
−
M
D
(
x
,
y
,
z
)
where ψ n is the anisotropy (mm 2 /second) in a specific direction n , λ n is the eigenvalue for a particular direction (mm 2 /second), and MD is the mean diffusivity, defined as the average of all three eigenvalues (mm 2 /second).
Get Radiology Tree app to read full this article<
Get Radiology Tree app to read full this article<
Template Creation and Training Data
Get Radiology Tree app to read full this article<
Get Radiology Tree app to read full this article<
Get Radiology Tree app to read full this article<
Get Radiology Tree app to read full this article<
FIS
Get Radiology Tree app to read full this article<
μ(χ)=[μCSF(χ)μGM(χ)μWM(χ)]=⎡⎣⎢μCSF(ψ1)μCSF(ψ2)μCSF(ψ3)μGM(ψ1)μGM(ψ2)μGM(ψ3)μWM(ψ1)μWM(ψ2)μWM(ψ3)⎤⎦⎥ μ
(
χ
)
=
[
μ
C
S
F
(
χ
)
μ
G
M
(
χ
)
μ
W
M
(
χ
)
]
=
[
μ
C
S
F
(
ψ
1
)
μ
G
M
(
ψ
1
)
μ
W
M
(
ψ
1
)
μ
C
S
F
(
ψ
2
)
μ
G
M
(
ψ
2
)
μ
W
M
(
ψ
2
)
μ
C
S
F
(
ψ
3
)
μ
G
M
(
ψ
3
)
μ
W
M
(
ψ
3
)
]
where
μtissue(index)=12πsindex,tissue√e−(index−mindex,tissue)22⋅sindex,tissue μ
t
i
s
s
u
e
(
i
n
d
e
x
)
=
1
2
π
s
i
n
d
e
x
,
t
i
s
s
u
e
e
−
(
i
n
d
e
x
−
m
i
n
d
e
x
,
t
i
s
s
u
e
)
2
2
⋅
s
i
n
d
e
x
,
t
i
s
s
u
e
is the Gaussian membership function for a specific anisotropy index and tissue type, m index,tissue is the sampled mean value for a particular index and tissue type obtained with the histologic template, and s index,tissue is the sampled standard deviation.
Get Radiology Tree app to read full this article<
Get Radiology Tree app to read full this article<
β=and(μ(χ))=[and(μCSF(χ))and(μGM(χ))and(μWM(χ))] β
=
a
n
d
(
μ
(
χ
)
)
=
[
a
n
d
(
μ
C
S
F
(
χ
)
)
a
n
d
(
μ
G
M
(
χ
)
)
a
n
d
(
μ
W
M
(
χ
)
)
]
where
and(μtissue(χ))=∏∈indexμtissue(index) a
n
d
(
μ
t
i
s
s
u
e
(
χ
)
)
=
∏
∈
i
n
d
e
x
μ
t
i
s
s
u
e
(
i
n
d
e
x
)
The degree of membership of a specific voxel as a particular tissue type was then mapped to the new variable space termed the fuzzy anisotropy index by first defining a set of output membership functions. To allow for a specific voxel being a combination of tissue types, as occurs with partial volume effects, we defined an output membership function matrix as
ξ(y)=[ξCSF(y)ξGM(y)ξWM(y)] ξ
(
y
)
=
[
ξ
C
S
F
(
y
)
ξ
G
M
(
y
)
ξ
W
M
(
y
)
]
where
ξCSF(y)={−2y+10for0≤y≤0.5for0.5≤y≤1 ξ
C
S
F
(
y
)
=
{
−
2
y
+
1
0
for
0
≤
y
≤
0
.5
for
0
.5
≤
y
≤
1
ξGM(y)={2y−2y−2for0≤y≤0.5for0.5≤y≤1 ξ
G
M
(
y
)
=
{
2
y
-
2
y
−
2
for
0
≤
y
≤
0
.5
for
0
.5
≤
y
≤
1
ξWM(y)={02y−1for0≤y≤0.5for0.5≤y≤1 ξ
W
M
(
y
)
=
{
0
2
y
−
1
for
0
≤
y
≤
0
.5
for
0
.5
≤
y
≤
1
where y was the output variable termed the fuzzy anisotropy . To perform the mapping operation, the minimum between the membership grade for each tissue type, β, and the output membership function for that particular tissue type, ξ ( y ), was calculated. The membership grade for each tissue type was assumed constant for all values of the fuzzy anisotropy , y , thus β ( y ) = β. The mapped distributions were defined as
η(y)=[ηCSF(y)ηGM(y)ηWM(y)]=min(β,ξ(y)) η
(
y
)
=
[
η
C
S
F
(
y
)
η
G
M
(
y
)
η
W
M
(
y
)
]
=
min
(
β
,
ξ
(
y
)
)
where
ηtissue(y)=min(and(μtissue(χ)),ξtissue(y)) η
t
i
s
s
u
e
(
y
)
=
min
(
a
n
d
(
μ
t
i
s
s
u
e
(
χ
)
)
,
ξ
t
i
s
s
u
e
(
y
)
)
The result of the mapping operation was a row vector, η ( y ), containing three functions of the fuzzy anisotropy for each tissue type, η tissue ( y ). A single value for the fuzzy anisotropy index (FAI) was computed by first summing the three distributions in η ( y ) and then finding the centroid location along y . The FAI was defined as
FAI=centroid(η(y)φ) F
A
I
=
c
e
n
t
r
o
i
d
(
η
(
y
)
φ
)
where φ = [1 1 1] T was used as the matrix sum. The resulting FAI was used to classify gray matter regions and intact white matter tracts. The Fuzzy Logic Toolbox in MATLAB (MathWorks, Inc, Natick, MA) was used for implementation of the FIS.
Get Radiology Tree app to read full this article<
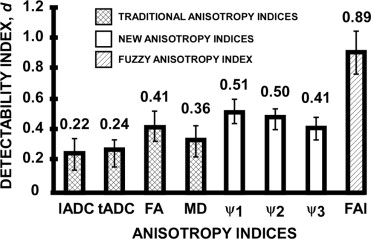
Detectability Index
Get Radiology Tree app to read full this article<
d=|mGM−mWM|s2GM+s2WM√. d
=
|
m
G
M
−
m
W
M
|
s
G
M
2
+
s
W
M
2
.
For the 15 test slices, m GM was the mean sampled index value for the GM region of interest, m WM was the mean sampled index value for the WM region of interest, s 2 GM was the sampled variance of a particular index for the GM region of interest, and s 2 WM was the sampled variance of a particular index for the WM region of interest. The detectability index was calculated for the traditional DTI indices, anisotropy indices ψ 1 , ψ 2 , ψ 3 , and the FAI from the FIS classification. A two-way analysis of variance with pooled variance was performed comparing the detectability index between DTI indices and subjects. Post-hoc statistical analysis was completed using Tukey’s test for multiple comparisons with α = 0.05. All statistical tests were completed with MINITAB statistical software.
Get Radiology Tree app to read full this article<
Receiver Operator Characteristic
Get Radiology Tree app to read full this article<
Get Radiology Tree app to read full this article<
Results
Anisotropy Indices
Get Radiology Tree app to read full this article<
Get Radiology Tree app to read full this article<
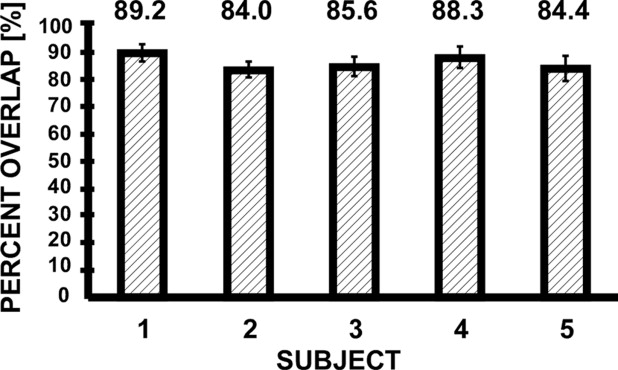
Template Alignment
Get Radiology Tree app to read full this article<
Get Radiology Tree app to read full this article<
FIS
Get Radiology Tree app to read full this article<
Get Radiology Tree app to read full this article<
Get Radiology Tree app to read full this article<
Get Radiology Tree app to read full this article<
Get Radiology Tree app to read full this article<
Table 1
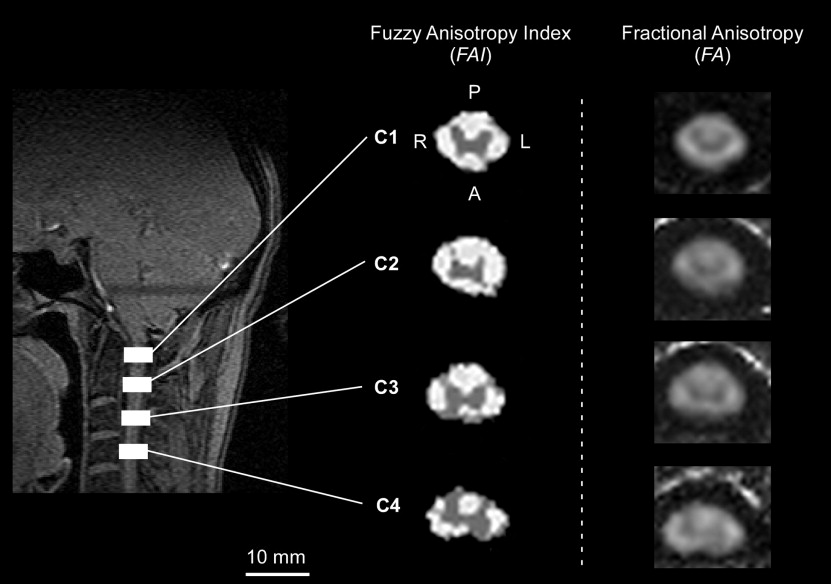
Percentage of Test Image Voxels Labeled Correctly for the Fuzzy Anisotropy Index and Fractional Anisotropy with Respect to Template Classification
Index Region % Correct n Fuzzy anisotropy index Gray matter 86.5 27 Fractional anisotropy Gray matter 70.4 27 Fuzzy anisotropy index White matter 67.1 60 Fractional anisotropy White matter 40.0 60
Get Radiology Tree app to read full this article<
Detectability Index
Get Radiology Tree app to read full this article<
Get Radiology Tree app to read full this article<
Get Radiology Tree app to read full this article<
Get Radiology Tree app to read full this article<
ROC
Get Radiology Tree app to read full this article<
Get Radiology Tree app to read full this article<
Discussion
Get Radiology Tree app to read full this article<
Imaging Sequence
Get Radiology Tree app to read full this article<
Traditional versus New Indices
Get Radiology Tree app to read full this article<
Get Radiology Tree app to read full this article<
FIS
Get Radiology Tree app to read full this article<
Get Radiology Tree app to read full this article<
Get Radiology Tree app to read full this article<
Get Radiology Tree app to read full this article<
Get Radiology Tree app to read full this article<
Limitations of the Study
Get Radiology Tree app to read full this article<
Get Radiology Tree app to read full this article<
Future Applications
Get Radiology Tree app to read full this article<
Get Radiology Tree app to read full this article<
Conclusion
Get Radiology Tree app to read full this article<
Acknowledgments
Get Radiology Tree app to read full this article<
References
1. Pierpaoli C., Jezzard P., Basser P.J., et. al.: Diffusion tensor MR imaging of the human brain. Radiology 1996; 201: pp. 637-648.
2. Melhem E.R., Mori S., Mukundan G., et. al.: Diffusion tensor MR imaging of the brain and white matter tractography. Am J Roentgenol 2002; 178: pp. 3-16.
3. McGowan J.C.: Technical issues for MRI examination of the spinal cord. J Neurol Sci 2000; 172: pp. 15.
4. Castillo M.: Diffusion-weighted imaging of the spine: is it reliable?. AJNR Am J Neuroradiol 2003; 24: pp. 1251-1253.
5. Clark C.A., Barker G.J., Tofts P.S.: Magnetic resonance diffusion imaging of the human cervical spinal cord in vivo. Magn Reson Med 1999; 41: pp. 1269-1273.
6. Ries M., Jones R.A., Dousset V., et. al.: Diffusion tensor MRI of the spinal cord. Magn Reson Med 2000; 44: pp. 884-892.
7. Moseley M.E., Cohen Y., Kucharczyk J., et. al.: Diffusion-weighted MR imaging of anisotropic water diffusion in cat central nervous system. Radiology 1990; 176: pp. 439-445.
8. Henkelman R.M., Stanisz G.J., Kim J.K., et. al.: Anisotropy of NMR properties of tissues. Magn Reson Med 1994; 32: pp. 592-601.
9. Schwartz E.D., Cooper E.T., Fan Y., et. al.: MRI diffusion coefficients in spinal cord correlate with axon morphometry. Neuroreport 2005; 16: pp. 73-76.
10. Pierpaoli C., Basser P.J.: Toward a quantitative assessment of diffusion anisotropy. Magn Reson Med 1996; 36: pp. 893-906.
11. Ulug A.M., van Zijl P.C.M.: Orientation-independent diffusion imaging without tensor diagonalization: anisotropy definitions based on physical attributes of the diffusion ellipsoid. J Magn Reson Imaging 1999; 9: pp. 804-813.
12. Bergman RA, Afifi AK, Heidger PM. Atlas of microscopic anatomy. Online Source, http://www.anatomyatlas.org ; 2007.
13. Mamdani E.H., Assilian S.: An experiment in linguistic synthesis with a fuzzy logic controller. Int J Man Mach Stud 1975; 7: pp. 1-13.
14. Alexander A.L., Hasan K., Kindlmann G., et. al.: A geometric analysis of diffusion tensor measurements of the human brain. Magn Reson Med 2000; 44: pp. 283-291.
15. Hanley J.A., McNeil B.J.: The meaning and use of the area under a receiver operating characteristic (ROC) curve. Radiology 1982; 143: pp. 29-36.
16. Bamber D.: The area above the ordinal dominance graph and the area below the receiver operating characteristic graph. J Math Psychol 1975; 12: pp. 387-415.
17. Stephens M.A.: EDF statistics for goodness of fit and some comparisons. J Am Stat Assoc 1974; 69: pp. 730-737.
18. Mamata H., Jolesz F.A., Maier S.E.: Characterization of central nervous system structures by magnetic resonance diffusion anisotropy. Neurochem Int 2004; 45: pp. 553-560.
19. Yoshiura T., Wu O., Zaheer A., et. al.: Highly diffusion-sensitized MRI of brain: dissociation of gray and white matter. Magn Reson Med 2001; 45: pp. 734-740.
20. Ishikawa M., Matsumoto M., Fujimura Y., et. al.: Changes of the cervical spinal cord and cervical spinal canal with age in asymptotic subjects. Spinal Cord 2003; 41: pp. 159-163.
21. Holder C.A., Muthupillai R., Mukundan S., et. al.: Diffusion-weighted MR imaging of the normal human spinal cord in vivo. AJNR Am J Neuroradiol 2000; 21: pp. 1799-1806.
22. Tsuchiya K., Katase S., Fujikawa A., et. al.: Diffusion-weighted MRI of the cervical spinal cord using a single-shot fast spin-echo technique: findings in normal subjects and in myelomalacia. Neuroradiology 2003; 45: pp. 90-94.
23. Maier S.E., Mamata H.: Diffusion tensor imaging of the spinal cord. Ann NY Acad Sci 2005; 1064: pp. 50-60.
24. Clark C.A., Werring D.J.: Diffusion tensor imaging in spinal cord: methods and applications—a review. NMR Biomed 2002; 15: pp. 578-586.
25. Kaufman L., Kramer D.M., Crooks L.E., et. al.: Measuring signal-to-noise ratios in MR imaging. Radiology 1989; 173: pp. 265-267.
26. Gudbjartsson H., Haier S.E., Mulkern R.V., et. al.: Line scan diffusion imaging. Magn Reson Med 1996; 36: pp. 509-519.
27. Bammer R., Herneth A.M., Maier S.E., et. al.: Line scan diffusion imaging of the spine. Proc Intl Soc Mag Reson Med 2002; 10: pp. 281.
28. Cercignani M., Horsfield M.A., Agosta F., et. al.: Sensitivity-encoded diffusion tensor MR imaging of the cervical cord. AJNR Am J Neuroradiol 2003; 24: pp. 1254-1256.
29. Bammer R., Fazekas F., Augustin M., et. al.: Diffusion-weighted MR imaging of the spinal cord. AJNR Am J Neuroradiol 2000; 21: pp. 587-591.
30. Bammer R., Stollberger R., Augustin M., et. al.: Diffusion-weighted imaging with navigated interleaved echo-planar imaging and a conventional gradient system. Radiology 1999; 211: pp. 799-806.
31. Du Y.P., Zhou X.J., Bernstein M.A.: Correction of concomitant field-induced image artifacts in nonaxial echo-planar imaging. Magn Reson Med 2002; 48: pp. 509-515.
32. Weisskoff R.M., Cohen , Rzedzian R.R.: Nonaxial whole-body instant imaging. milliseconds Magn Reson Med 1993; 29: pp. 796-798.
33. Algorri M.E., Flores-Mangas F.: Classification of anatomical structures in MR brain images using fuzzy parameters. IEEE Trans Biomed Eng 2004; 51: pp. 1599-1608.
34. Denkowski M., Chlebiej M., Mikolajczak P.: Segmentation of human brain MR images using rule-based fuzzy logic inference. Stud Health Technol Inform 2004; 105: pp. 264-272.
35. Badawi A.M., Derbala A.S., Youssef A.M.: Fuzzy logic algorithm for quantitative tissue characterization of diffuse liver diseases from ultrasound images. Int J Med Inform 1999; 55: pp. 135-147.
36. Klein H.M., Eisele T., Klose K.C., et. al.: Pattern recognition for focal liver lesions using “crisp” and “fuzzy” classifiers. Invest Radiol 1996; 31: pp. 6-10.
37. Lalande A., Legrand L., Walker P.M., et. al.: Automatic detection of left ventricular contours from cardiac cine magnetic resonance imaging using fuzzy logic. Invest Radiol 1999; 34: pp. 211-217.
38. Patwardhan S.V., Dai S., Dhawan A.P.: Multi-spectral image analysis and classification of melanoma using fuzzy membership based partitions. Comput Med Imaging Graph 2005; 29: pp. 287-296.
39. Stanley R.J., Moss R.H., Van Stoecker W., et. al.: A fuzzy-based histogram analysis technique for skin lesion discrimination in dermatology clinical images. Comput Med Imaging Graph 2003; 27: pp. 387-396.
40. Park W., Hoffman E.A., Sonka M.: Segmentation of intrathoracic airway trees: a fuzzy logic approach. IEEE Trans Med Imaging 1998; 17: pp. 489-497.
41. Cheng H.D., Liu Y.M., Freimanis R.I.: A novel approach to microcalcification detection using fuzzy logic technique. IEEE Trans Med Imaging 1998; 17: pp. 442-450.
42. Mamata H., Jolesz F.A., Maier S.E.: Apparent diffusion coefficient and fractional anisotropy in spinal cord: age and cervical spondylosis-related changes. J Magn Reson Imaging 2005; 22: pp. 38-43.
43. Schwartz E.D., Cooper E.T., Chin C.L., et. al.: Ex vivo Evaluation of ADC values within spinal cord white matter tracts. AJNR Am J Neuroradiol 2005; 26: pp. 390-397.
44. Ford J.C., Hackney D.B., Lavi E., et. al.: Dependence of apparent diffusion coefficients on axonal spacing, membrane permeability, and diffusion time in spinal cord white matter. J Magn Reson Imaging 1998; 8: pp. 775-782.
45. Schwartz E.D., Chin C.L., Shumsky J.S., et. al.: Apparent diffusion coefficients in spinal cord transplants and surrounding white matter correlate with degree of axonal dieback after injury in rats. AJNR Am J Neuroradiol 2005; 26: pp. 7-18.
46. Ford J.C., Hackney D.B., Joseph P.M., et. al.: A method for in vivo high resolution MRI of rat spinal cord injury. Magn Reson Med 1994; 31: pp. 218-223.
47. Schwartz E.D., Hackney D.B.: Diffusion-weighted MRI and the evaluation of spinal cord axonal integrity following injury and treatment. Exp Neurol 2003; 184: pp. 570-589.
48. Nevo U., Hauben E., Yoles E., et. al.: Diffusion anisotropy MRI for quantitative assessment of recovery in the rat spinal cord. Magn Reson Med 2001; 45: pp. 1-9.