
Rationale and Objectives
We aimed to determine if both evidence level (EL) as well as clinical efficacy (CE) of imaging manuscripts have changed over the last 20 years.
Materials and Methods
With our review of medical literature, Institutional Review Board approval was waived, and no informed consent was required. Using Web of Science, we determined the 10 highest impact factor imaging journals. For each journal the 10 most cited and 10 average cited papers were compared for the following years: 1994, 1998, 2002, 2006, 2010, and 2014. EL was graded using the same criteria as the Journal of Bone and Joint Surgery (Wright et al., 2003). CE was graded using the criteria of Thornbury and Fryback (1991). Statistical software R and package lme4 were used to fit mixed regression models with fixed effects for group, year, and a random effect for journal.
Results
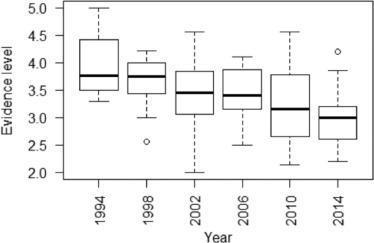
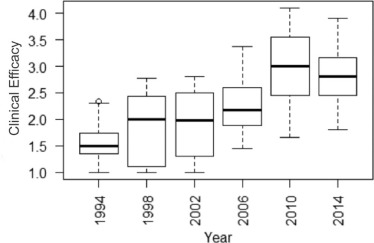
EL has improved −0.03 every year on average ( P < .001). The more cited papers had better ELs (group effect = −0.23, SE 0.09, P = .011). CE is lower in top cited compared to average cited articles, although the differences were not statistically significant (group effect = −0.14, SE = 0.09, P = .16). CE level increased modestly in both groups over this 20-year time period (0.06 per year, SE = 0.007, P < .001).
Conclusion
Over the last 20 years, imaging journal articles have improved modestly in quality of evidence, as measured by EL and CE.
Introduction
Government bodies and insurance companies often rely on scientific papers to make best quality care recommendations, which influence reimbursement decisions for medical and imaging procedures. To a large degree, the support for these decisions is based on the scientific strength of evidence available . For example, in the UK, the National Institute for Health and Care Excellence provides “technology appraisal guidance” which includes a systematic review of the available evidence with a preference for higher grade evidence such as randomized controlled trials . UK National Health Service organizations are mandated by law to provide payment for those technologies that have been vetted through this system . In France, Haute Autorite de Sante (HAS), the High Authority of Health, serves a similar role, providing recommendations to UNCAM (Union Nationale des Caisses d’Assurance Maladie), an organization which then uses these recommendations to determine reimbursement rates . Both of these authorities grade the available evidence for a particular treatment or diagnostic modality according to a scale of “evidence level” (EL), with the highest ELs being the most rigorous studies .
In the United States, with a multipayer system, including both government and private entities, reimbursement recommendations are much more complex, and often not generated by the payers themselves . The US Preventive Services Task Force (USPSTF) is responsible for creating recommendations—which payers can choose to support with reimbursement decisions or not—based upon the available evidence, with graded levels from A-I based upon the strength and quality of the published evidence . Meanwhile, the Medicare Payment Advisory Commission makes recommendations on Medicare reimbursements based upon these grades and other quality metrics, with private payers often following suit . These organizations, and others like them, evaluate the quality of research papers based upon several subjective and objective factors, including EL and clinical efficacy (CE) .
Get Radiology Tree app to read full this article<
Get Radiology Tree app to read full this article<
Get Radiology Tree app to read full this article<
Materials and Methods
Get Radiology Tree app to read full this article<
Get Radiology Tree app to read full this article<
Get Radiology Tree app to read full this article<
Get Radiology Tree app to read full this article<
Get Radiology Tree app to read full this article<
Get Radiology Tree app to read full this article<
Results
Get Radiology Tree app to read full this article<
Get Radiology Tree app to read full this article<
TABLE 1
Average Cited Papers—Number in Each Evidence Level for Each Year
Year EL 1 EL 2 EL 3 EL 4 EL 5 Average for Year 2014 4 26 28 15 14 3.10 2010 8 20 14 25 17 3.27 2006 0 8 15 34 12 3.72 2002 0 8 17 25 10 3.61 1998 0 5 11 35 8 3.78 1994 0 5 9 18 10 3.78
EL, evidence level.
TABLE 2
Top Cited Papers—Number in Each Evidence Level for Each Year
Year EL 1 EL 2 EL 3 EL 4 EL 5 Average for Year 2014 8 38 24 17 13 2.89 2010 8 26 23 14 26 3.25 2006 5 19 22 7 13 3.06 2002 4 19 14 14 19 3.35 1998 1 11 12 22 11 3.54 1994 0 3 12 18 11 3.84
EL, evidence level.
Get Radiology Tree app to read full this article<
Get Radiology Tree app to read full this article<
TABLE 3
Average Cited Papers—Number in Each Clinical Efficacy Level for Each Year
CE 1 CE 2 CE 3 CE 4 CE 5 CE 6 Average for Year 2014 12 14 28 10 16 0 3.05 2010 11 32 30 8 16 0 2.86 2006 25 23 7 10 6 0 2.28 2002 39 21 2 5 5 0 1.83 1998 29 20 2 9 2 0 1.95 1994 34 14 3 3 3 0 1.72
CE, clinical efficacy.
TABLE 4
Top Cited Papers—Number in Each Clinical Efficacy Level for Each Year
CE 1 CE 2 CE 3 CE 4 CE 5 CE 6 Average for Year 2014 17 33 30 9 11 0 2.64 2010 13 27 28 10 21 1 3.02 2006 21 30 13 9 0 0 2.14 2002 33 23 8 5 5 0 2.00 1998 34 19 3 5 1 0 1.71 1994 40 16 1 1 1 0 1.42
CE, clinical efficacy.
Get Radiology Tree app to read full this article<
Get Radiology Tree app to read full this article<
TABLE 5
Evidence Level and Clinical Efficacy—Results of Mixed Regression Analysis, Fixed Effect
Group Effect Estimate Standard Error_P_ ValueEvidence level Top vs average cited papers −0.23 0.09 .011 \* Journal year −0.03 0.01 <.001 \* Clinical efficacy Top vs average cited papers −0.14 0.09 .16 Journal year 0.06 0.01 <.001 \*
Get Radiology Tree app to read full this article<
Get Radiology Tree app to read full this article<
Discussion
Get Radiology Tree app to read full this article<
Get Radiology Tree app to read full this article<
Get Radiology Tree app to read full this article<
Get Radiology Tree app to read full this article<
Get Radiology Tree app to read full this article<
Get Radiology Tree app to read full this article<
Get Radiology Tree app to read full this article<
Get Radiology Tree app to read full this article<
References
1. Wright J.G., Swiontkowski M.F., Heckman J.D.: Introducing levels of evidence to the journal. J Bone Joint Surg Am 2003; 85-A: pp. 1-3.
2. Into Practice : NICE: National Institute for Health and Care Excellence. Available at https://www.nice.org.uk/
3. Hull S.: Global evidence and reimbursement strategies. In: Consulting HAM, editor2011.
4. International Society for Pharmacoeconomics and Outcomes Research : United Kingdom (England and Wales) Reimbursement Process: International Society for Pharmacoeconomics and Outcomes Research. [updated October 2008]; Available at https://www.ispor.org/htaroadmaps/uk.asp
5. Haute Autorite de Sante : HAS—Haute Autorite de Sante. Available at http://www.has-sante.fr/portail/
6. France-Pharmeceuticals : France—Pharmaceuticals: International Society for Pharmacoeconomics and Outcomes Research. [updated October 2009]; Available at https://www.ispor.org/HTARoadMaps/France.asp
7. Patricia Connelly, ELS, CMR International Institute for Regulatory Science : Review and reimbursement: aligning the needs and requirements in clinical development. Workshop Report. Washington DC, USA2010. Available at http://cirsci.org/publications/1007_March_2010_Workshop_Review_and_Reimbursement.pdf
8. About the USPSTF : US Preventive Services Task Force: USPST. Available at http://www.uspreventiveservicestaskforce.org/
9. MEDPAC: The Medicare Payment Advisory Commission.2016.
10. Examination CTFotPH : The periodic health examination. Can Med Assoc J 1979; 121: pp. 1193-1254.
11. Oxford Centre for Evidence-based Medicine—levels of evidence (March 2009). Centre for Evidence-based Medicine; Available at http://www.cebm.net/oxford-centre-evidence-based-medicine-levels-evidence-march-2009/
12. Levels of evidence for clinical studies. Elsevier; Available at https://www.elsevier.com/__data/promis_misc/Levels_of_Evidence.pdf
13. Schweitzer M.E.: Evidence level. J Magn Reson Imaging 2016; 43: pp. 543.
14. Fryback D.G., Thornbury J.R.: The efficacy of diagnostic imaging. Med Decis Making 1991; 11: pp. 88-94.
15. Gazelle G.S., Kessler L., Lee D.W., et. al.: A framework for assessing the value of diagnostic imaging in the era of comparative effectiveness research. Radiology 2011; 261: pp. 692-698.
16. Bossuyt P.M., Reitsma J.B., Bruns D.E., et. al.: The STARD statement for reporting studies of diagnostic accuracy: explanation and elaboration. Ann Intern Med 2003; 138: pp. W1-W12.
17. Yarascavitch B.A., Chuback J.E., Almenawer S.A., et. al.: Levels of evidence in the neurosurgical literature: more tribulations than trials. Neurosurgery 2012; 71: pp. 1131-1137. discussion 7–8
18. Al-Harbi K., Farrokhyar F., Mulla S., et. al.: Classification and appraisal of the level of clinical evidence of publications from the Canadian Association of Pediatric Surgeons for the past 10 years. J Pediatr Surg 2009; 44: pp. 1013-1017.
19. Grant H.M., Tjoumakaris F.P., Maltenfort M.G., et. al.: Levels of evidence in the clinical sports medicine literature: are we getting better over time?. Am J Sports Med 2014; 42: pp. 1738-1742.
20. Schulze R.: The efficacy of diagnostic imaging. Dentomaxillofac Radiol 2012; 41: pp. 443.
21. Hollingworth W., Jarvik J.G.: Technology assessment in radiology: putting the evidence in evidence-based radiology. Radiology 2007; 244: pp. 31-38.
22. Web of Science: Thomson Reuters. Available at http://apps.webofknowledge.com Accessed February 2016–February 2017
23. Altman D.G.: Practical statistics for medical research.1st ed.1991.Chapman & HallLondon
24. Sinno H., Neel O.F., Lutfy J., et. al.: Level of evidence in plastic surgery research. Plast Reconstr Surg 2011; 127: pp. 974-980.
25. Borawski K.M., Norris R.D., Fesperman S.F., et. al.: Levels of evidence in the urological literature. J Urol 2007; 178: pp. 1429-1433.
26. Lai T.Y., Leung G.M., Wong V.W., et. al.: How evidence-based are publications in clinical ophthalmic journals?. Invest Ophthalmol Vis Sci 2006; 47: pp. 1831-1838.
27. Rodrigues M.A., Tedesco A.C., Nahas F.X., et. al.: Journal impact factor versus the evidence level of articles published in plastic surgery journals. Plast Reconstr Surg 2014; 133: pp. 1502-1507.
28. Jacobson D.A., Bhanot K., Yarascavitch B., et. al.: Levels of evidence: a comparison between top medical journals and general pediatric journals. BMC Pediatr 2015; 15: pp. 3.
29. Hanzlik S., Mahabir R.C., Baynosa R.C., et. al.: Levels of evidence in research published in The Journal of Bone and Joint Surgery (American Volume) over the last thirty years. J Bone Joint Surg Am 2009; 91: pp. 425-428.
30. Smidt N., Rutjes A.W., van der Windt D.A., et. al.: Quality of reporting of diagnostic accuracy studies. Radiology 2005; 235: pp. 347-353.
31. Dilauro M., McInnes M.D., Korevaar D.A., et. al.: Is there an association between STARD statement adherence and citation rate?. Radiology 2016; 280: pp. 62-67.