
Rationale and Objectives
To demonstrate the value of a new data visualization and exploration method for mutlireader-multicase receiver operating characteristic (MRMC-ROC) experiments of computer-aided detection (CAD) algorithms that uses three-dimensional (3D) heat maps tool adapted from gene expression array analysis.
Materials and Methods
We are using data from a clinical trial of a commercial CAD system for lung cancer detection (RapidScreen RS-2000, Riverain Medical Group, Miamisburg, OH, and Rockville, MD). 3D heat maps, originally developed for displaying changes in gene expression after cancer chemotherapy in MATLAB, were modified to display the radiologists confidence levels as they interpreted chest radiographs and used to visualize the radiologists confidence levels before and after the provision of a CAD system.
Results
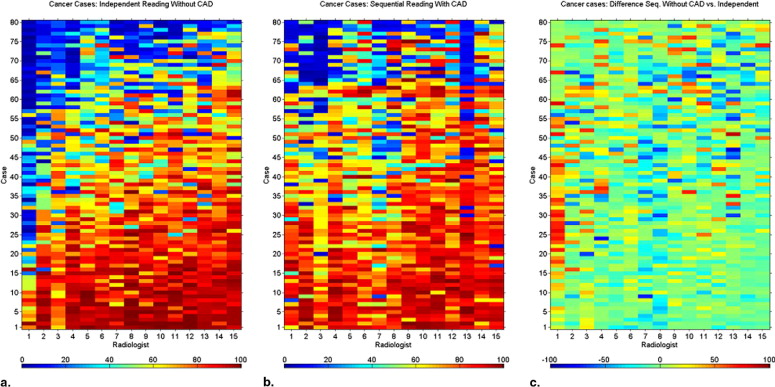
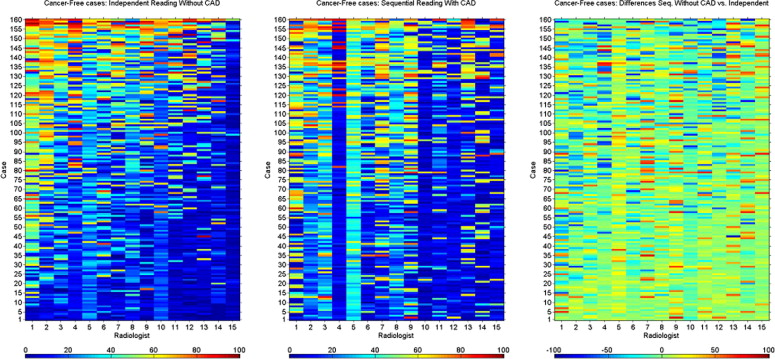
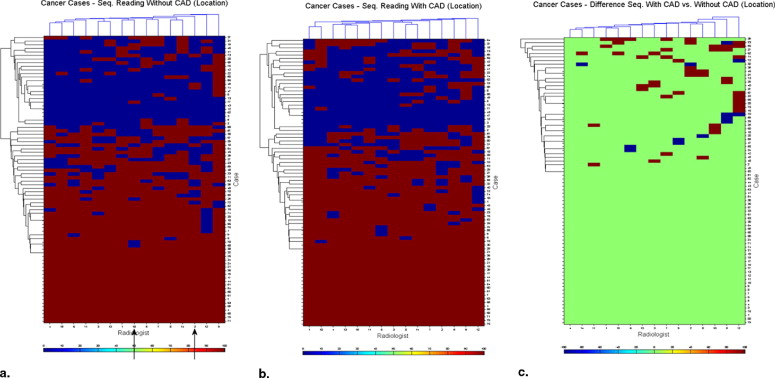
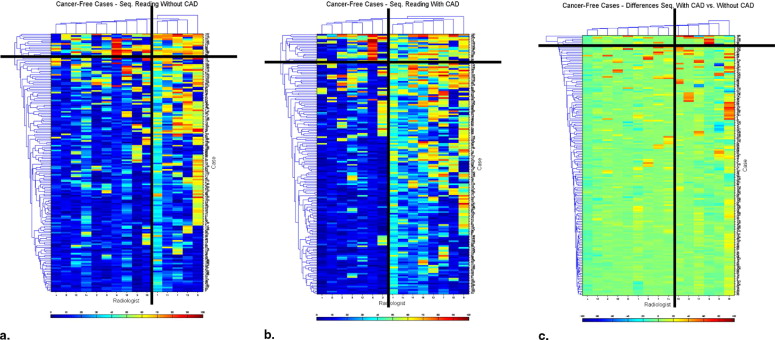
Heat maps demonstrated the variation among radiologists in their interpretation, and the degree of variation in interpretation when a single radiologist reinterpreted the same case without and with CAD modality. They demonstrated the variability in the identification of each cancer/cancer-free case and the variability of change seen when CAD prompts were provided.
Conclusions
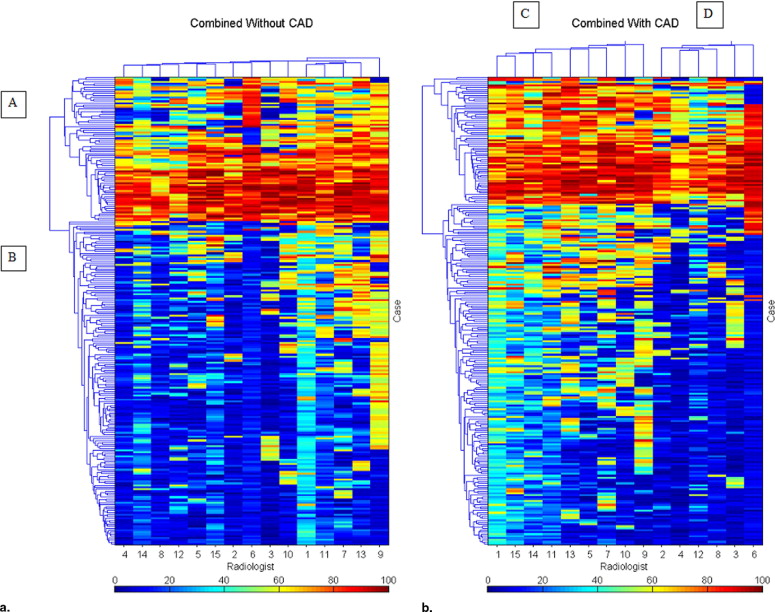
CAD increases the consistency of interpretation of a single radiologist and of a group of radiologists. Heat maps provide a method for data visualization that clarifies the effects of reader variability in ROC CAD experiments. We demonstrated how heat maps can be used to document the complexity of reader variability and suggested how clustering can reveal both nonintuitive and intuitive groupings of cases, readers, and the interaction of both with CAD.
Heat maps are a method for displaying three-dimensional data in two dimensions, with the third dimension represented by color. They are commonly used in gene expression experiments for data exploration, looking for clusters of similarity. We have applied them as an aid to understanding image perception using the data coming from a receiver operating characteristic (ROC) experiment ( ) where heat maps provide graphic display of important, but complex information. In this article, we will further explore the usefulness of this method in gaining understanding of how radiologists perform as they interpret complex radiographic images, using the chest radiograph with or without cancer interpreted without or with computer assistance.
Reader variability in the interpretation of radiographic images has been extensively studied and appears to be both unavoidable and potentially deleterious ( ). It results in variation in the interpretation of radiographs by the same radiologist when he or she views it a second time or when another radiologist views the same image. With complex images, variability that could be of clinical importance can occur in 20%–30% of interpretations, one reader interpretation finds disease, another misses it. Computer-aided device (CAD) appears to partially correct for this variability.
Get Radiology Tree app to read full this article<
Get Radiology Tree app to read full this article<
Materials and methods
Get Radiology Tree app to read full this article<
The Heat Map: A Two-Dimensional Display of Three-Dimensional Data
Get Radiology Tree app to read full this article<
Get Radiology Tree app to read full this article<
Get Radiology Tree app to read full this article<
Get Radiology Tree app to read full this article<
Get Radiology Tree app to read full this article<
Get Radiology Tree app to read full this article<
Clustering of Data Demonstrated in Heat Maps
Get Radiology Tree app to read full this article<
Get Radiology Tree app to read full this article<
d(r,s)=1nr,ns∑nri=1∑nsj=1dist(xri,xsj) d
(
r
,
s
)
=
1
n
r
,
n
s
∑
i
=
1
n
r
∑
j
=
1
n
s
d
i
s
t
(
x
r
i
,
x
s
j
)
Where n r is the number of objects in cluster r and n s is the number of objects in cluster s , x ri is the i th object in cluster r and x sj is the j th object in cluster s ( ).
Get Radiology Tree app to read full this article<
Results
Get Radiology Tree app to read full this article<
Get Radiology Tree app to read full this article<
Get Radiology Tree app to read full this article<
Get Radiology Tree app to read full this article<
Get Radiology Tree app to read full this article<
Get Radiology Tree app to read full this article<
Get Radiology Tree app to read full this article<
Get Radiology Tree app to read full this article<
Get Radiology Tree app to read full this article<
Get Radiology Tree app to read full this article<
Get Radiology Tree app to read full this article<
Get Radiology Tree app to read full this article<
Get Radiology Tree app to read full this article<
Cancer-Free Cases
Get Radiology Tree app to read full this article<
Get Radiology Tree app to read full this article<
Get Radiology Tree app to read full this article<
Discussion
Get Radiology Tree app to read full this article<
Get Radiology Tree app to read full this article<
Get Radiology Tree app to read full this article<
Relationship to Kappa Analysis
Get Radiology Tree app to read full this article<
Get Radiology Tree app to read full this article<
Table 1
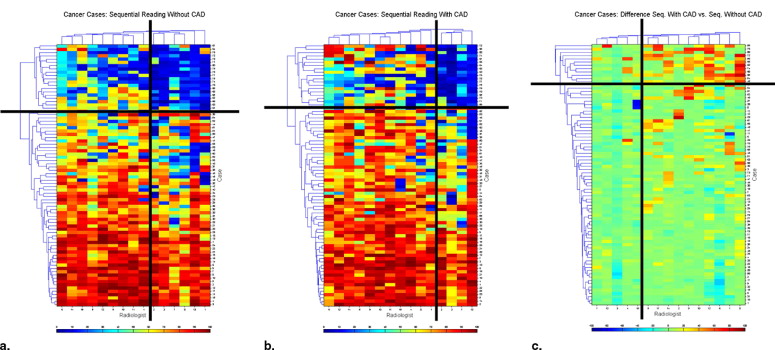
Radiologists’ Kappa Statistics and Agreement Statistics for Some of the Possible Radiologist Pairs Shown in Fig 4 a Providing Measurements of Agreement of Confidence Rates for Cancers on the Chest Radiographs
Sequential Reading without CAD - Cancer cases Radiologists in Order as Shown on the Figure 4 A Kappa Agreement Radiologists’ Agreement on Cases NO/NO NO/YES YES/NO YES/YES 1 & 2 0.568 0.813 18 8 7 47 1 & 3 0.381 0.750 12 14 6 48 1 & 4 0.525 0.800 16 10 6 48 1 & 5 0.671 0.850 22 4 8 46 1 & 6 0.501 0.788 16 10 7 47 1 & 7 0.544 0.800 18 8 8 46 1 & 8 0.577 0.813 19 7 8 46 1 & 9 0.633 0.838 20 6 7 47 1 & 10 0.601 0.813 22 4 11 43 1 & 11 0.539 0.788 20 6 11 43 1 & 12 0.420 0.725 19 7 15 39 1 & 13 0.577 0.813 19 7 8 46 1 & 14 0.683 0.850 24 2 10 44 1 & 15 0.525 0.775 21 5 13 41 4 & 15 0.357 0.700 16 6 18 40
Also listed are the types of agreement indicating false negatives (FN), “no,” and true positives (TP), “yes,” and combinations of TP and FN.
Get Radiology Tree app to read full this article<
Get Radiology Tree app to read full this article<
Get Radiology Tree app to read full this article<
Simple Agreement
Get Radiology Tree app to read full this article<
Relationship to ROC Analysis
Get Radiology Tree app to read full this article<
Get Radiology Tree app to read full this article<
Get Radiology Tree app to read full this article<
References
1. Freedman M.T., Osicka T.: Reader variability: what we can we learn from computer-aided detection experiments. J Am Coll Radiol 2006; 3: pp. 446-455.
2. Freedman M.T., Osicka T., Zhu Y., et. al.: Heat maps as a data visualization and exploration method for multireader-multicase ROC computer-aided detection experiments. Int J CARS 2006; 1: pp. 348-350.
3. Jiang Y., Nishikawa R.M., Schmidt R.A., et. al.: Potential of computer-aided diagnosis to reduce variability in radiologists’ interpretations of mammograms depicting microcalcifications. Radiology 2001; 220: pp. 787-794.
4. Yerushalmy J.: The statistical assessment of the variability in observer perception and description of roentgenographic pulmonary shadows. Radiol Clin North Am 1969; 7: pp. 381-392.
5. Beam C.A., Conant E.F., Sickles E.A.: Association of volume and volume independent factors with accuracy in screening mammogram interpretation. J Natl Cancer Inst 2003; 95: pp. 282-290.
6. Kobayashi T., Xu X.W., MacMahon H., et. al.: Effect of a computer-aided diagnosis scheme on radiologists’ performance in detection of lung nodules on radiographs. Radiology 1996; 99: pp. 843-848.
7. Awai K., Murao K., Ozawa A., et. al.: Pulmonary nodules at chest CT: effect of computer-aided diagnosis on Radiologists’ detection performance. Radiology 2004; 230: pp. 347-352.
8. Barlow W.E., Chi C., Carney P.A., et. al.: Accuracy of screening mammography interpretation by characteristics of radiologists. J Natl Cancer Inst 2004; 96: pp. 1840-1850.
9. Deus Technologies L.L.C.: RapidScreen RS-2000. http://www.fda.gov/cdrh/mda/docs/P000041.html
10. Stitik F., Tockman M.: Radiographic screening in the early detection of lung cancer. Radiol Clin North Am 1978; 16: pp. 347-366.
11. Stitik F., Tockman M., Khouri N.: Chest radiology.Miller A.B.Screening for cancer.1985.Academic PressNew York:pp. 163-191.
12. Austin J.H.M., Romney B.M., Goldsmith L.S.: Missed bronchogenic carcinoma: radiographic findings in 27 patients with a potentially resectable lesion evident in retrospect. Radiology 1992; 182: pp. 115-122.
13. Quekel L.G., Kessels A.G., Goei R., van Engelshoven J.M.: Miss rate of lung cancer on the chest radiograph in clinical practice. Chest 1999; 115: pp. 720-724.
14. Shah P.K., Austin J.H., White C.S., et. al.: Missed non-small cell lung cancer: Radiographic findings of potentially resectable lesions evident only in retrospect. Radiology 2003; 226: pp. 235-241.
15. Bar-Joseph Z., Gifford D.K., Jaakkola T.S.: Fast optimal leaf ordering for hierarchical clustering. Bioinformatics 2001; 17: pp. S22-S29.
16. Eisen M.B., Spellman P.T., Brown P.O., Botstein D.: Cluster analysis and display of genome-wide expression patterns. Proc Natl Acad Sci U S A 1998; 95: pp. 14863-14868.
17. Matlab tutorial v.2006b, 1984–2006 The MathWorks, Inc.
18. Elmore J.G., Miglioretti D.L., Reisch L.M., et. al.: Screening mammograms by community radiologists: variability in false-positive rates. J Natl Cancer Inst 2002; 94: pp. 1373-1380.
19. Beiden S.V., Wagner R.F., Nishikawa R.M., et. al.: Independent versus sequential reading in ROC studies of computer-assist modalities. Proc SPIE Med Imag 2002; 4686: pp. 198-204.
20. Beiden S.V., Wagner R.F., Doi K., et. al.: Independent versus sequential reading in ROC studies of computer-assist modalities: analysis of components of variance. Acad Radiol 2002; 9: pp. 1036-1043.